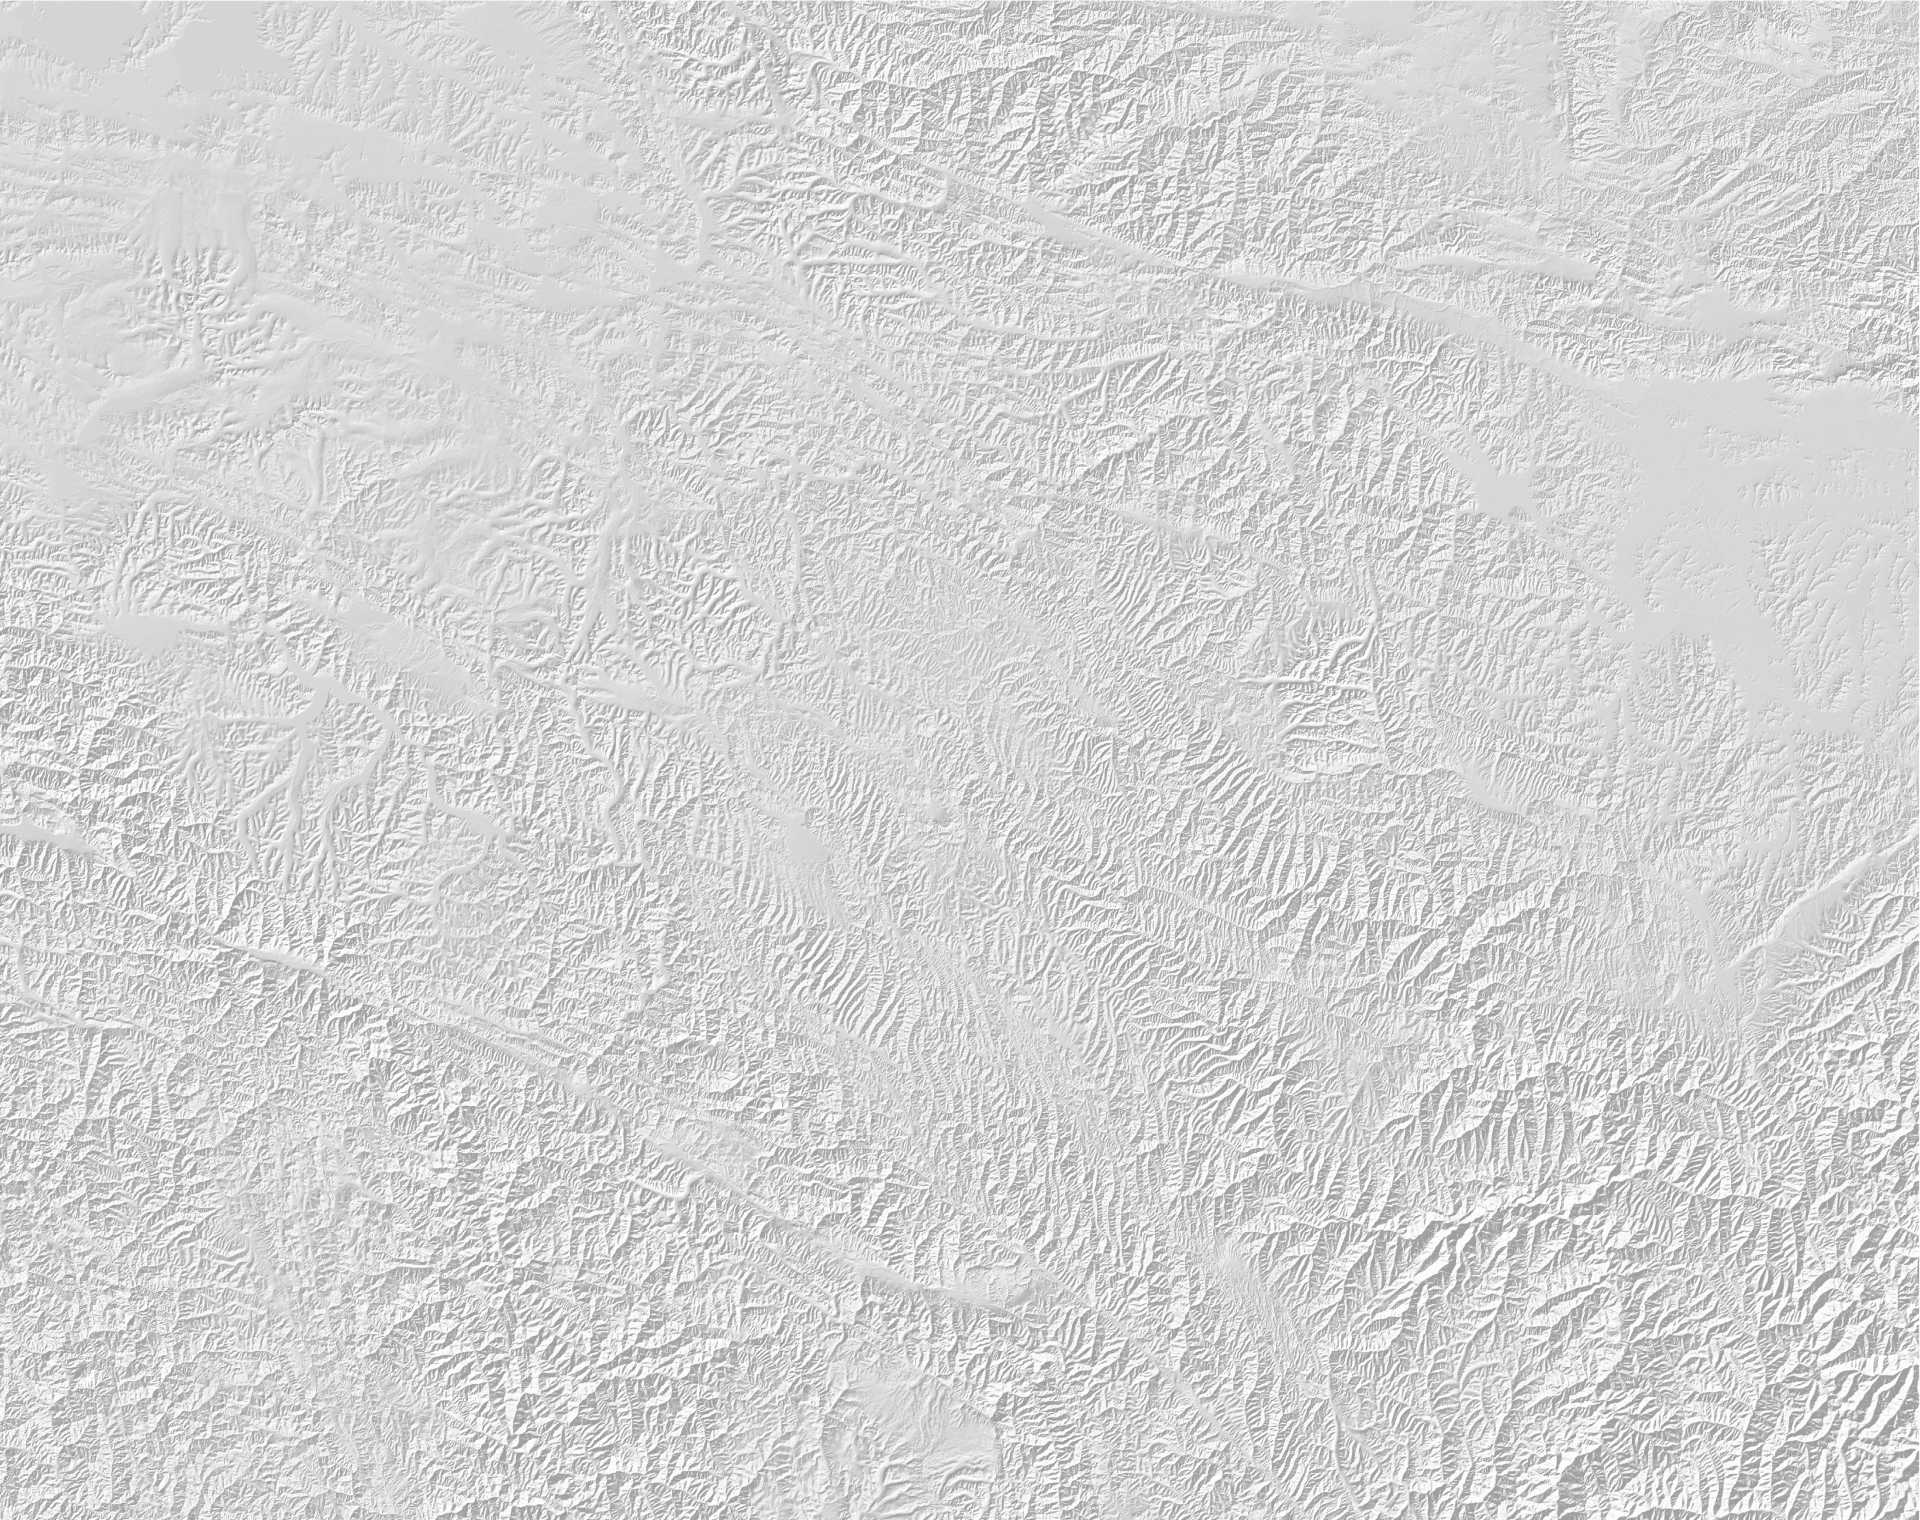

The Main Kopeh Dagh Fault in Turkmenistan is more than impressive. It’s a NW-SE trending right-lateral strike-slip fault with a wonderful morphological expression that can be traced for several hundreds of kilometres. This fault marks the northernmost deformation front of the Eastern Iran-Eurasia convergence zone, and Turkmenistan’s capital, Ashgabat, sits right on one of its strands. Last year, an EwF team conducted field work in order to determine the fault’s slip rate by dating offset alluvial fans and river terraces. This year, another expedition set off to Turkmenistan with the aim to find out when the last major earthquake happened on this fault. Knowledge on the last major event would help us to better understand the rupture behaviour of this fault, and to get an idea on the hazard it poses to the people living next to it. The devastating Ashgabat Earthquake of 1948 probably did not rupture the main fault, but a secondary strand. However, there is abundance evidence for single-event surface rupture not very long ago, geologically speaking. James Jackson (Cambridge), Richard Walker (Oxford), Nick Dodds (Oxford), and Christoph Grützner (Jena) visited several sites that could help to solve this question.
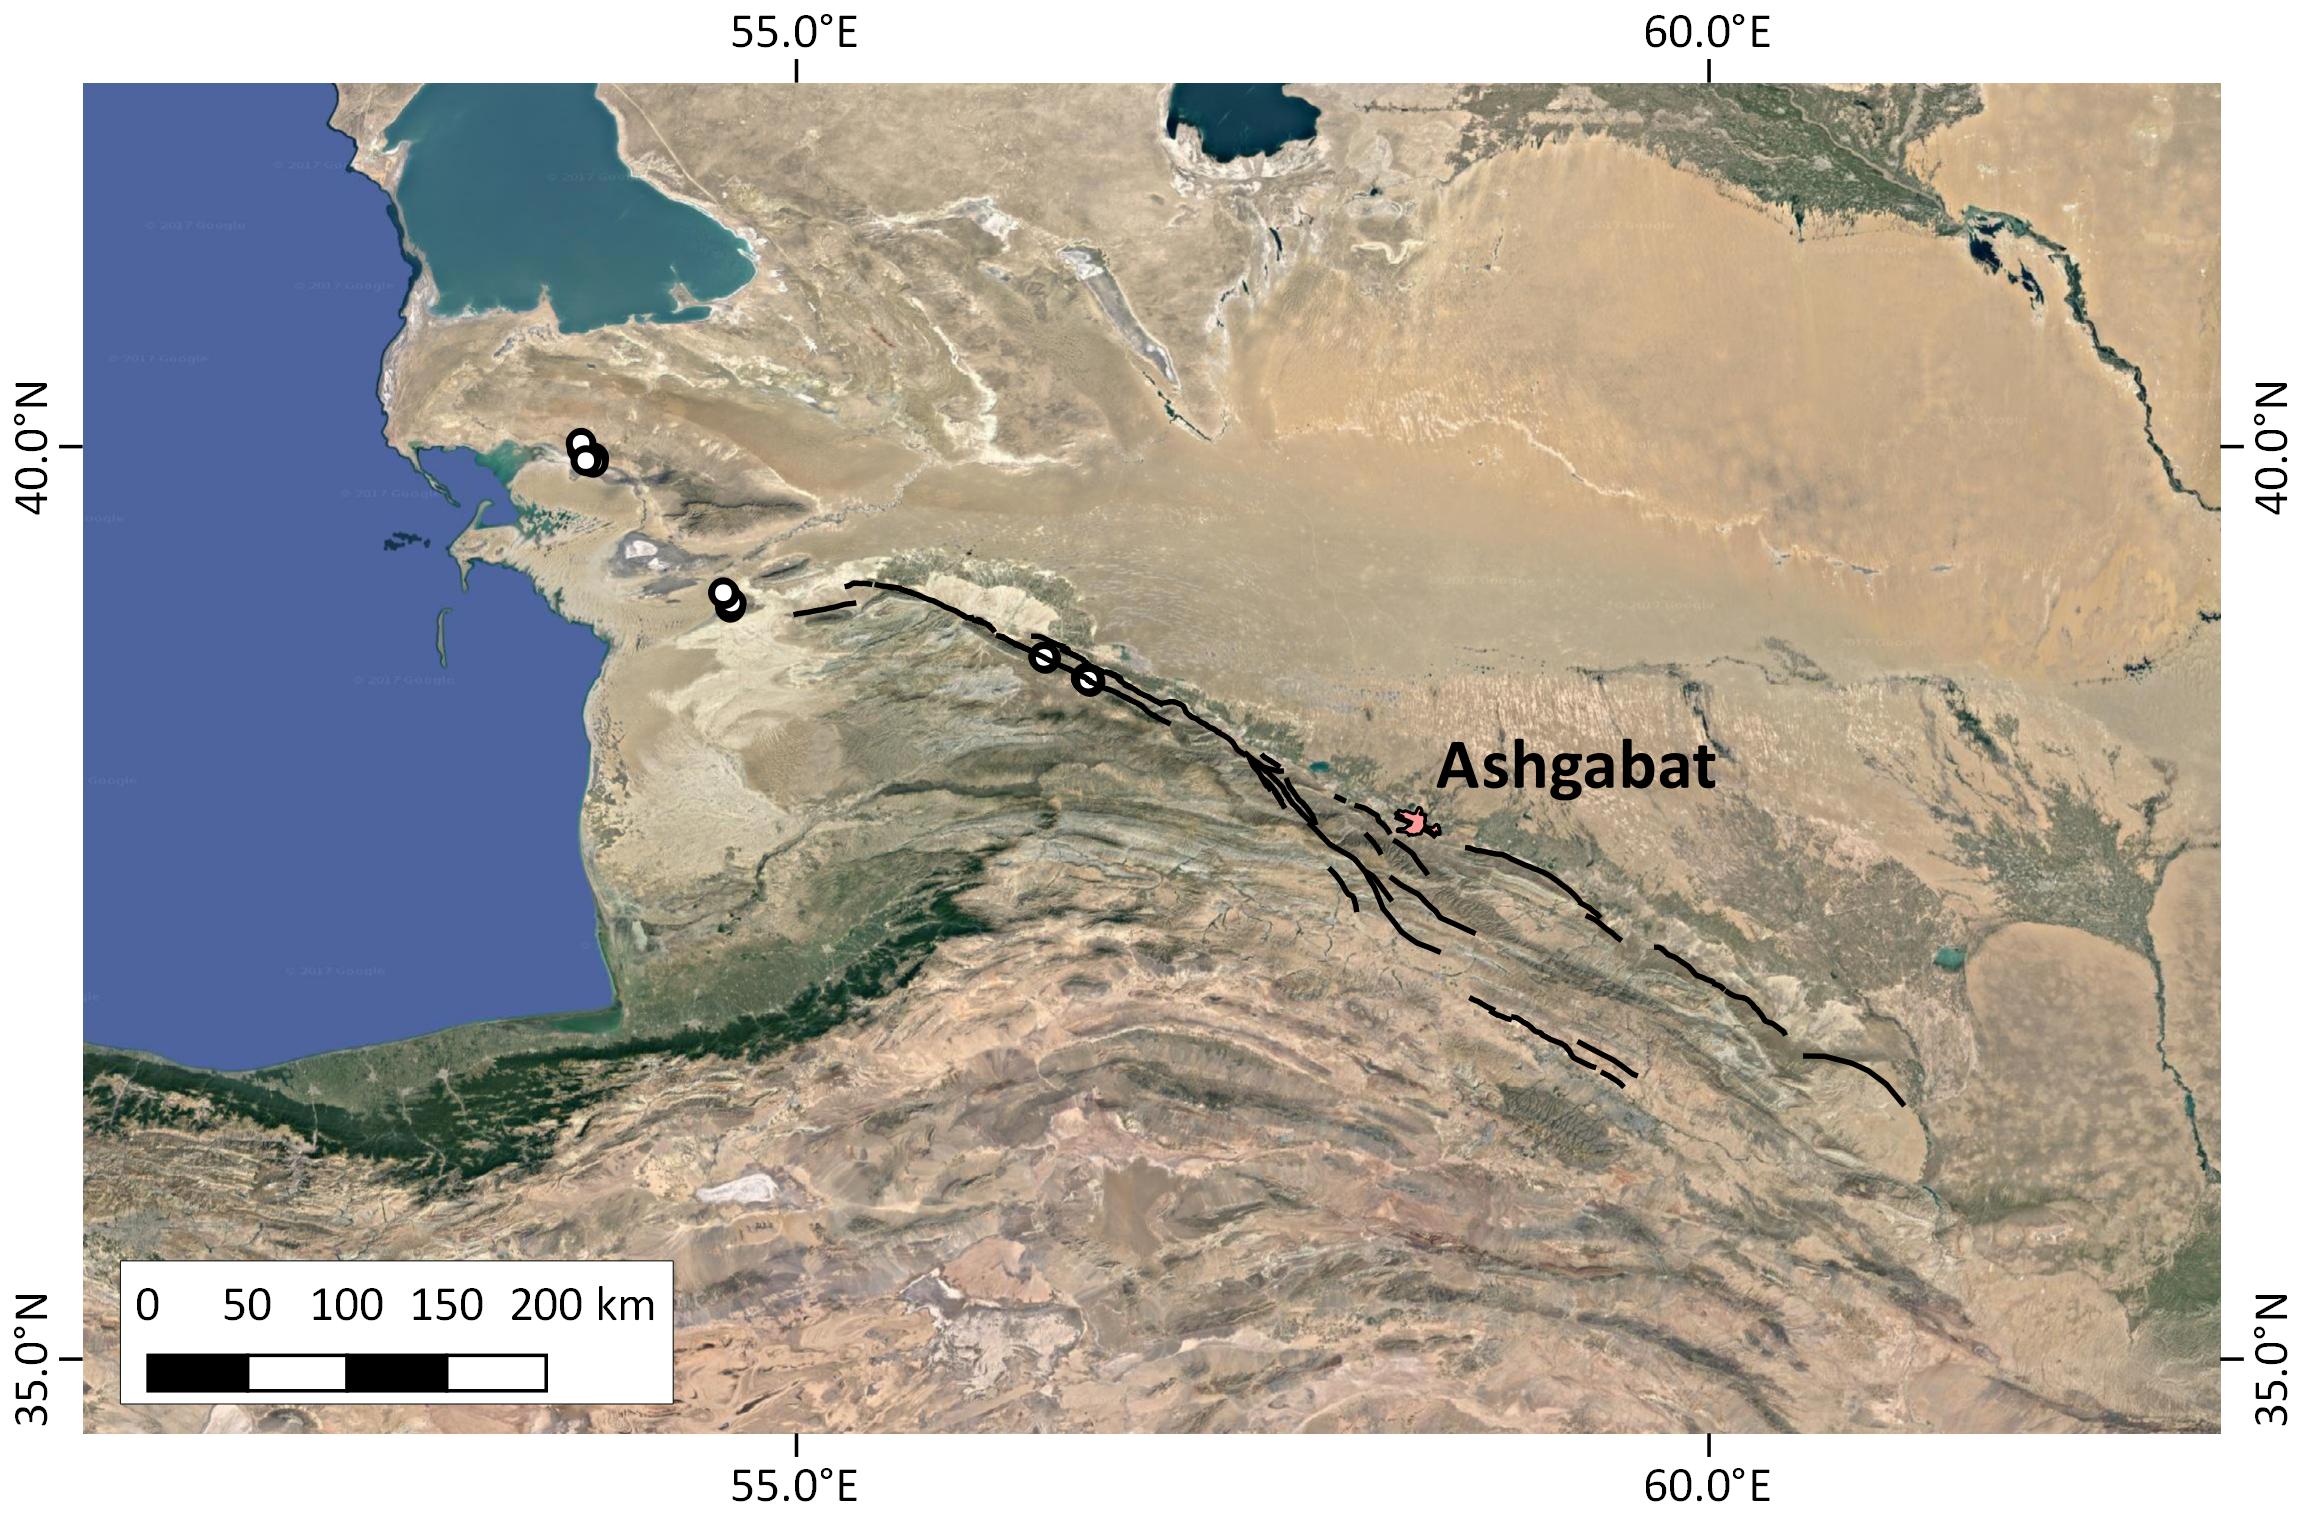
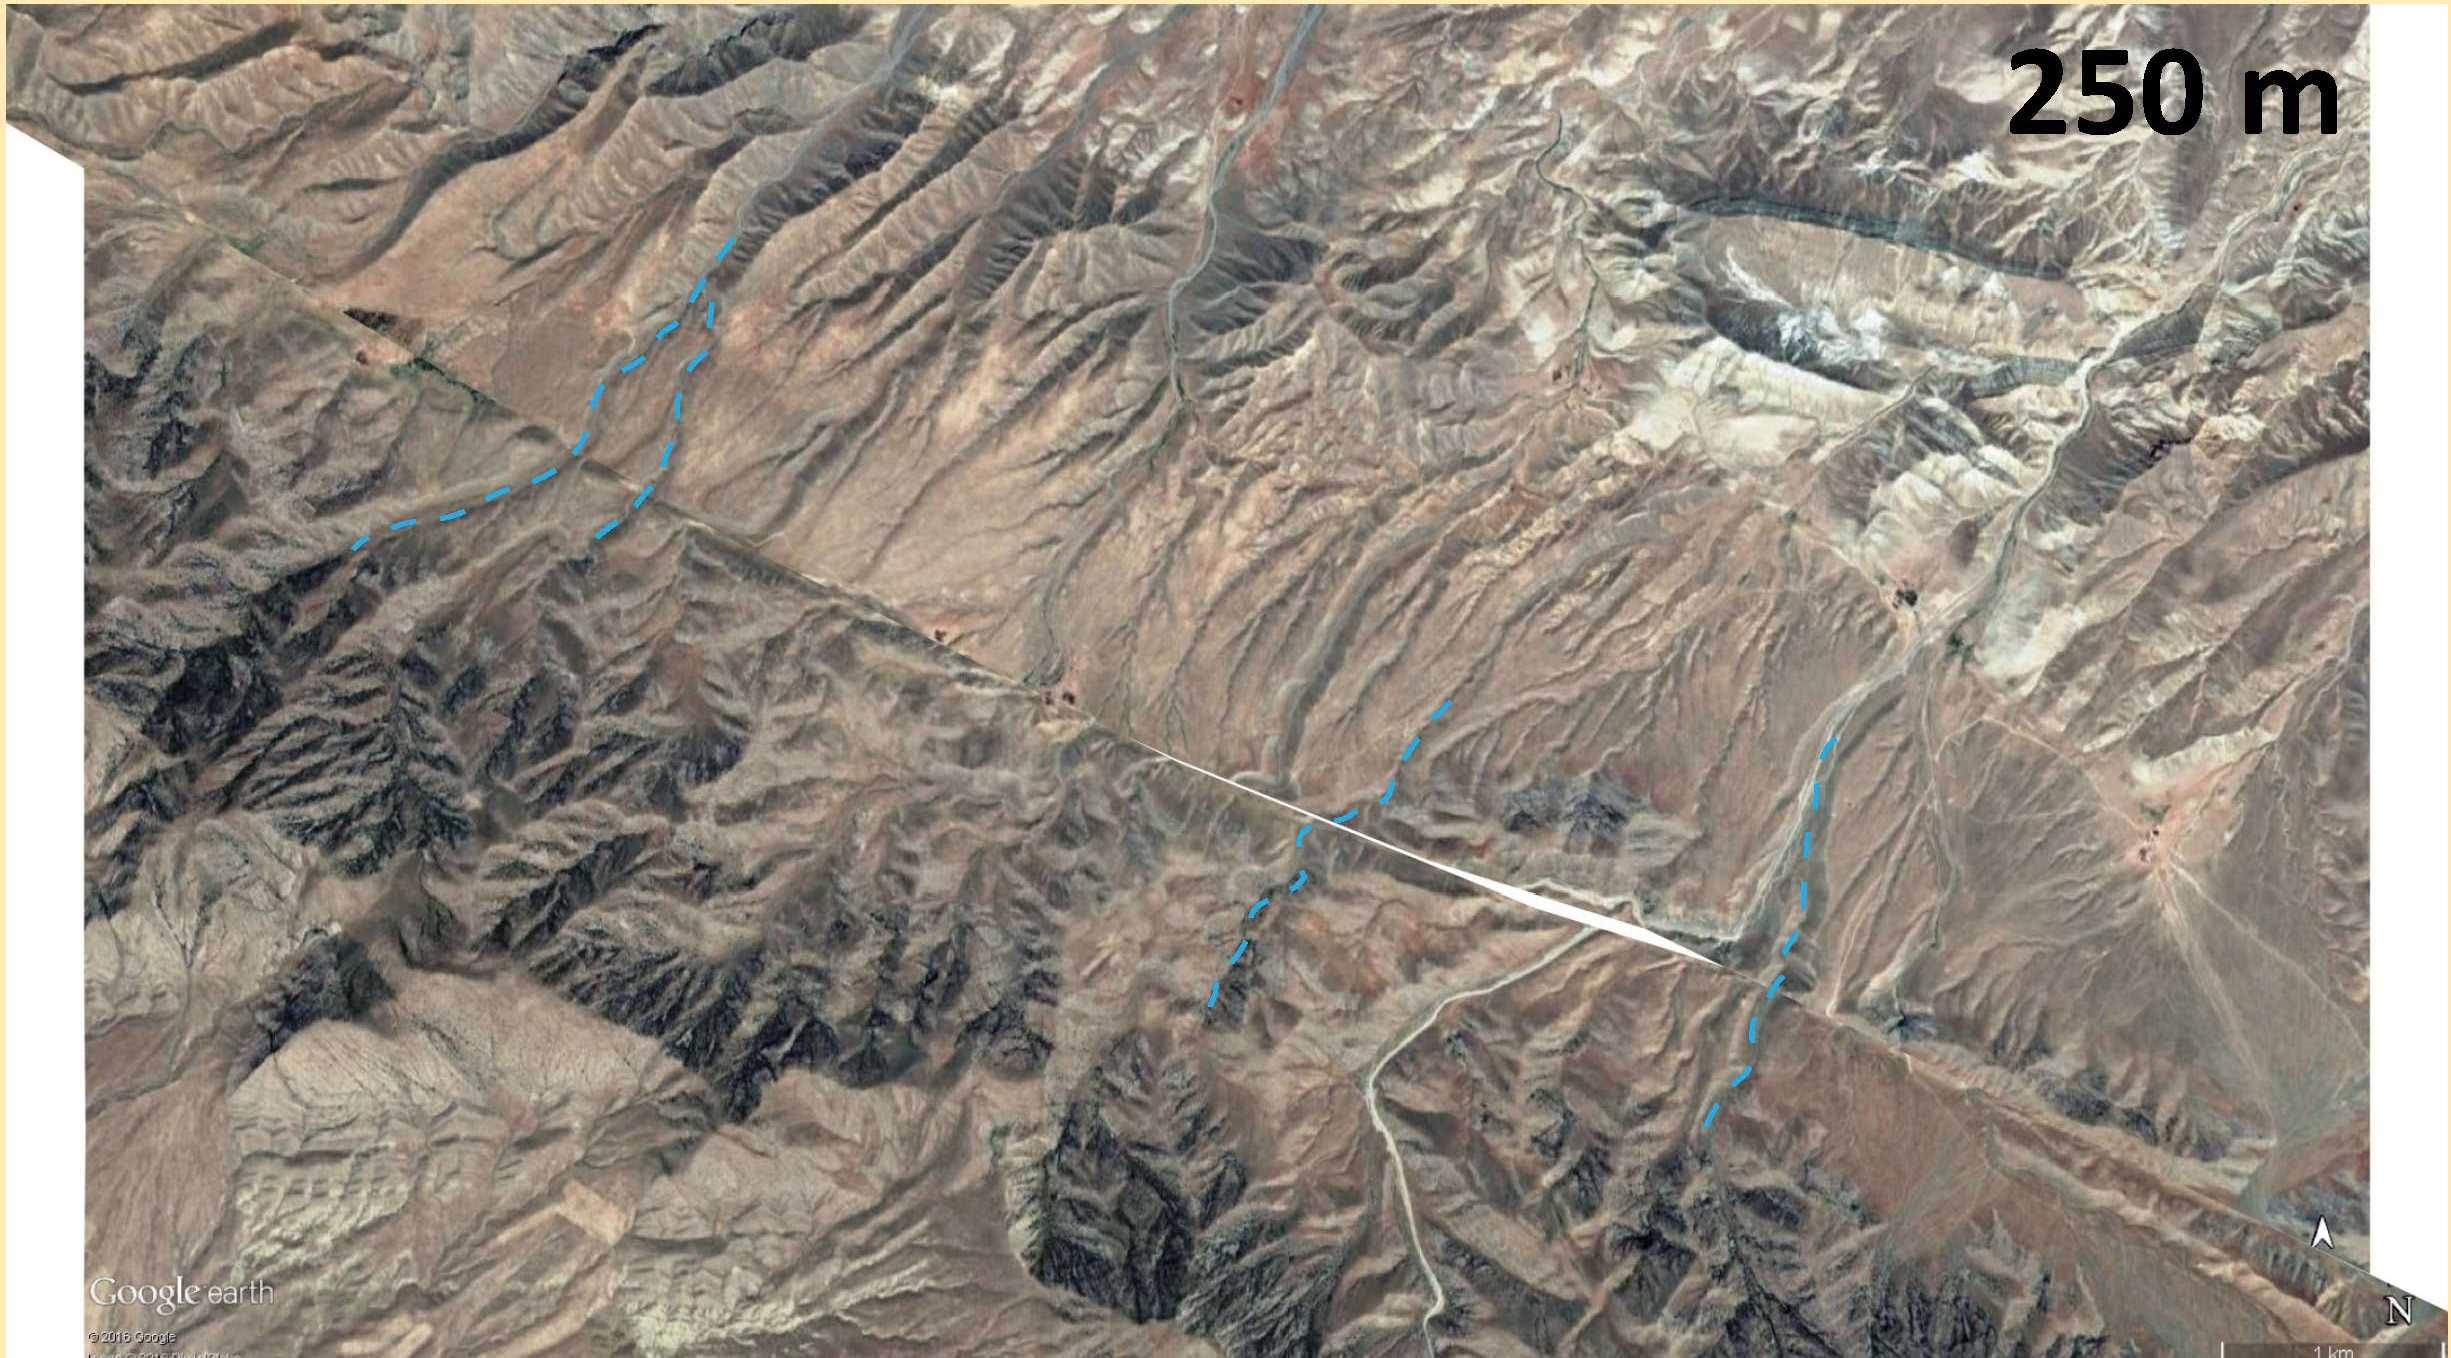
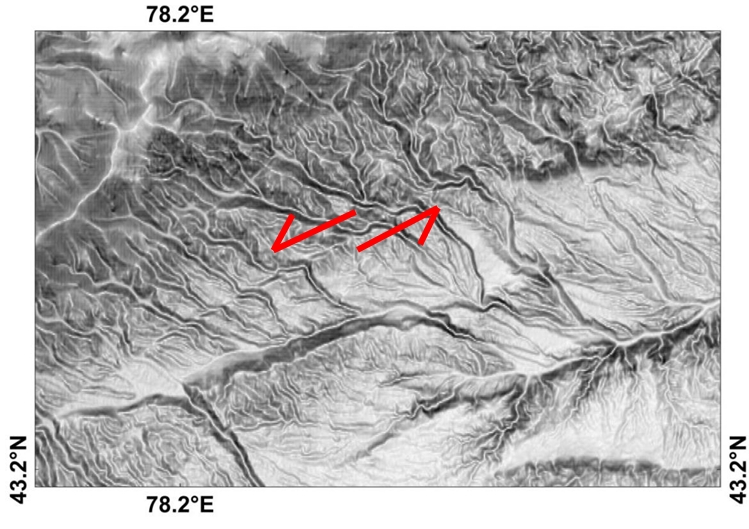
Map of the investigations in 2017.
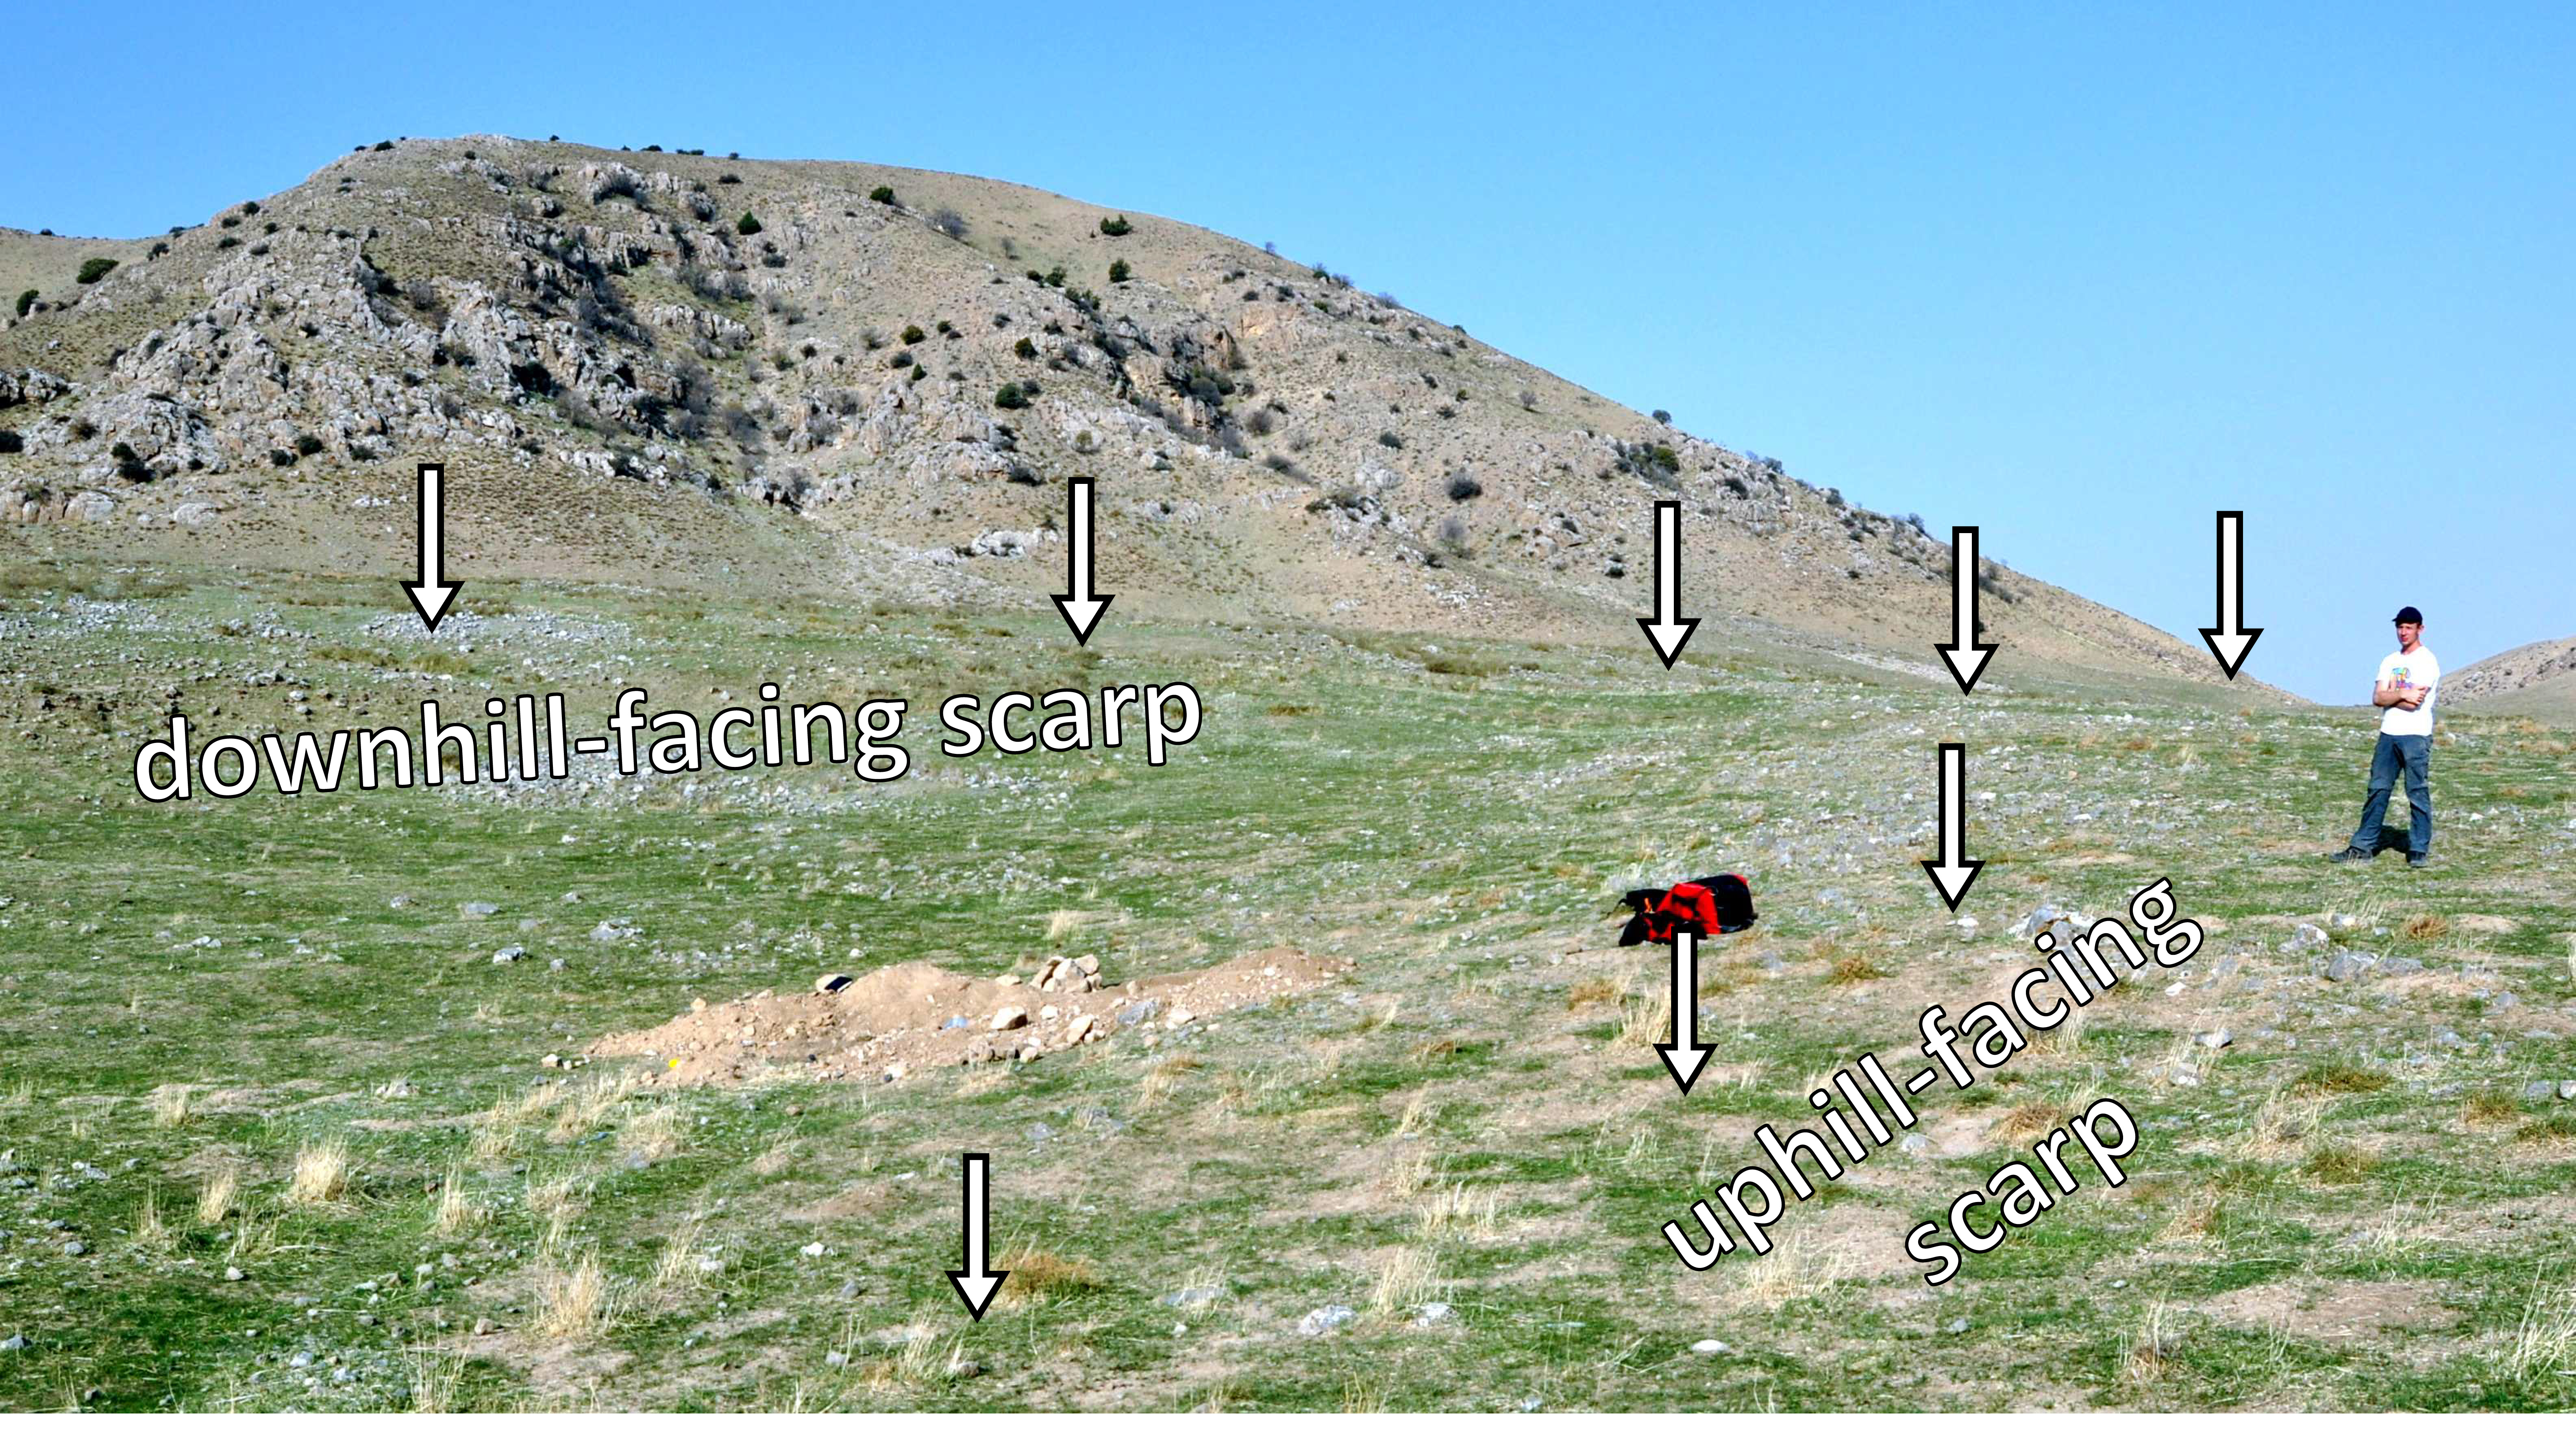
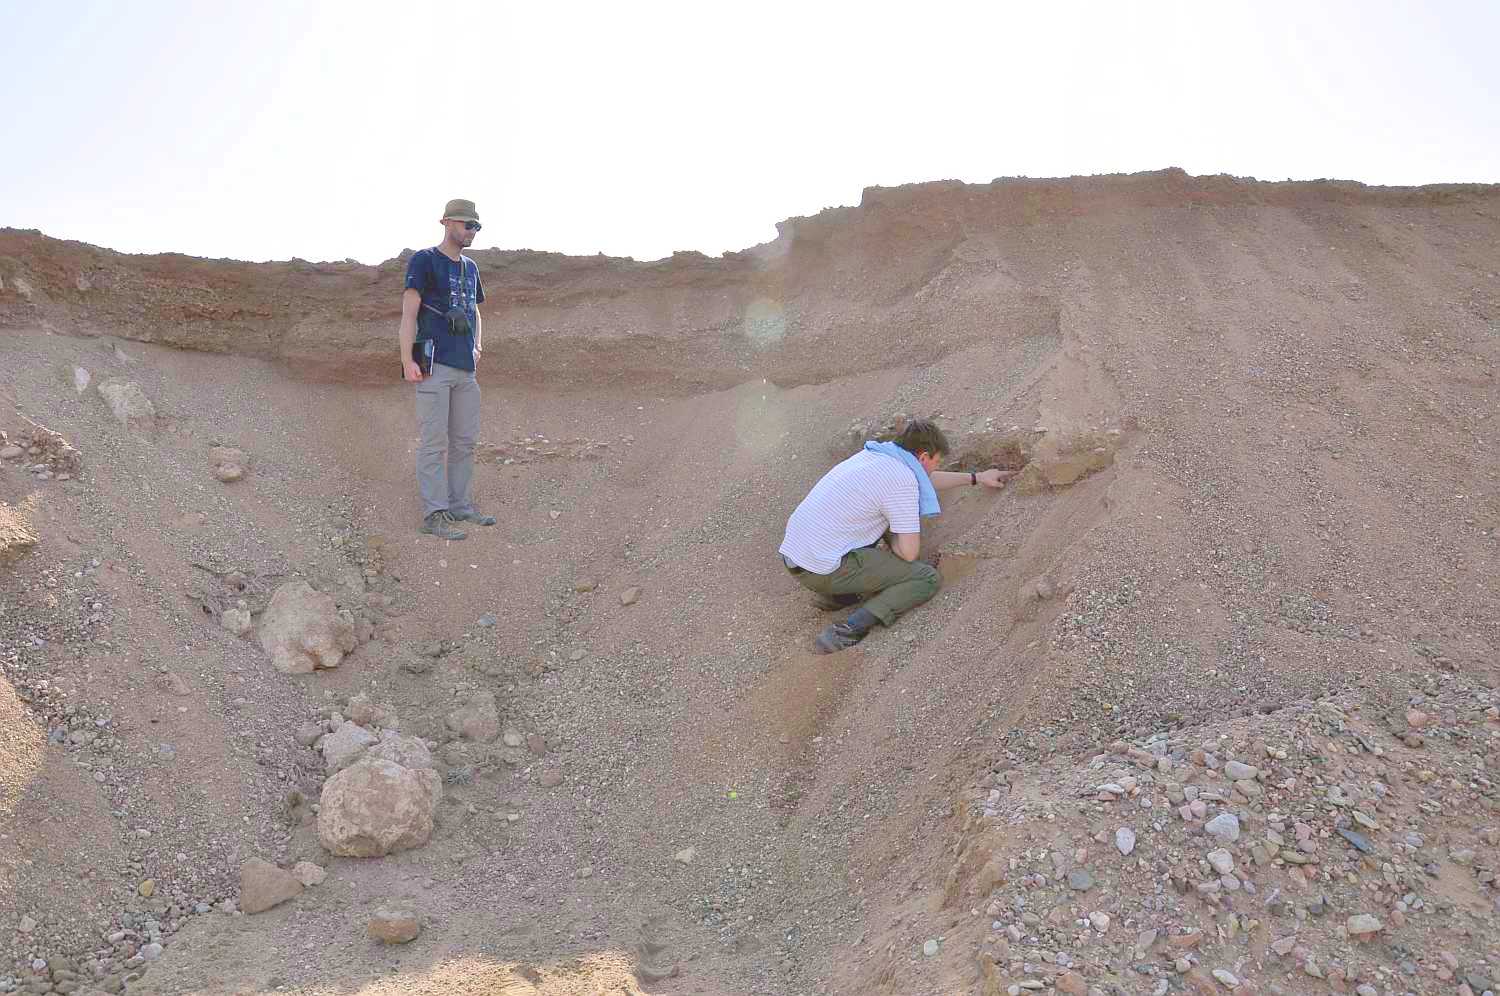
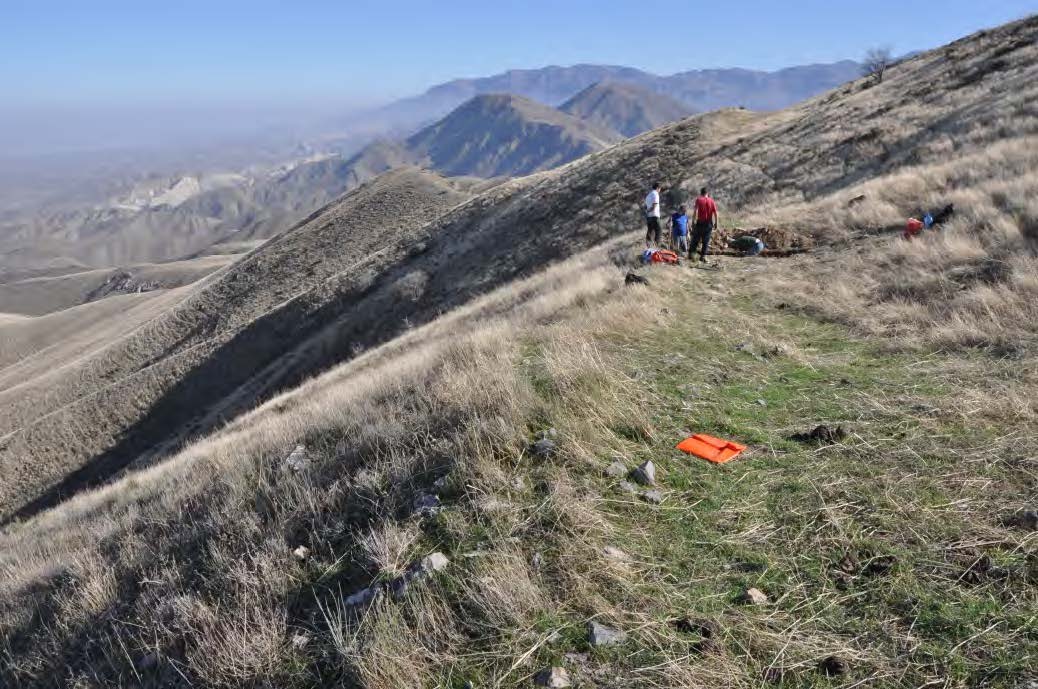
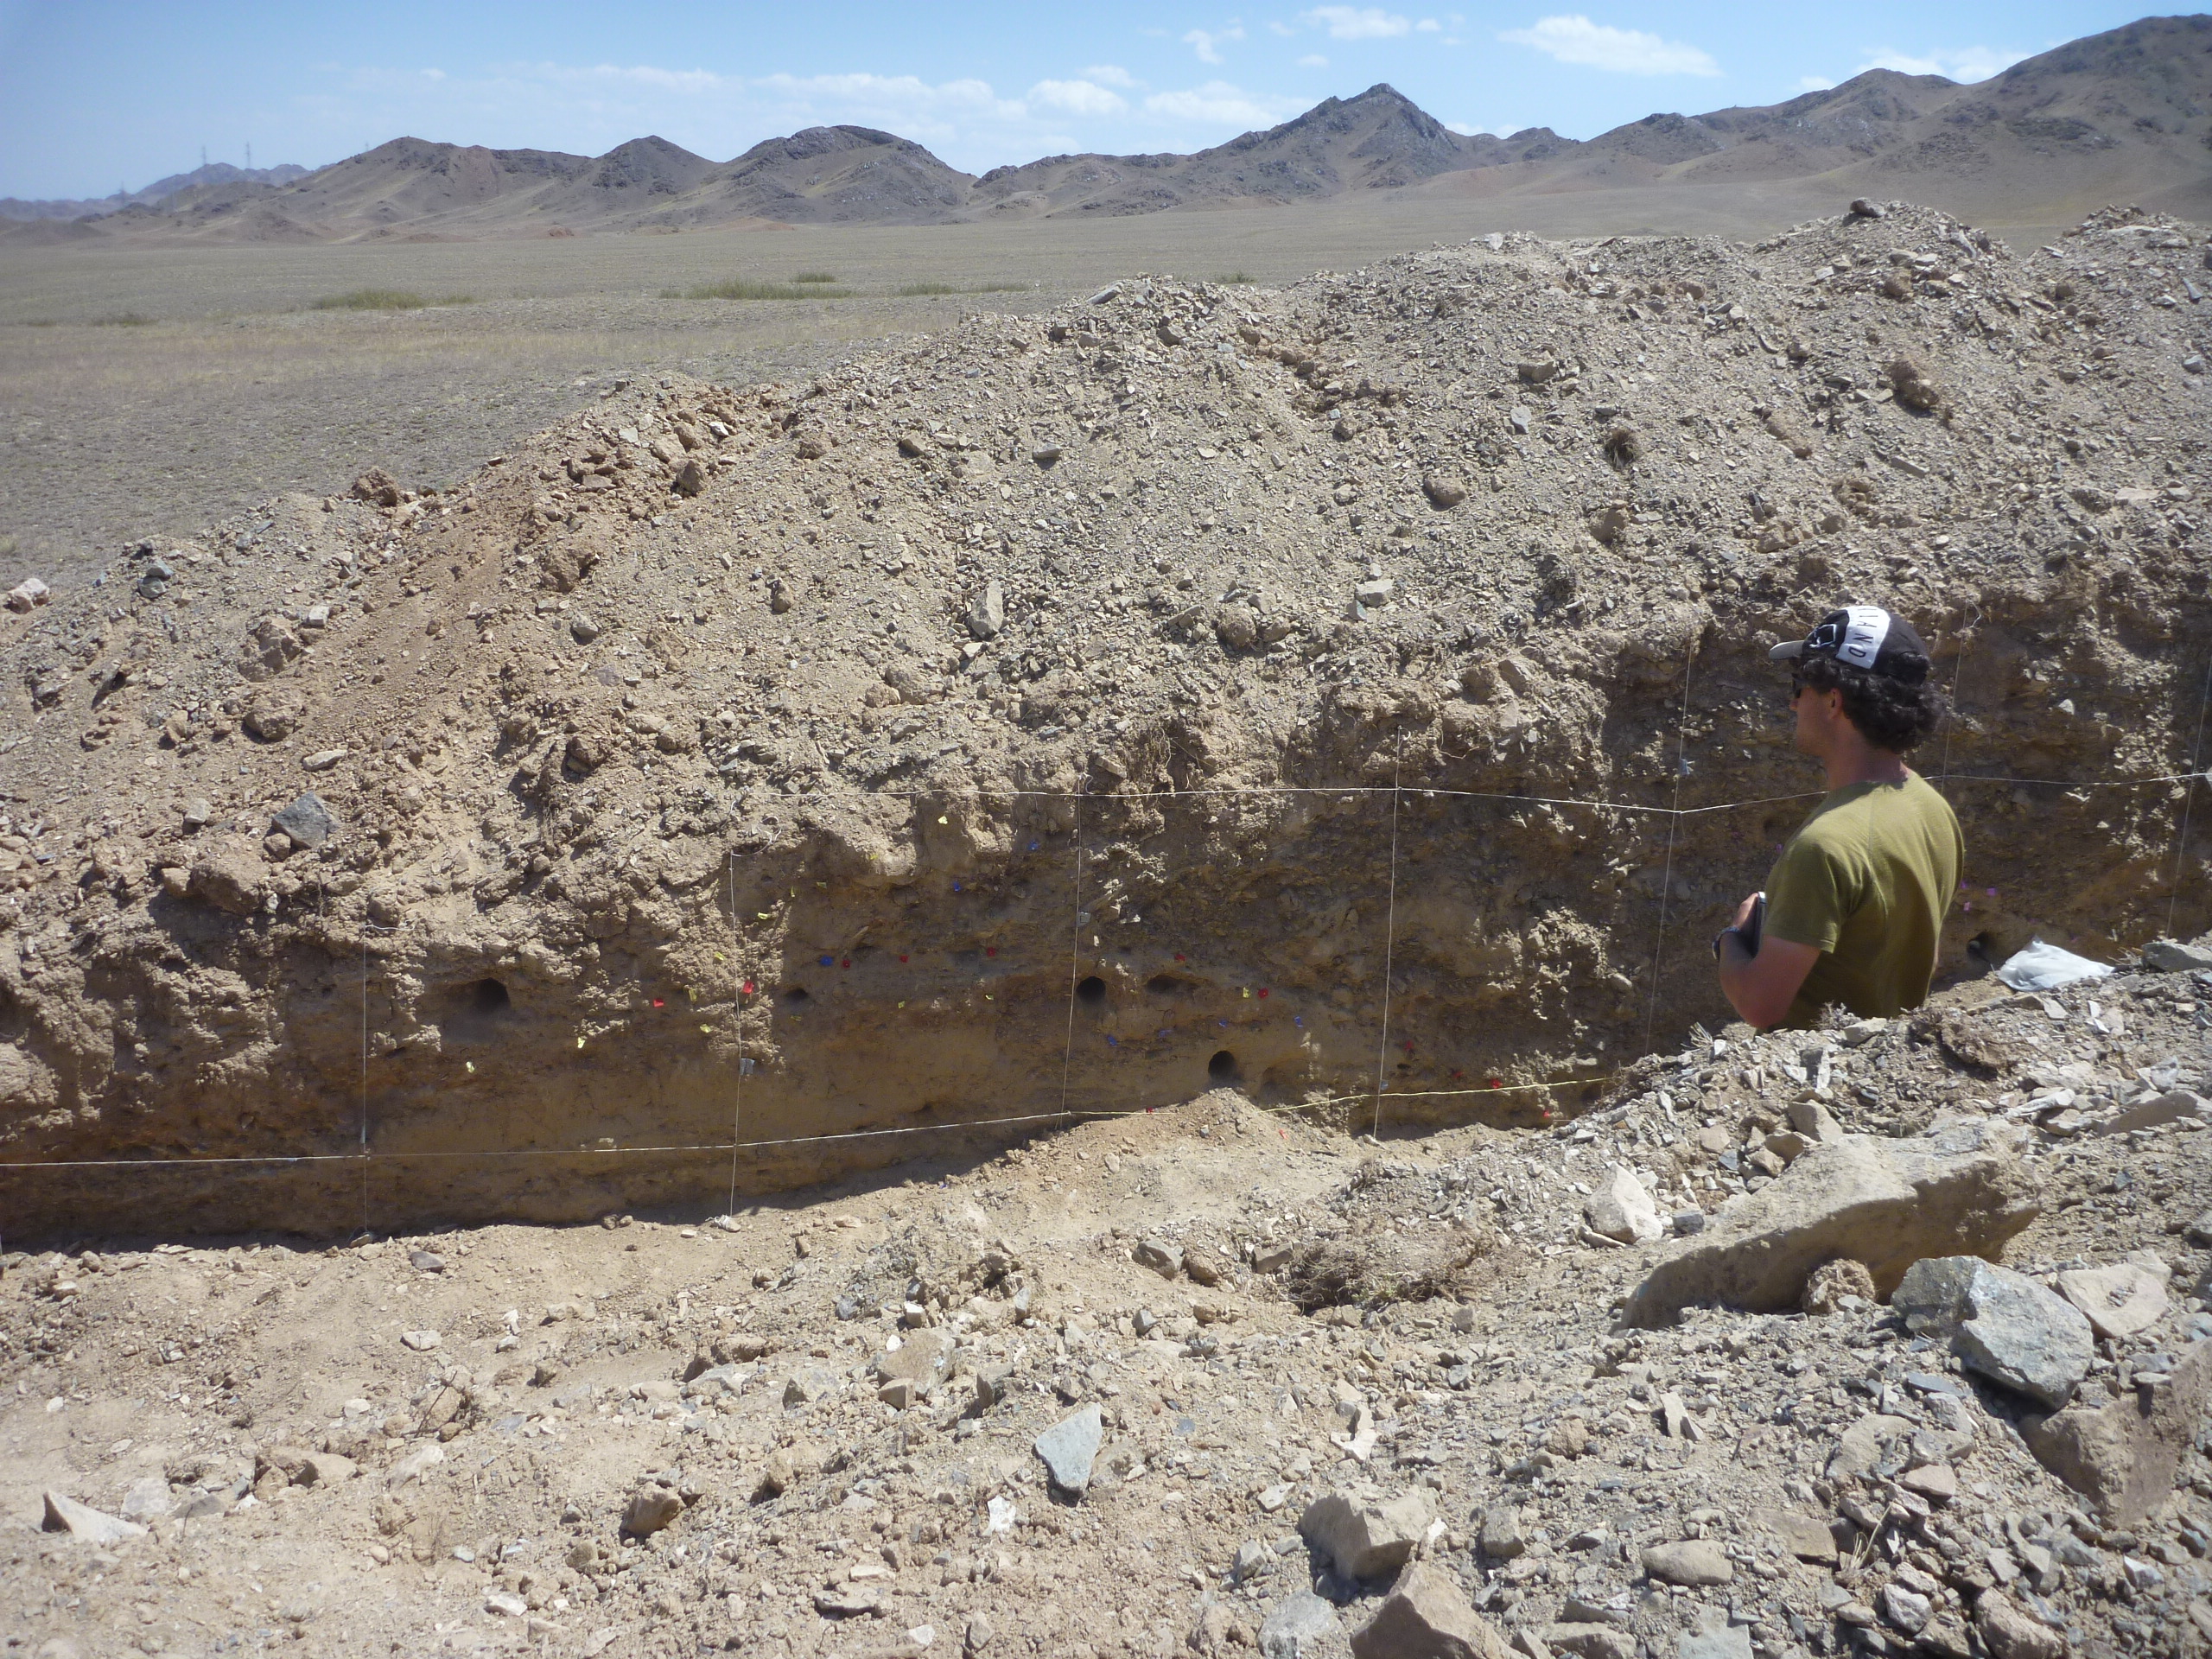
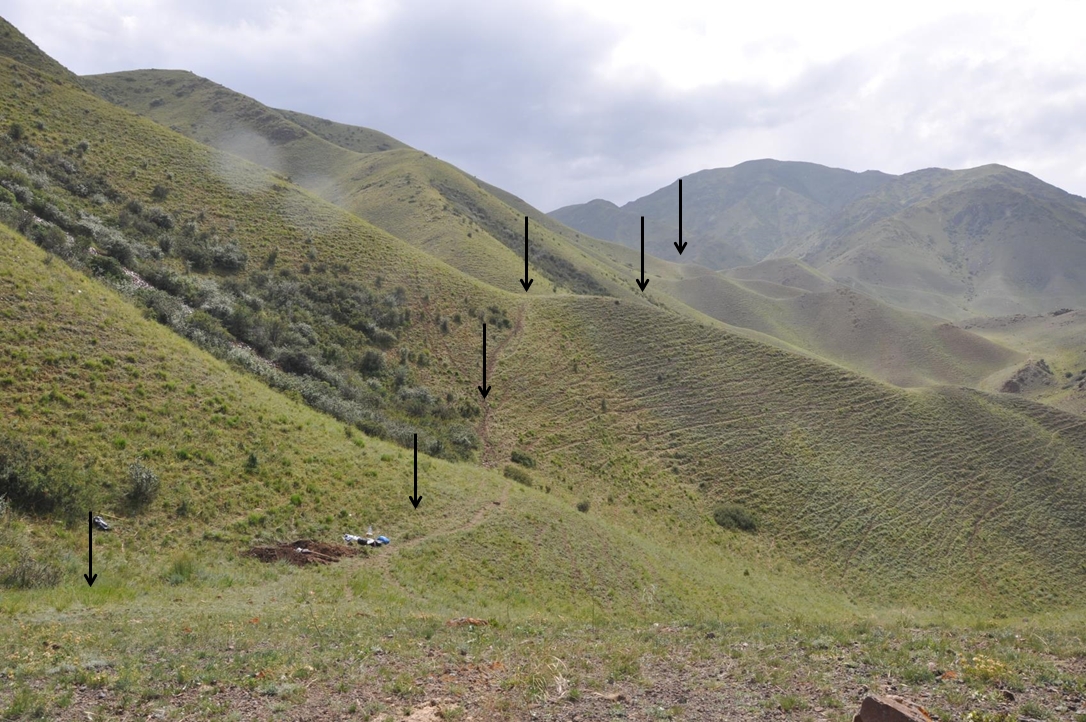
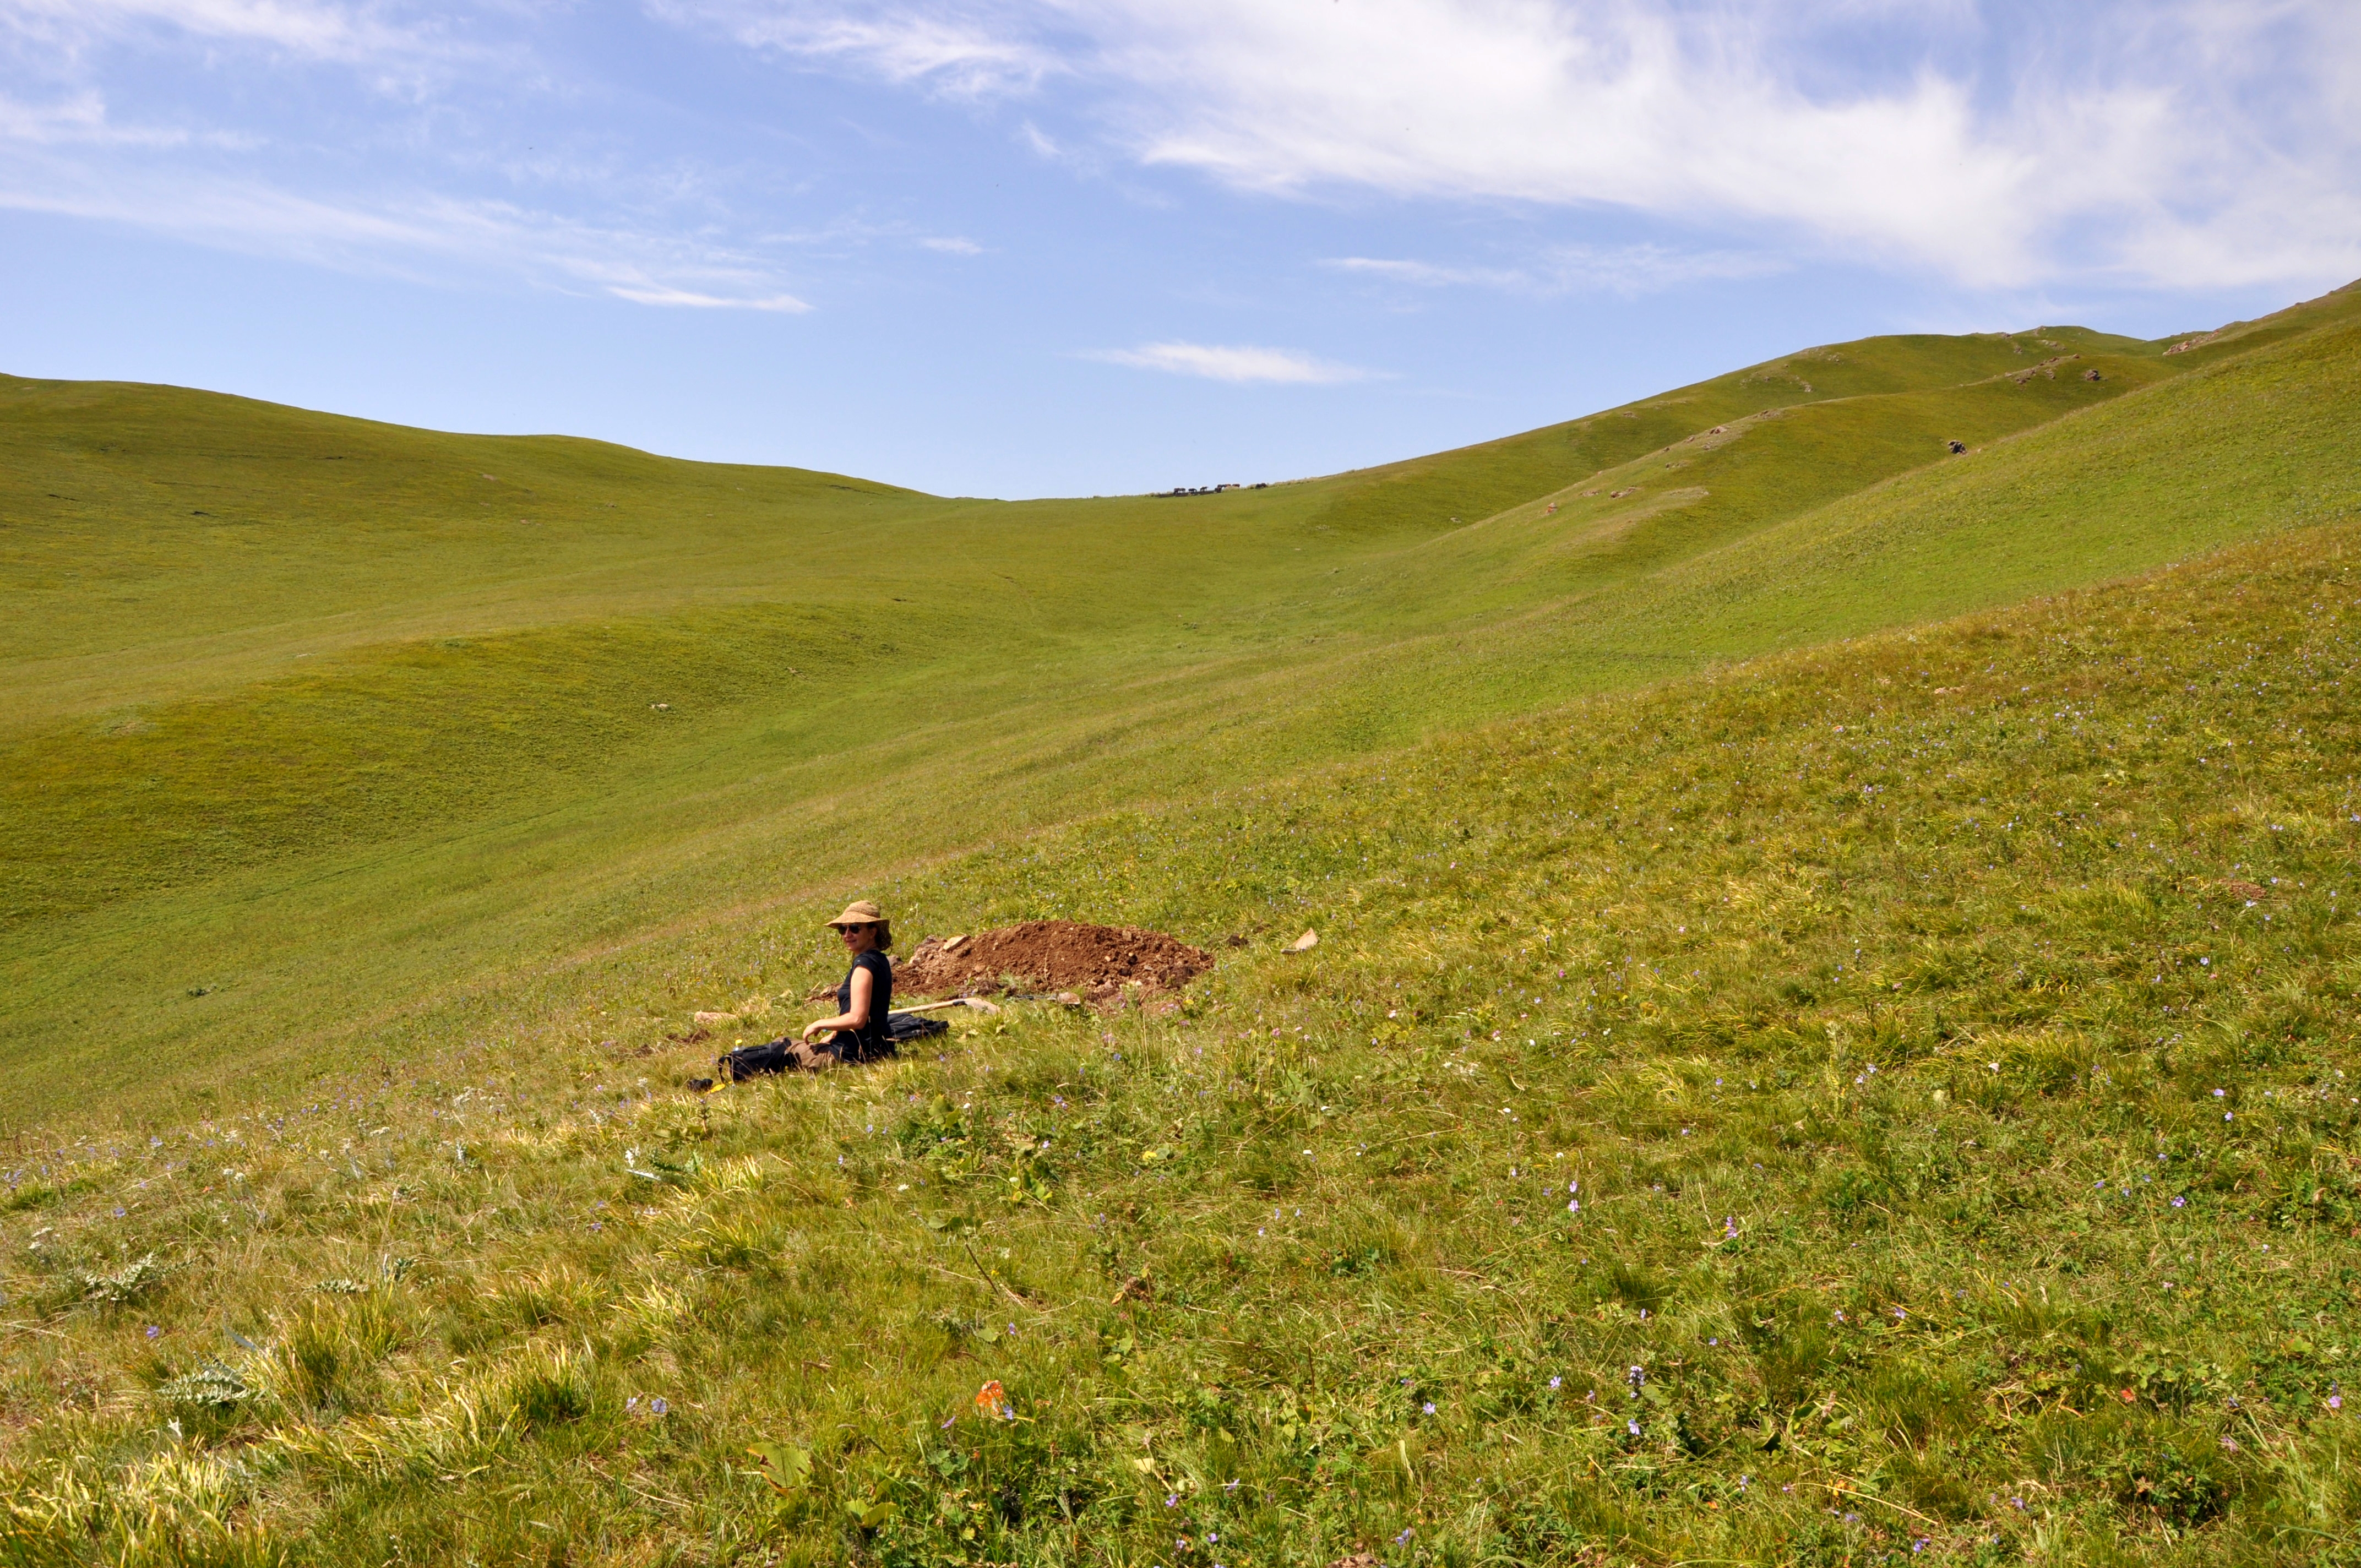
We focussed on a site where the landscape has recorded a major pre-historic earthquake. The fault trace is marked by a change in slope (a so-called ‘scarp’) that was created when the earthquake offset the surface. We found fault offsets of approximately 5 metres horizontally and around 1-2 m vertically, which we interpret as the result of the last surface-rupturing earthquake. Sediment has ponded against the scarp where it is uphill-facing. This sediment would post-date the last earthquake and thus allow us to determine the timing of the last event. We excavated two shallow trenches across the fault scarp to sample the sediment.
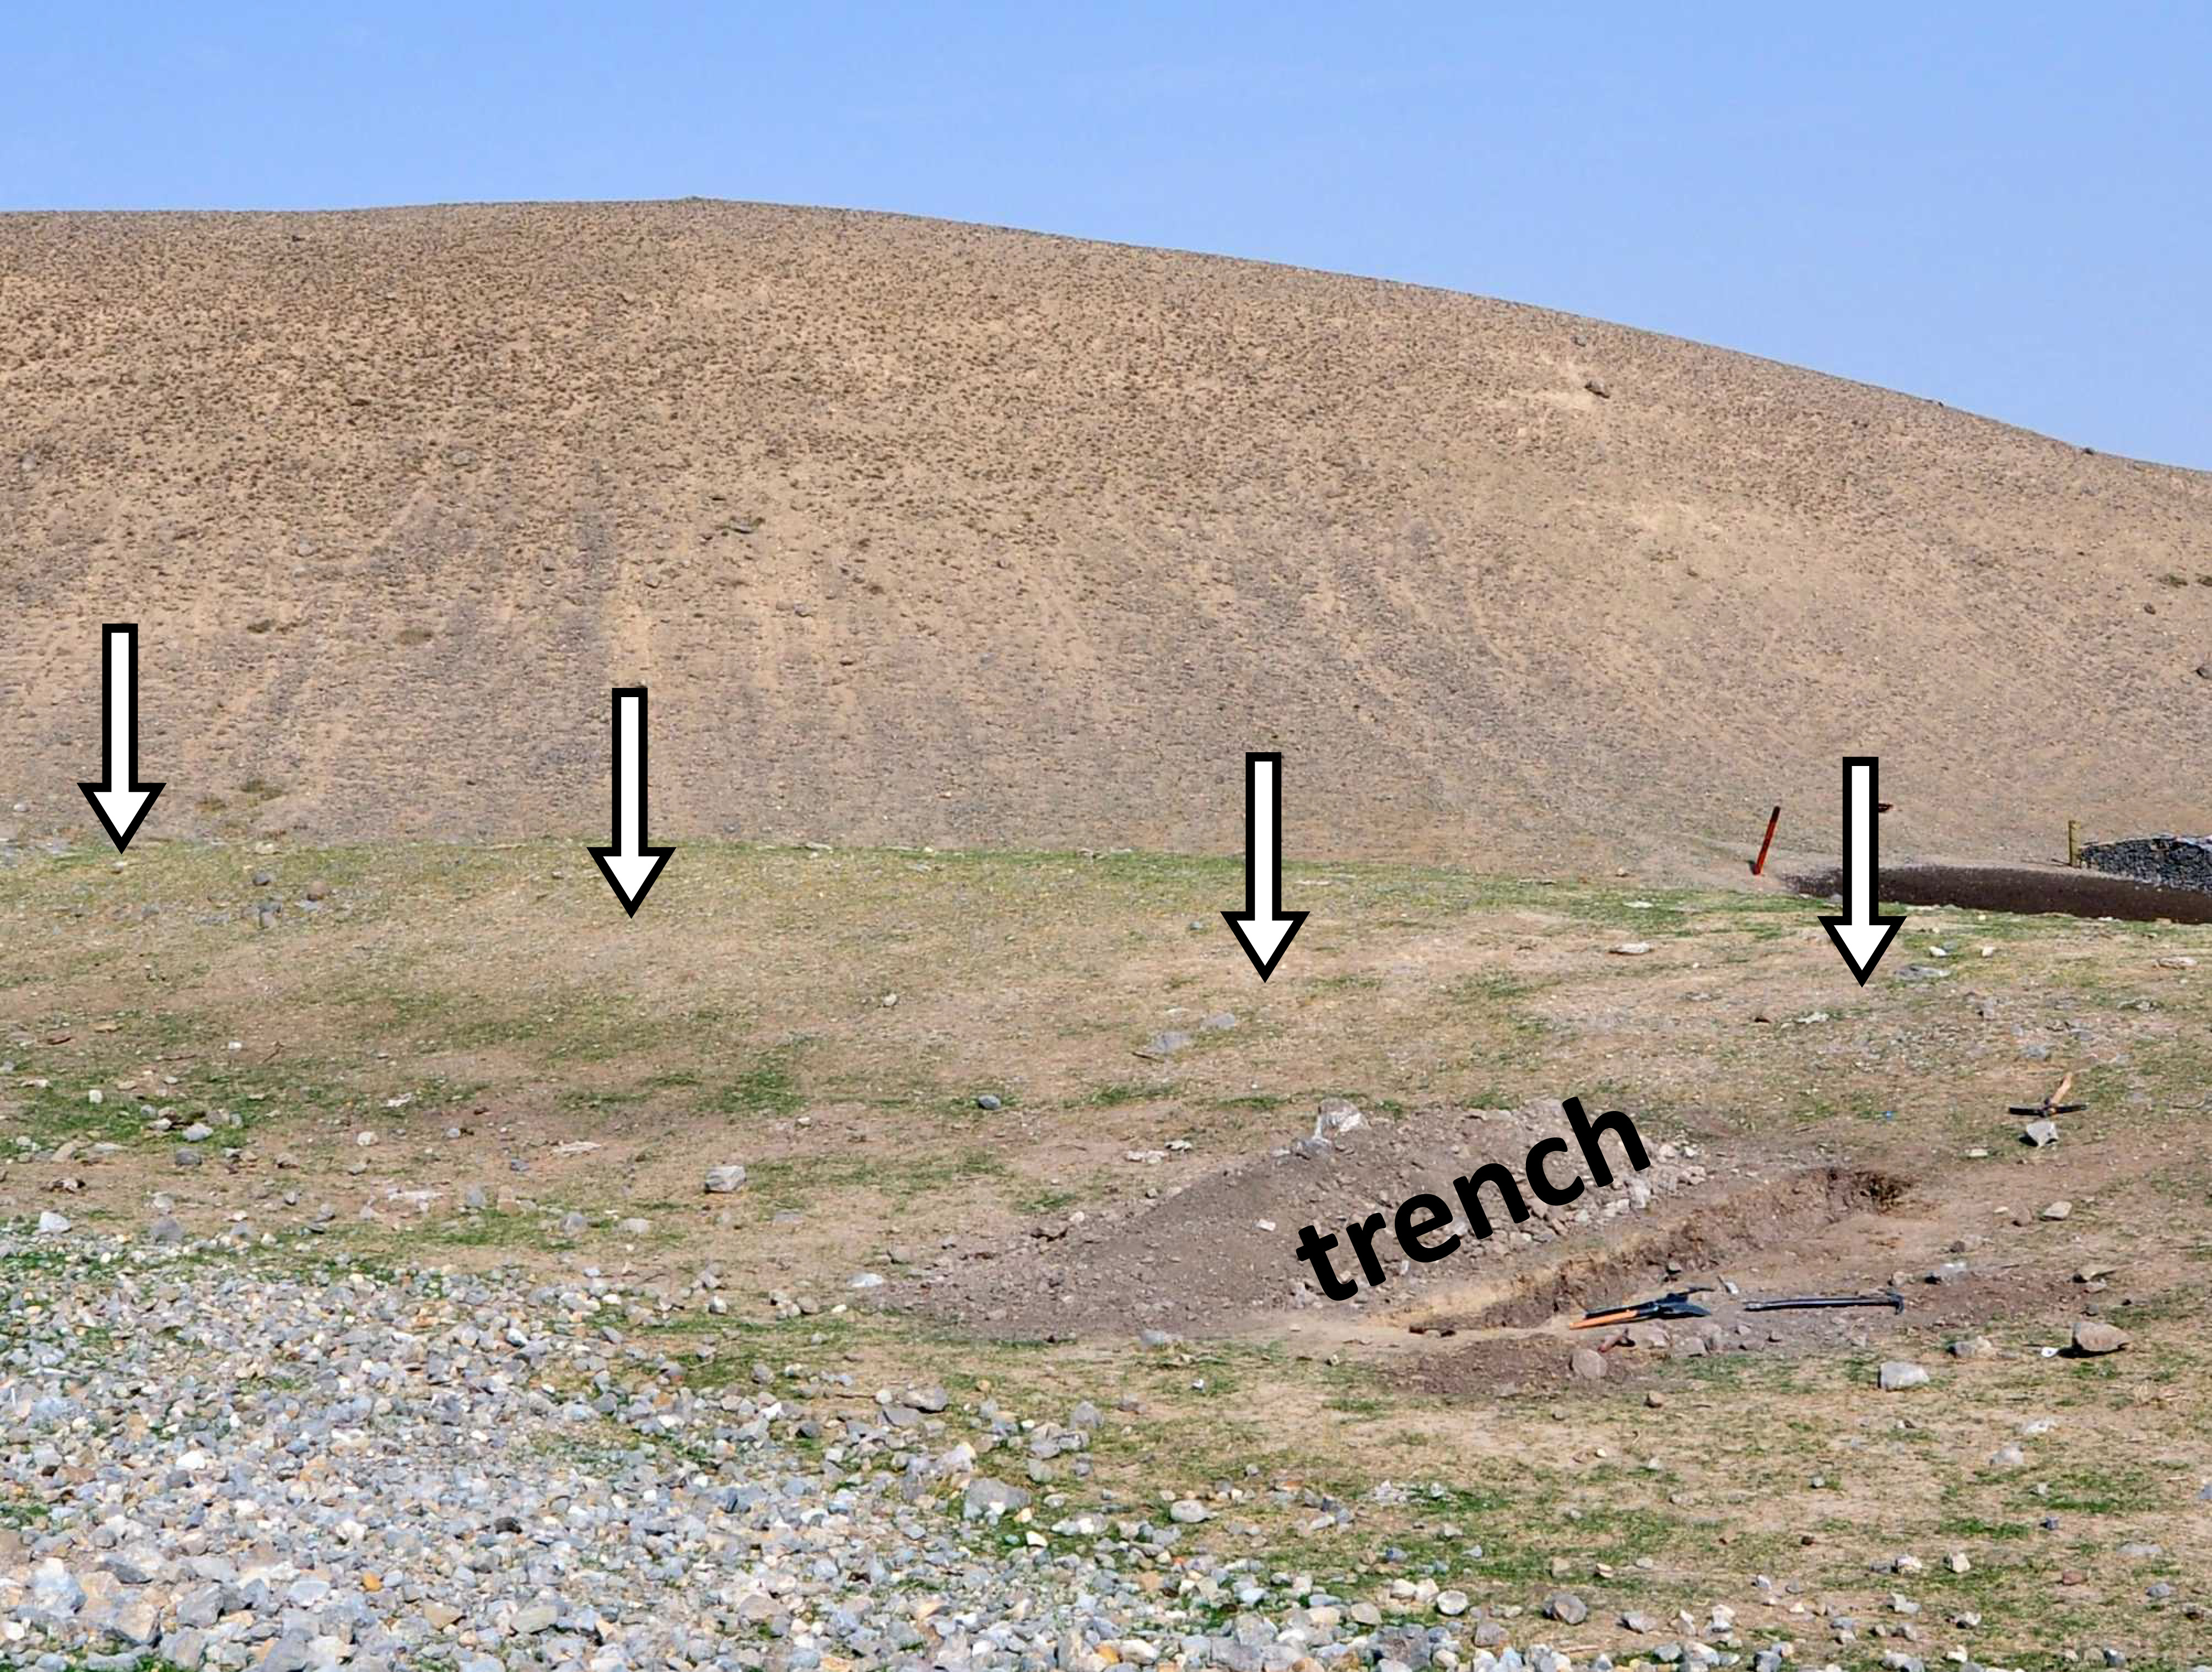
Trench 1 dug across the fault. The fault scarp is marked with arrows.
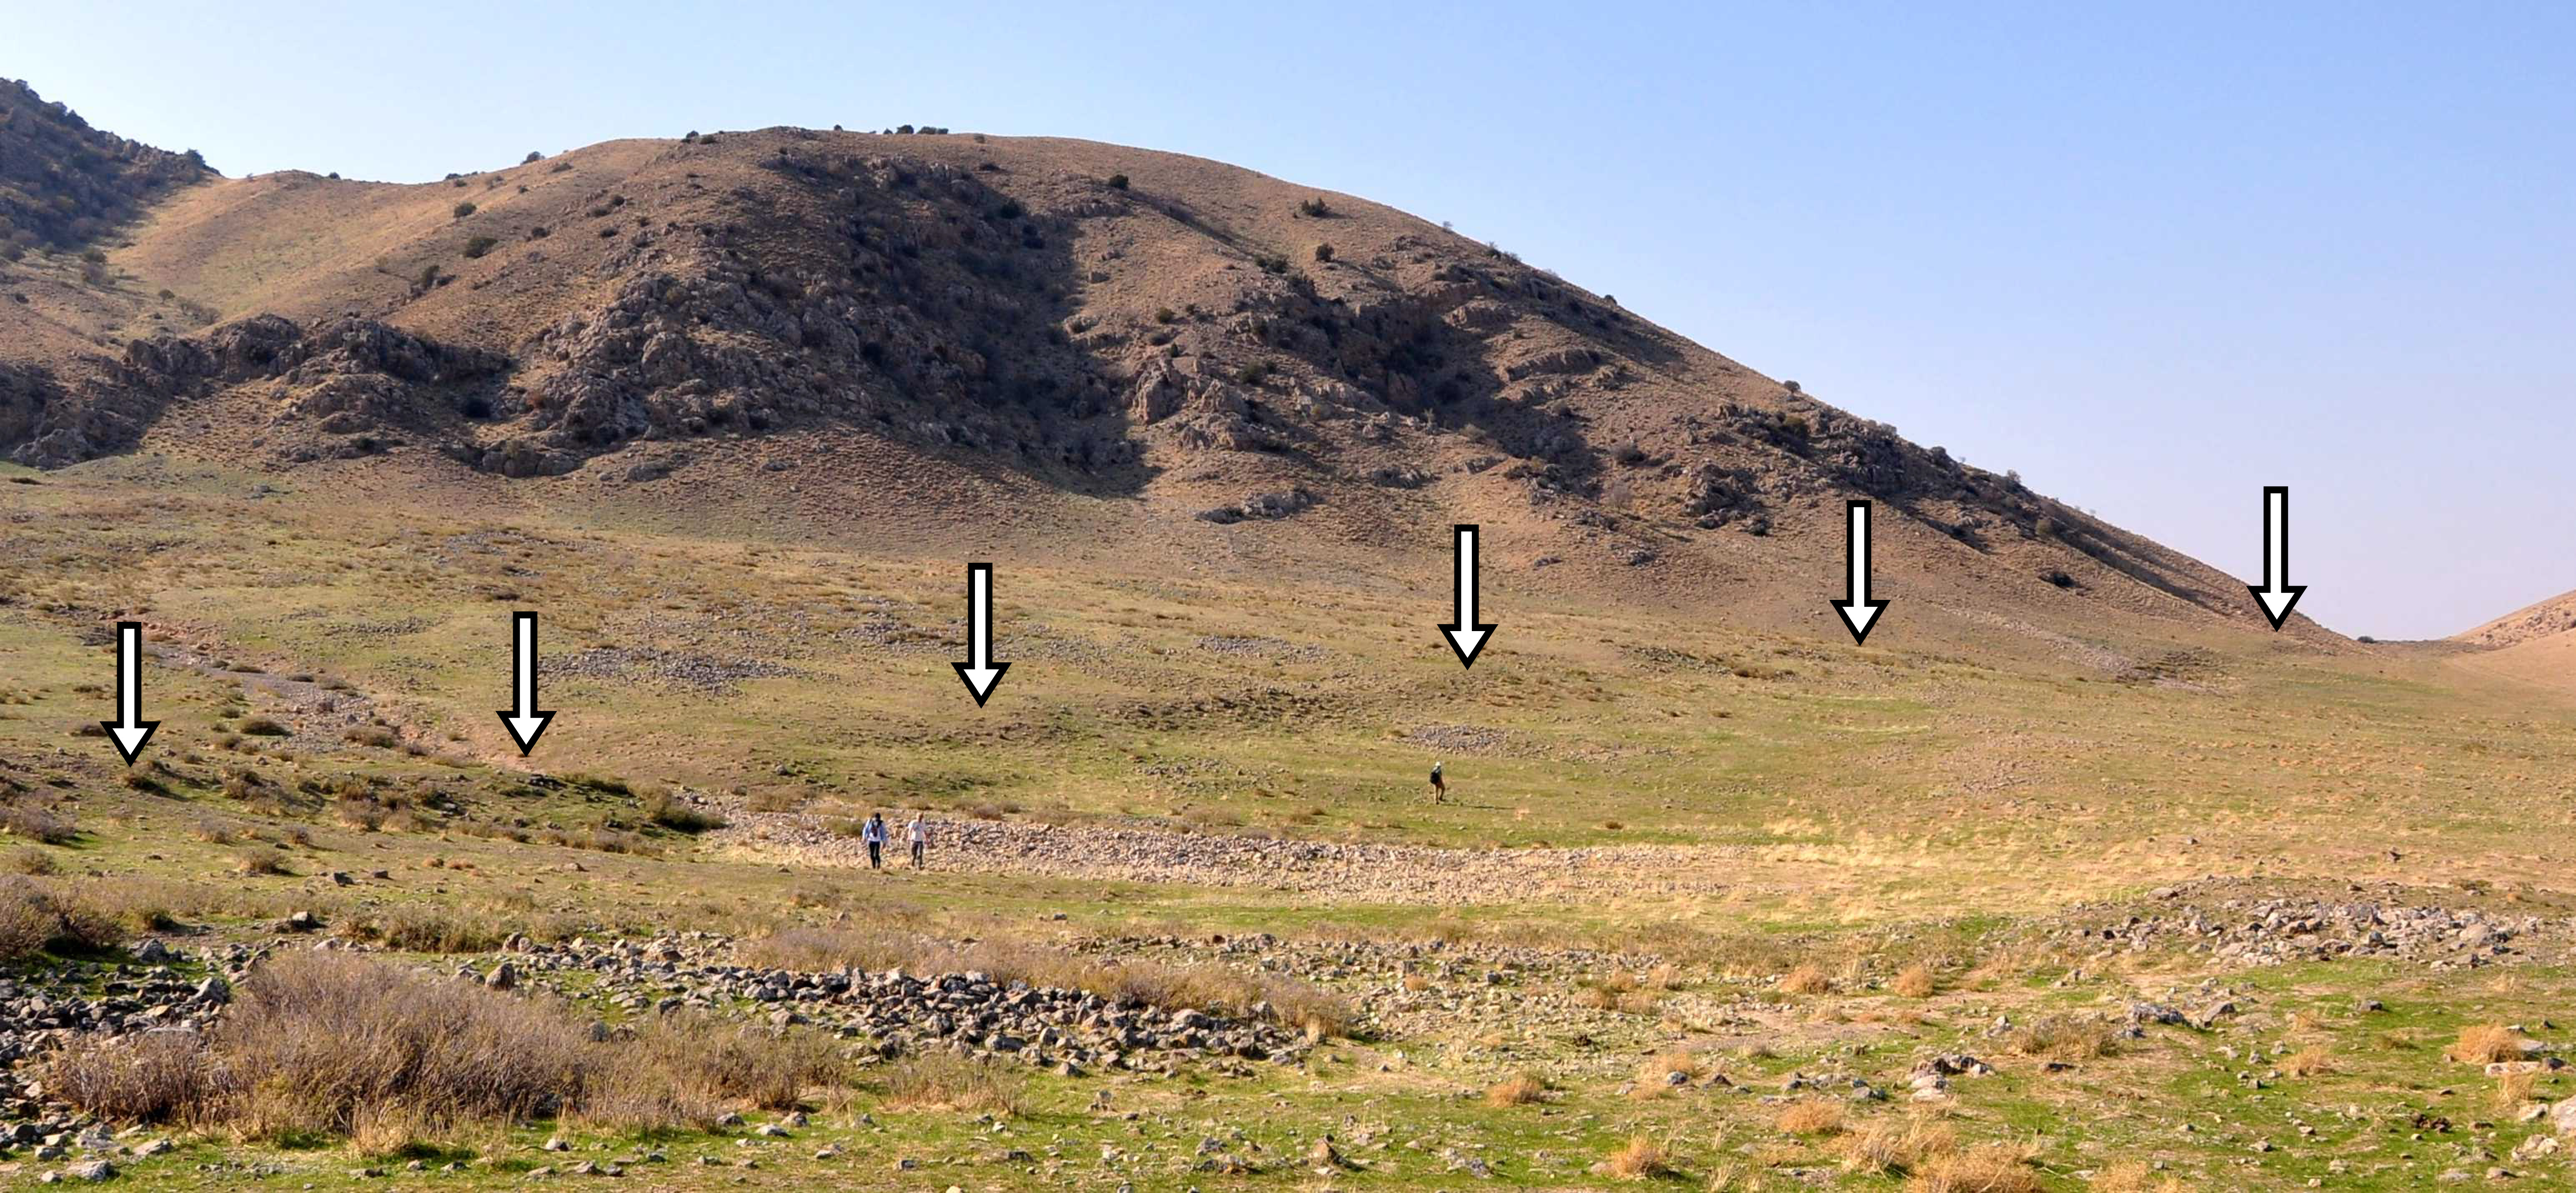
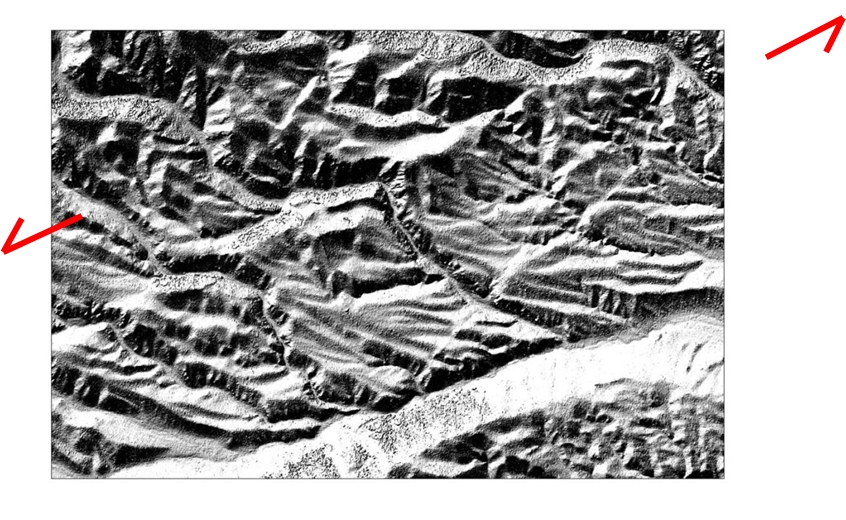
The fault scarp can be traced for several kilometres and is marked by the white arrows.
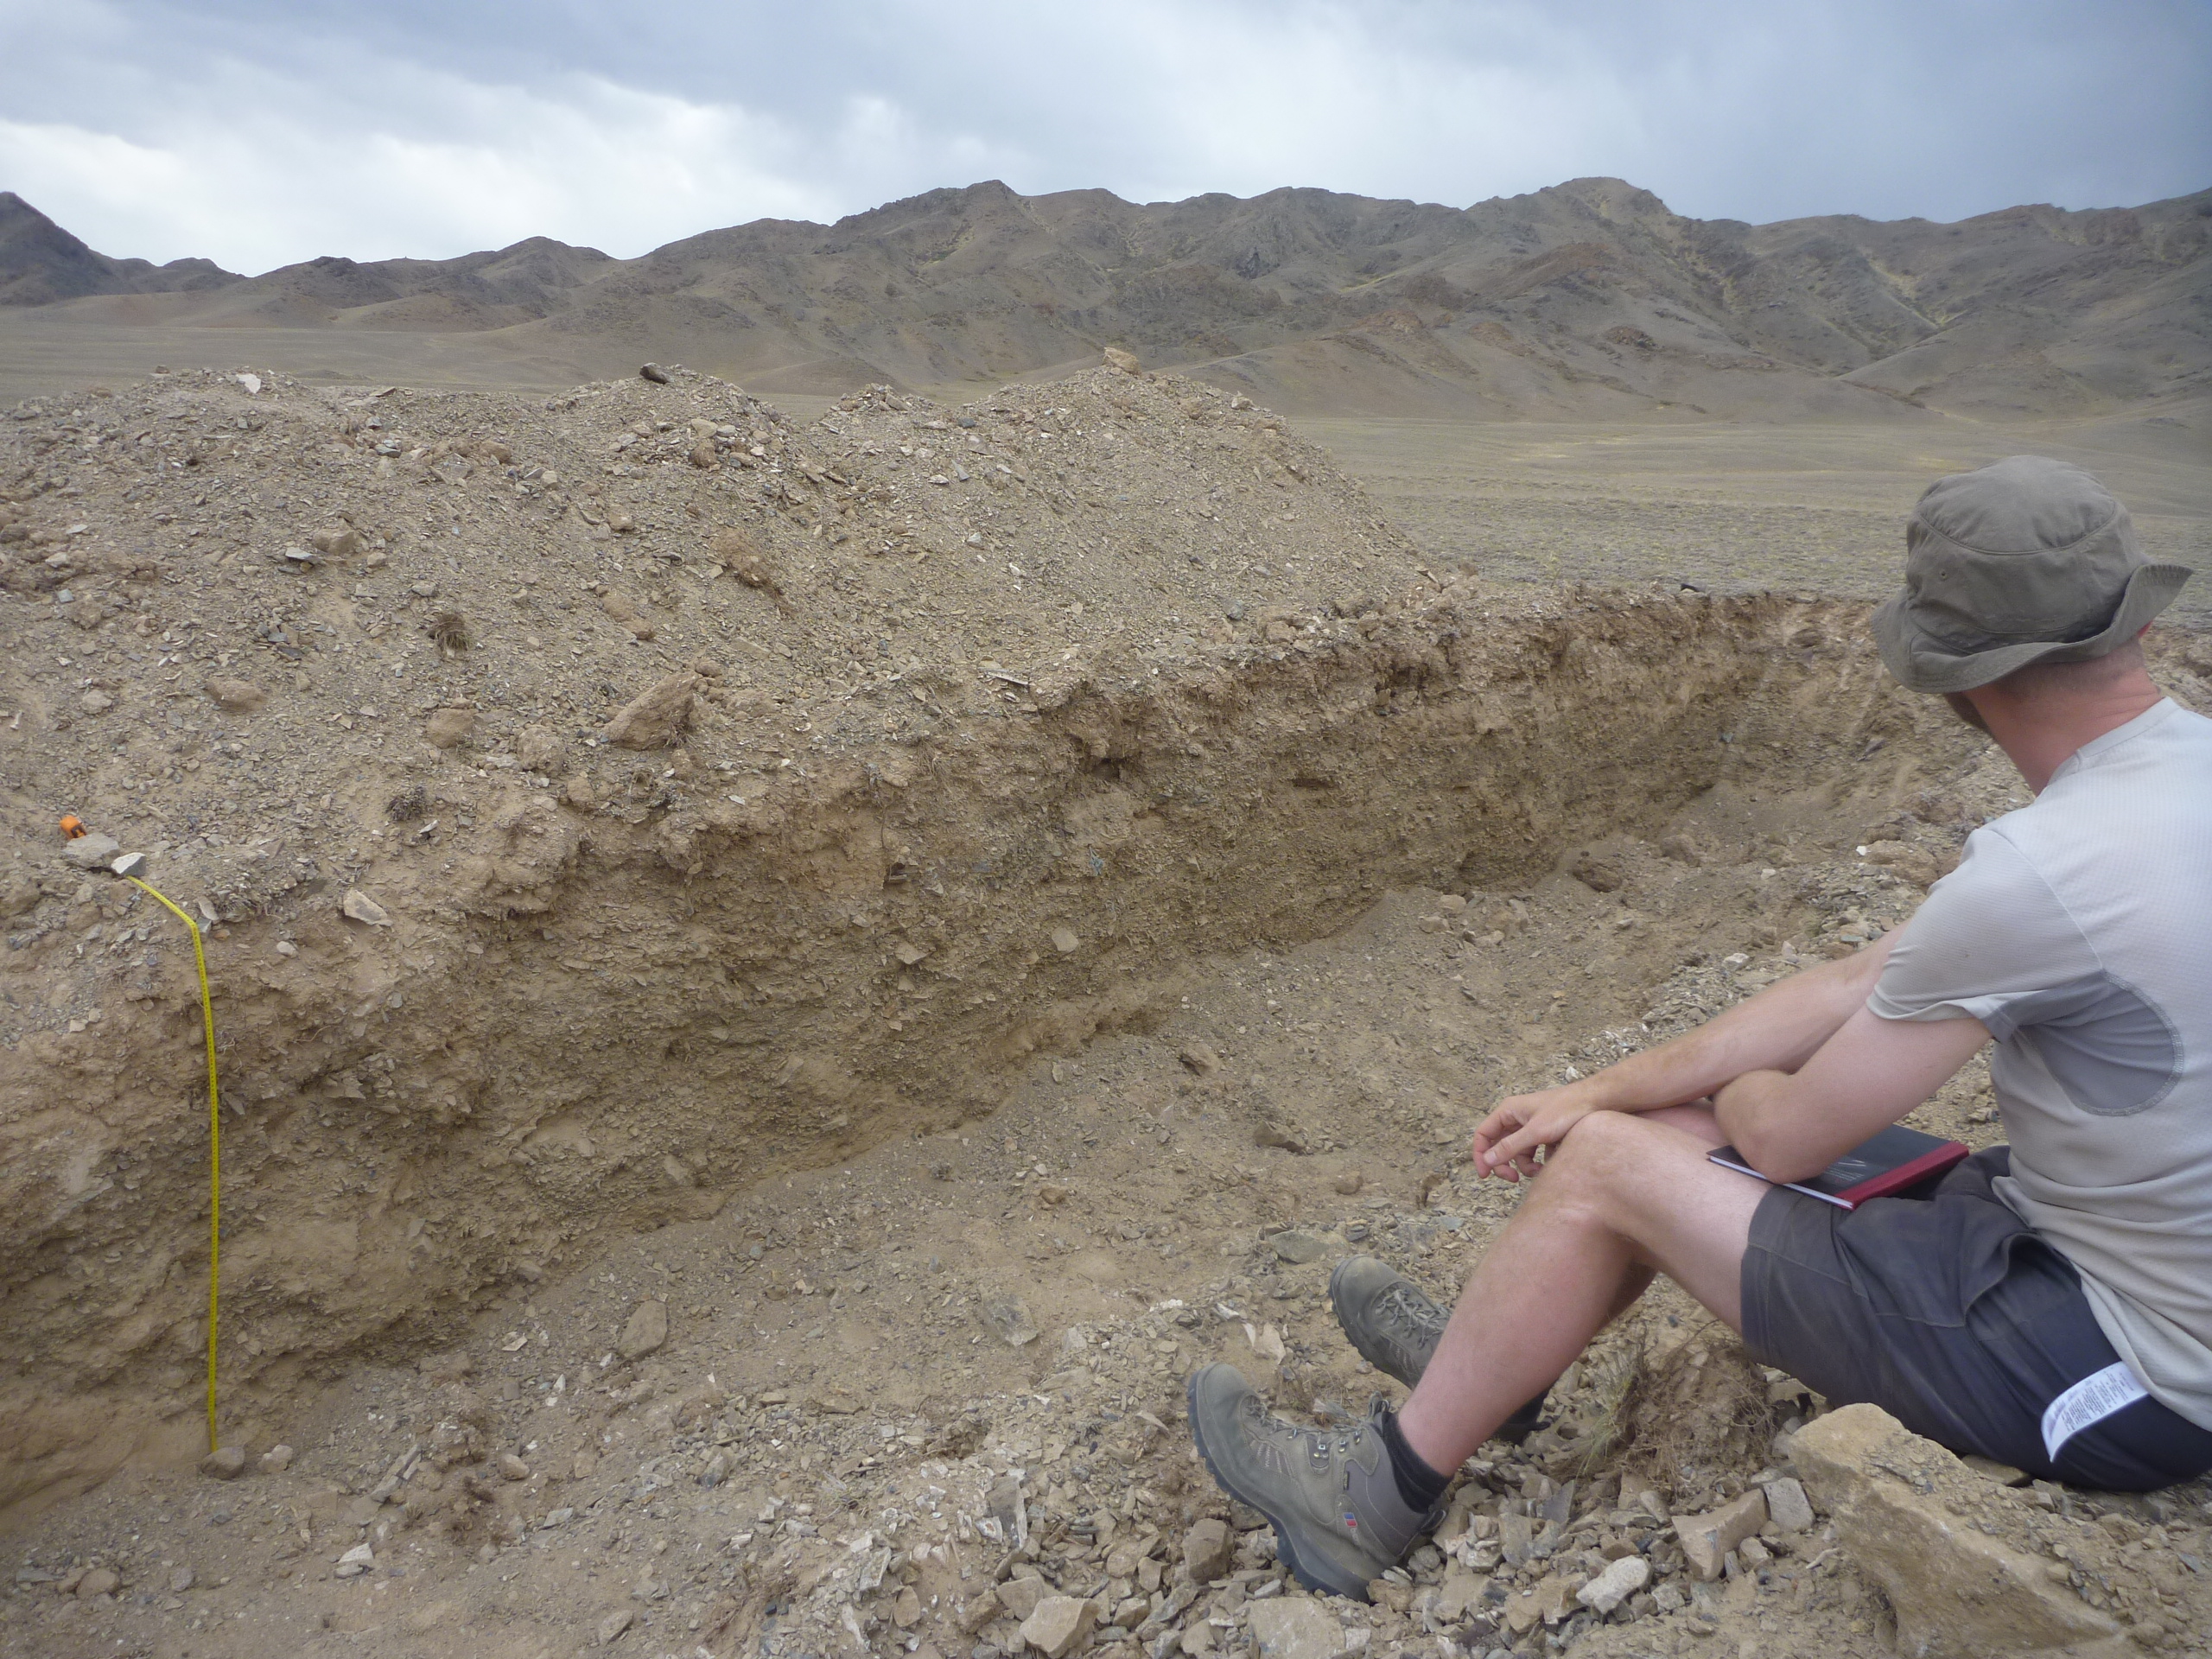
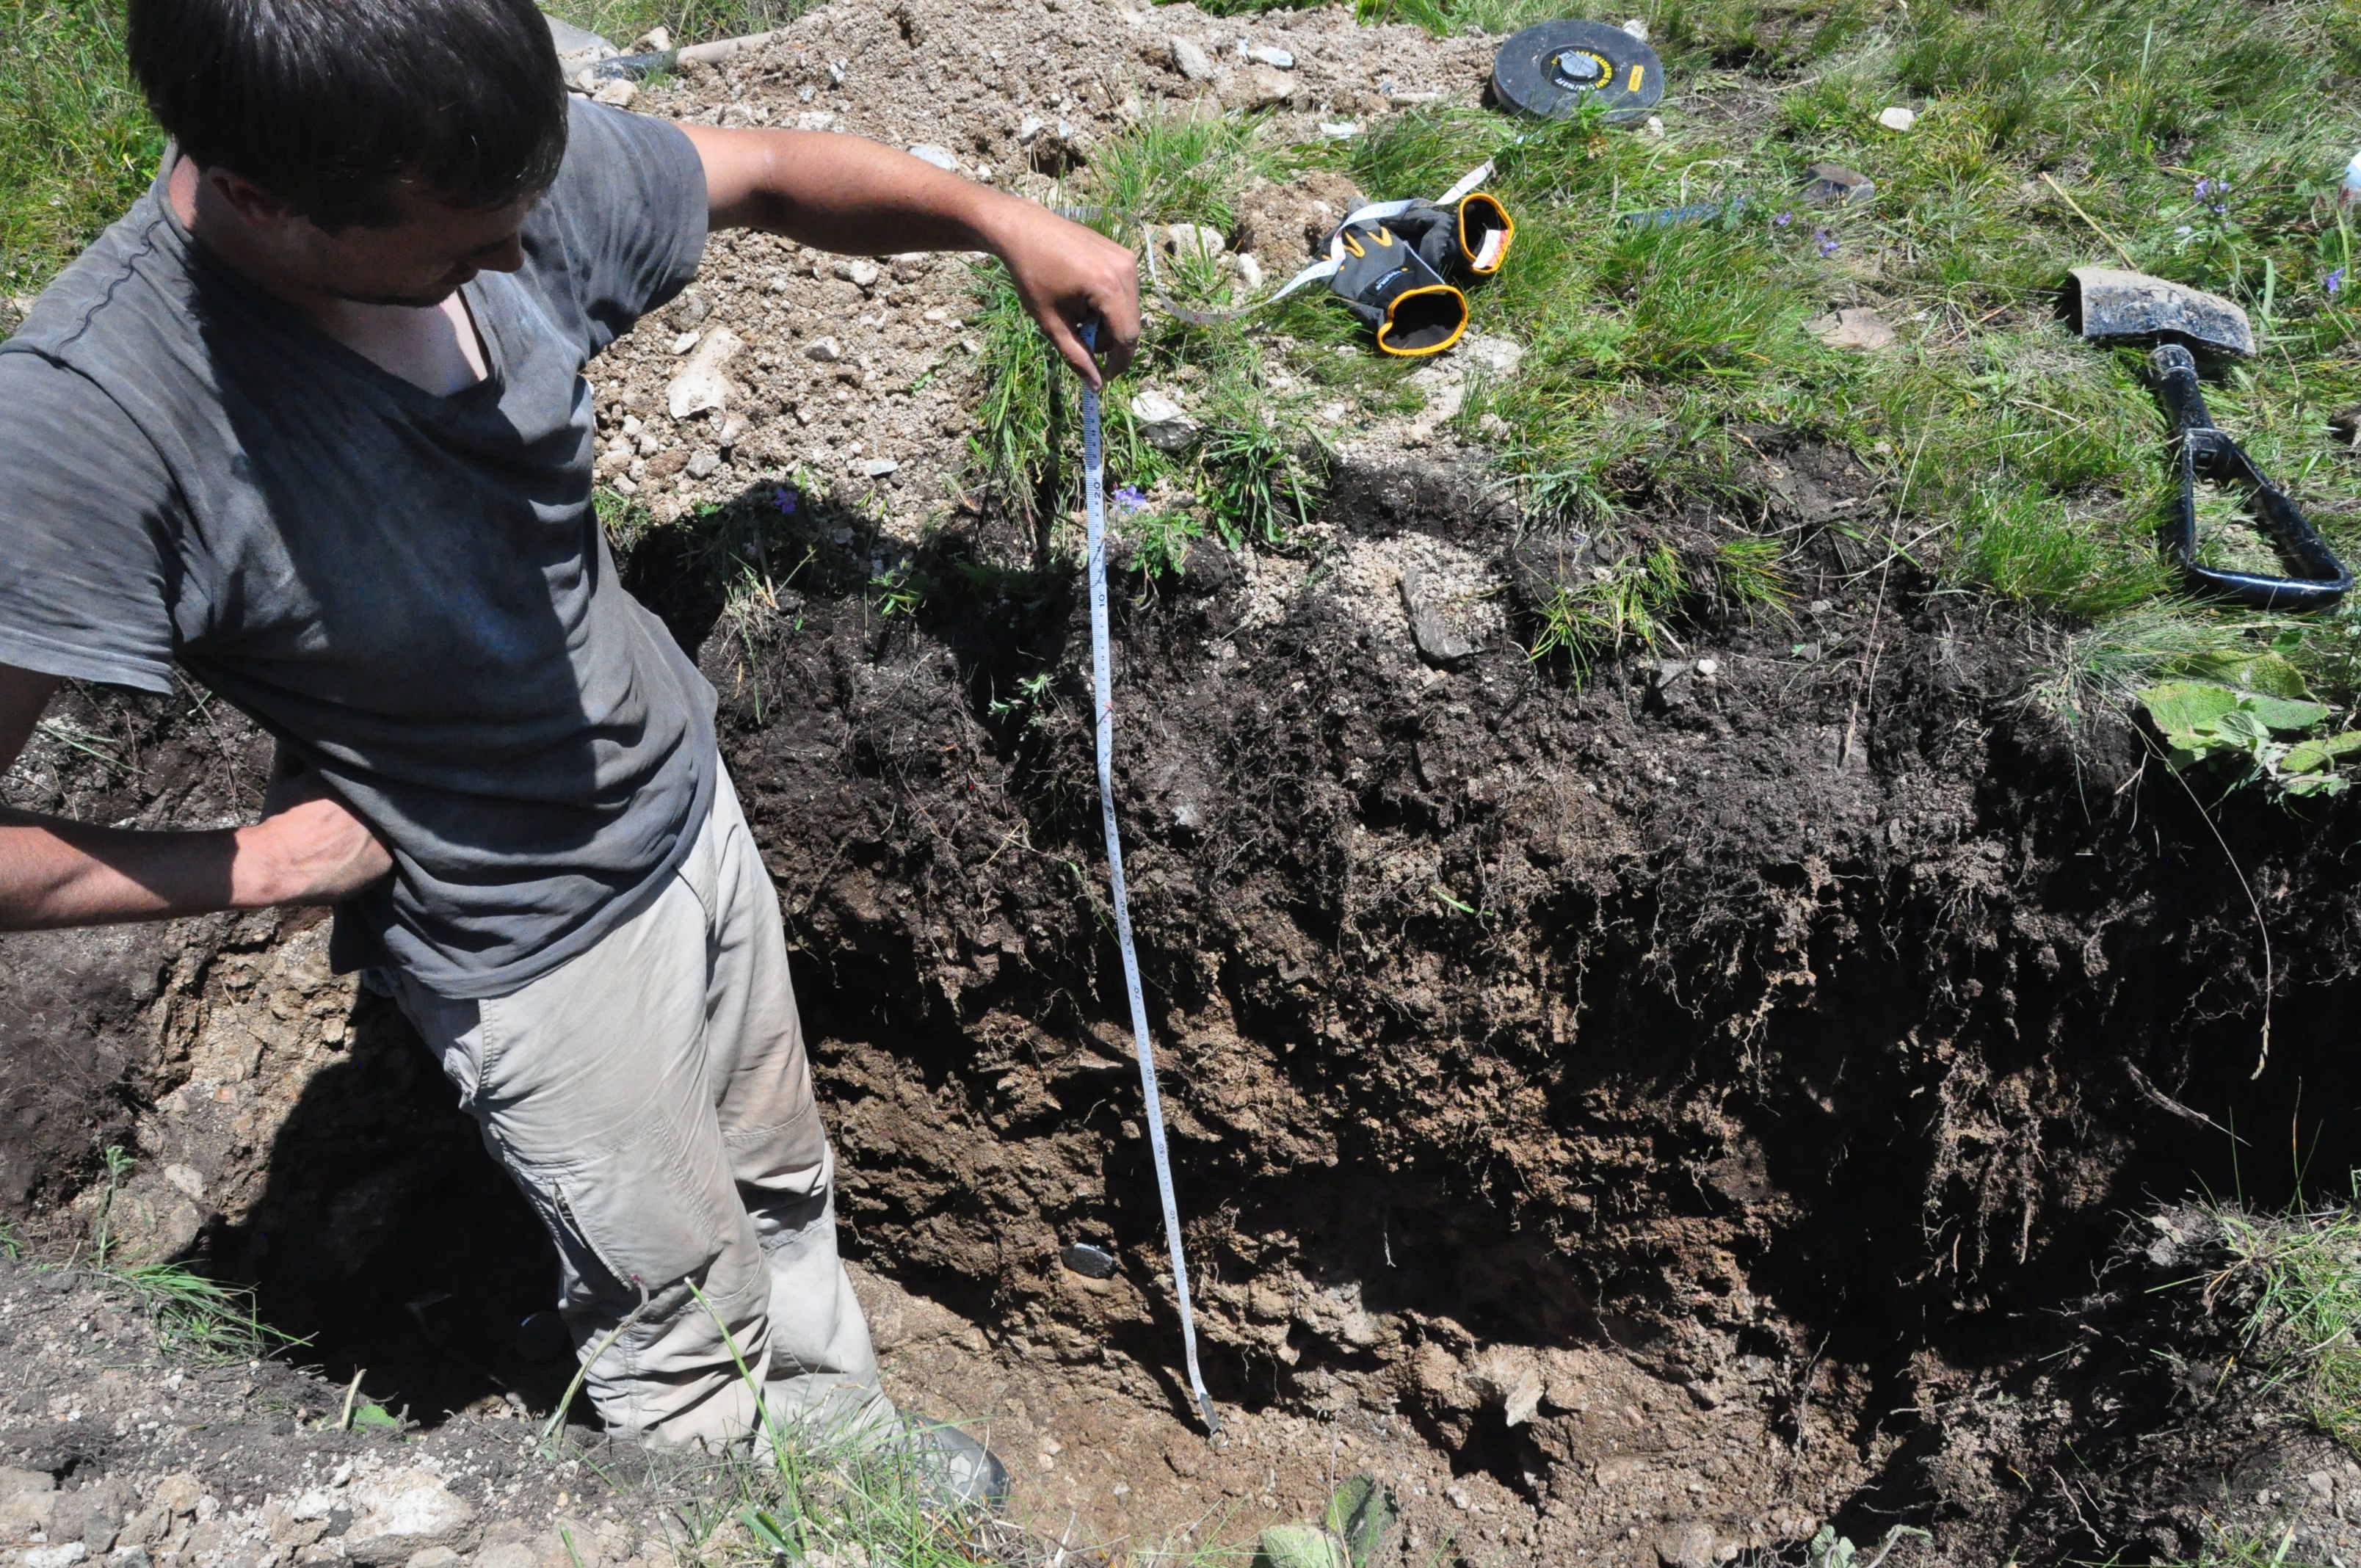
Trench 2 across the fault.
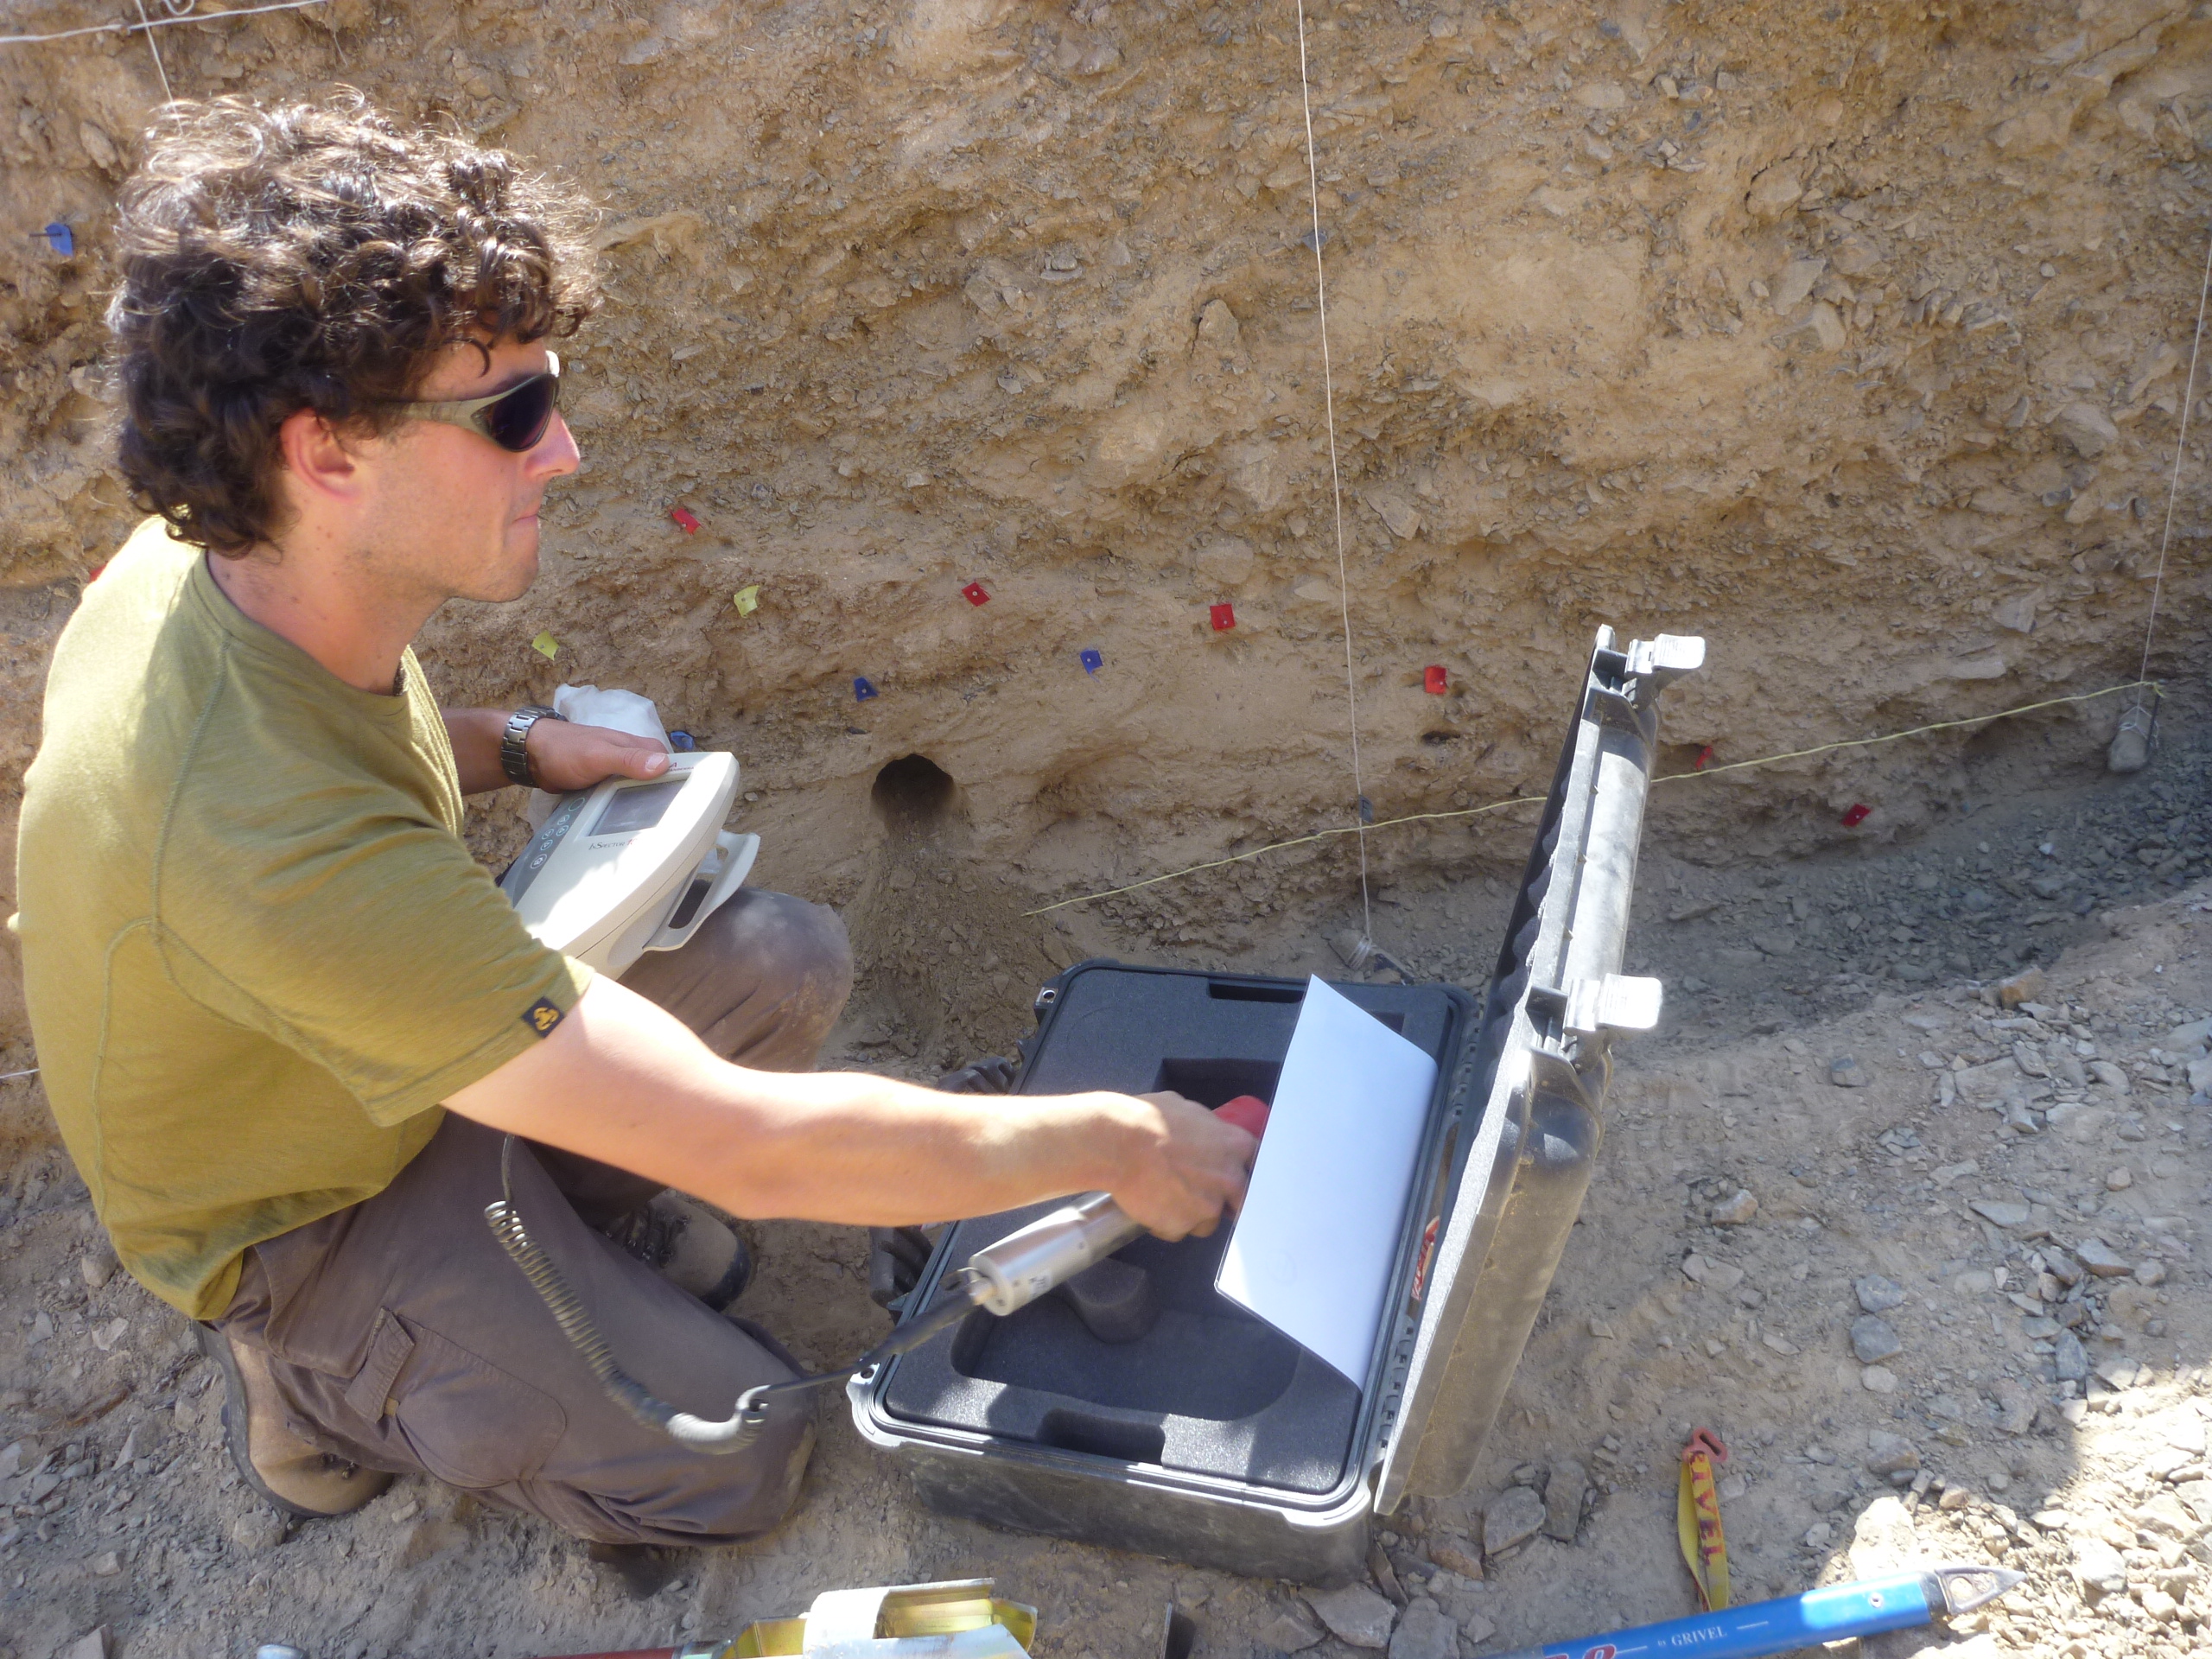
We encountered fine grained-sediment with pieces of charcoal. In addition, we collected one OSL sample for optically stimulated luminescence (OSL) dating of the sediments (Rhodes, 2015). This technique measures the burial age of the material. Due to the natural occurrence of very small amounts of radioactive elements in the silts and sands, defects in the lattices of quartz and feldspar grains accumulate as soon as the sediment is not exposed to sunlight anymore, i.e. after deposition. We sampled the material in light-proof steel tubes. In the lab the sample tubes will be opened in a darkroom and will be subjected to defined doses of light or infra-red radiation. This treatment triggers the defects in the crystal lattices to be reset, which goes along with the emission of light (luminescence). The intensity of the luminescence signal is proportional to the amount of time for which the sediment has not seen sunlight. Thereby we can determine the timing of deposition and, thus, get a post-date on the last major earthquake.
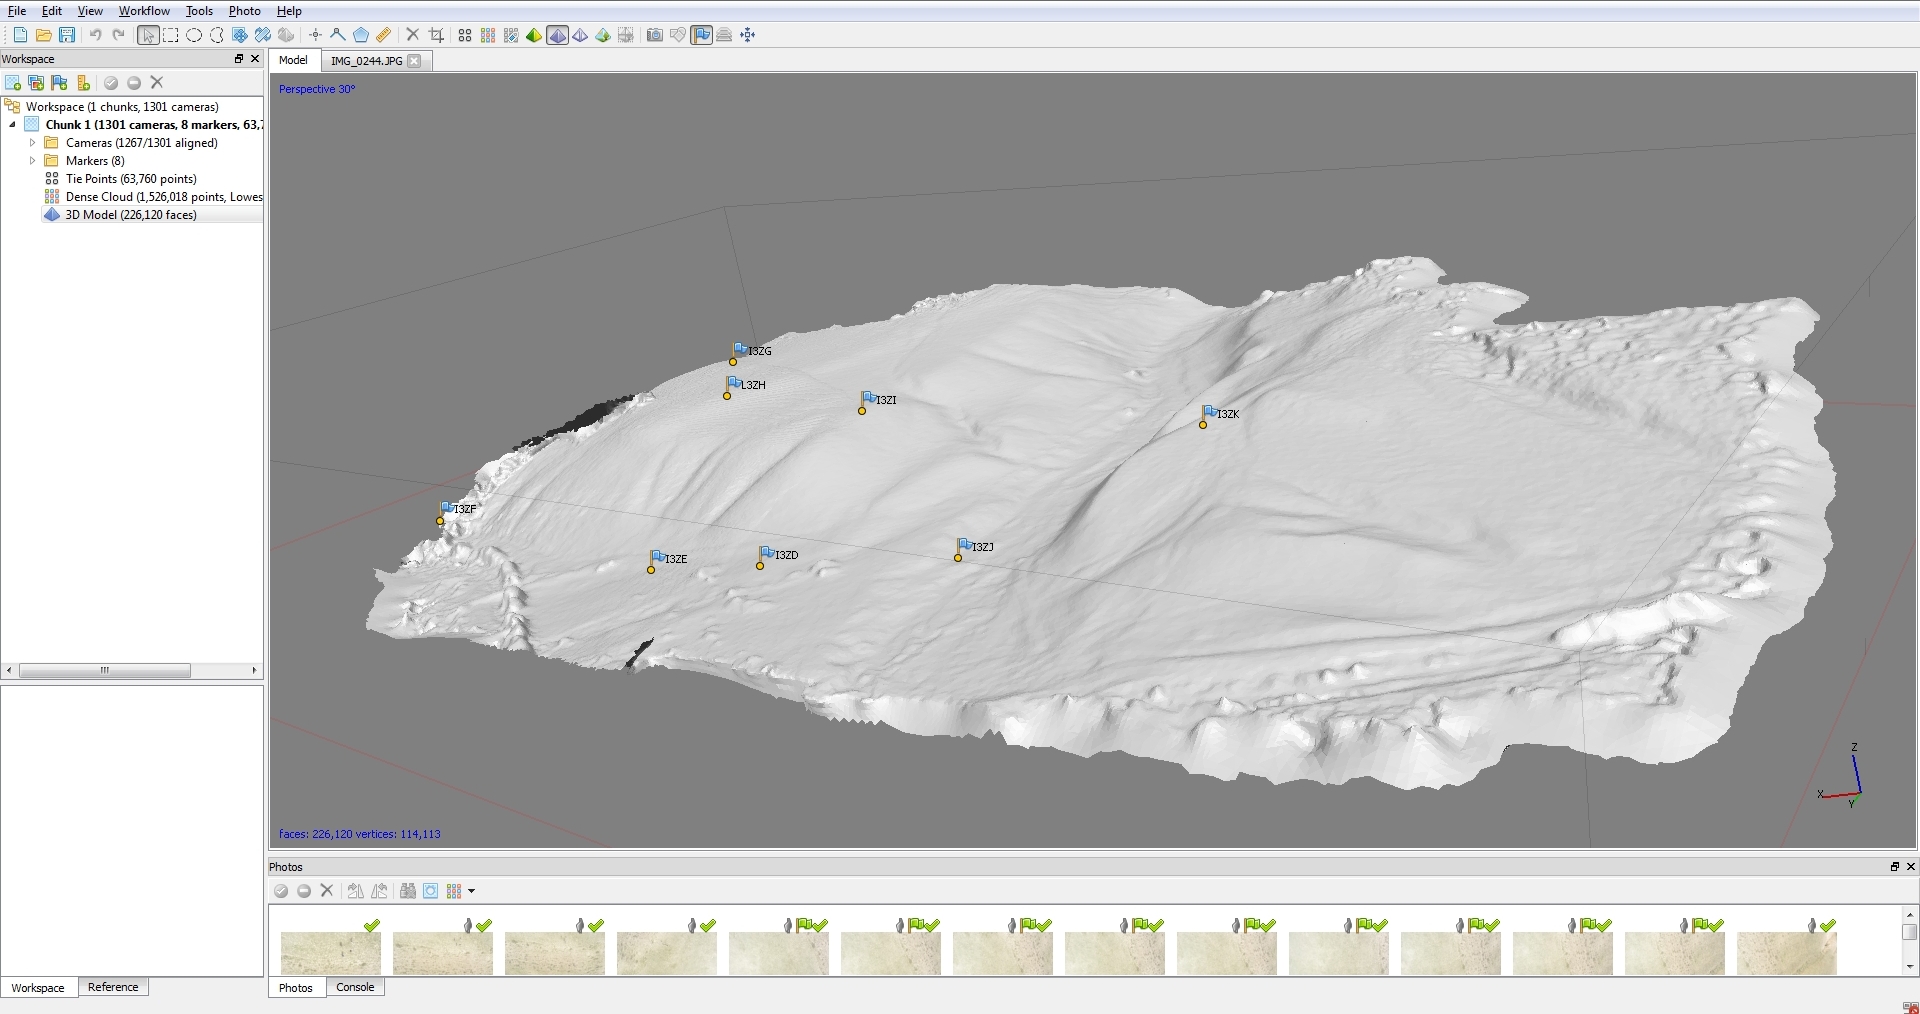
We collected a set of high-resolution photographs from the trench walls. Using Structure-from-Motion, a photogrammetry technique, we will build a precise photorealistic model of the trench (Reitman et al., 2015). This enables us to create a virtual outcrop for our studies. We sketched the trench in great detail and took notes on the nature of the sedimentary units.
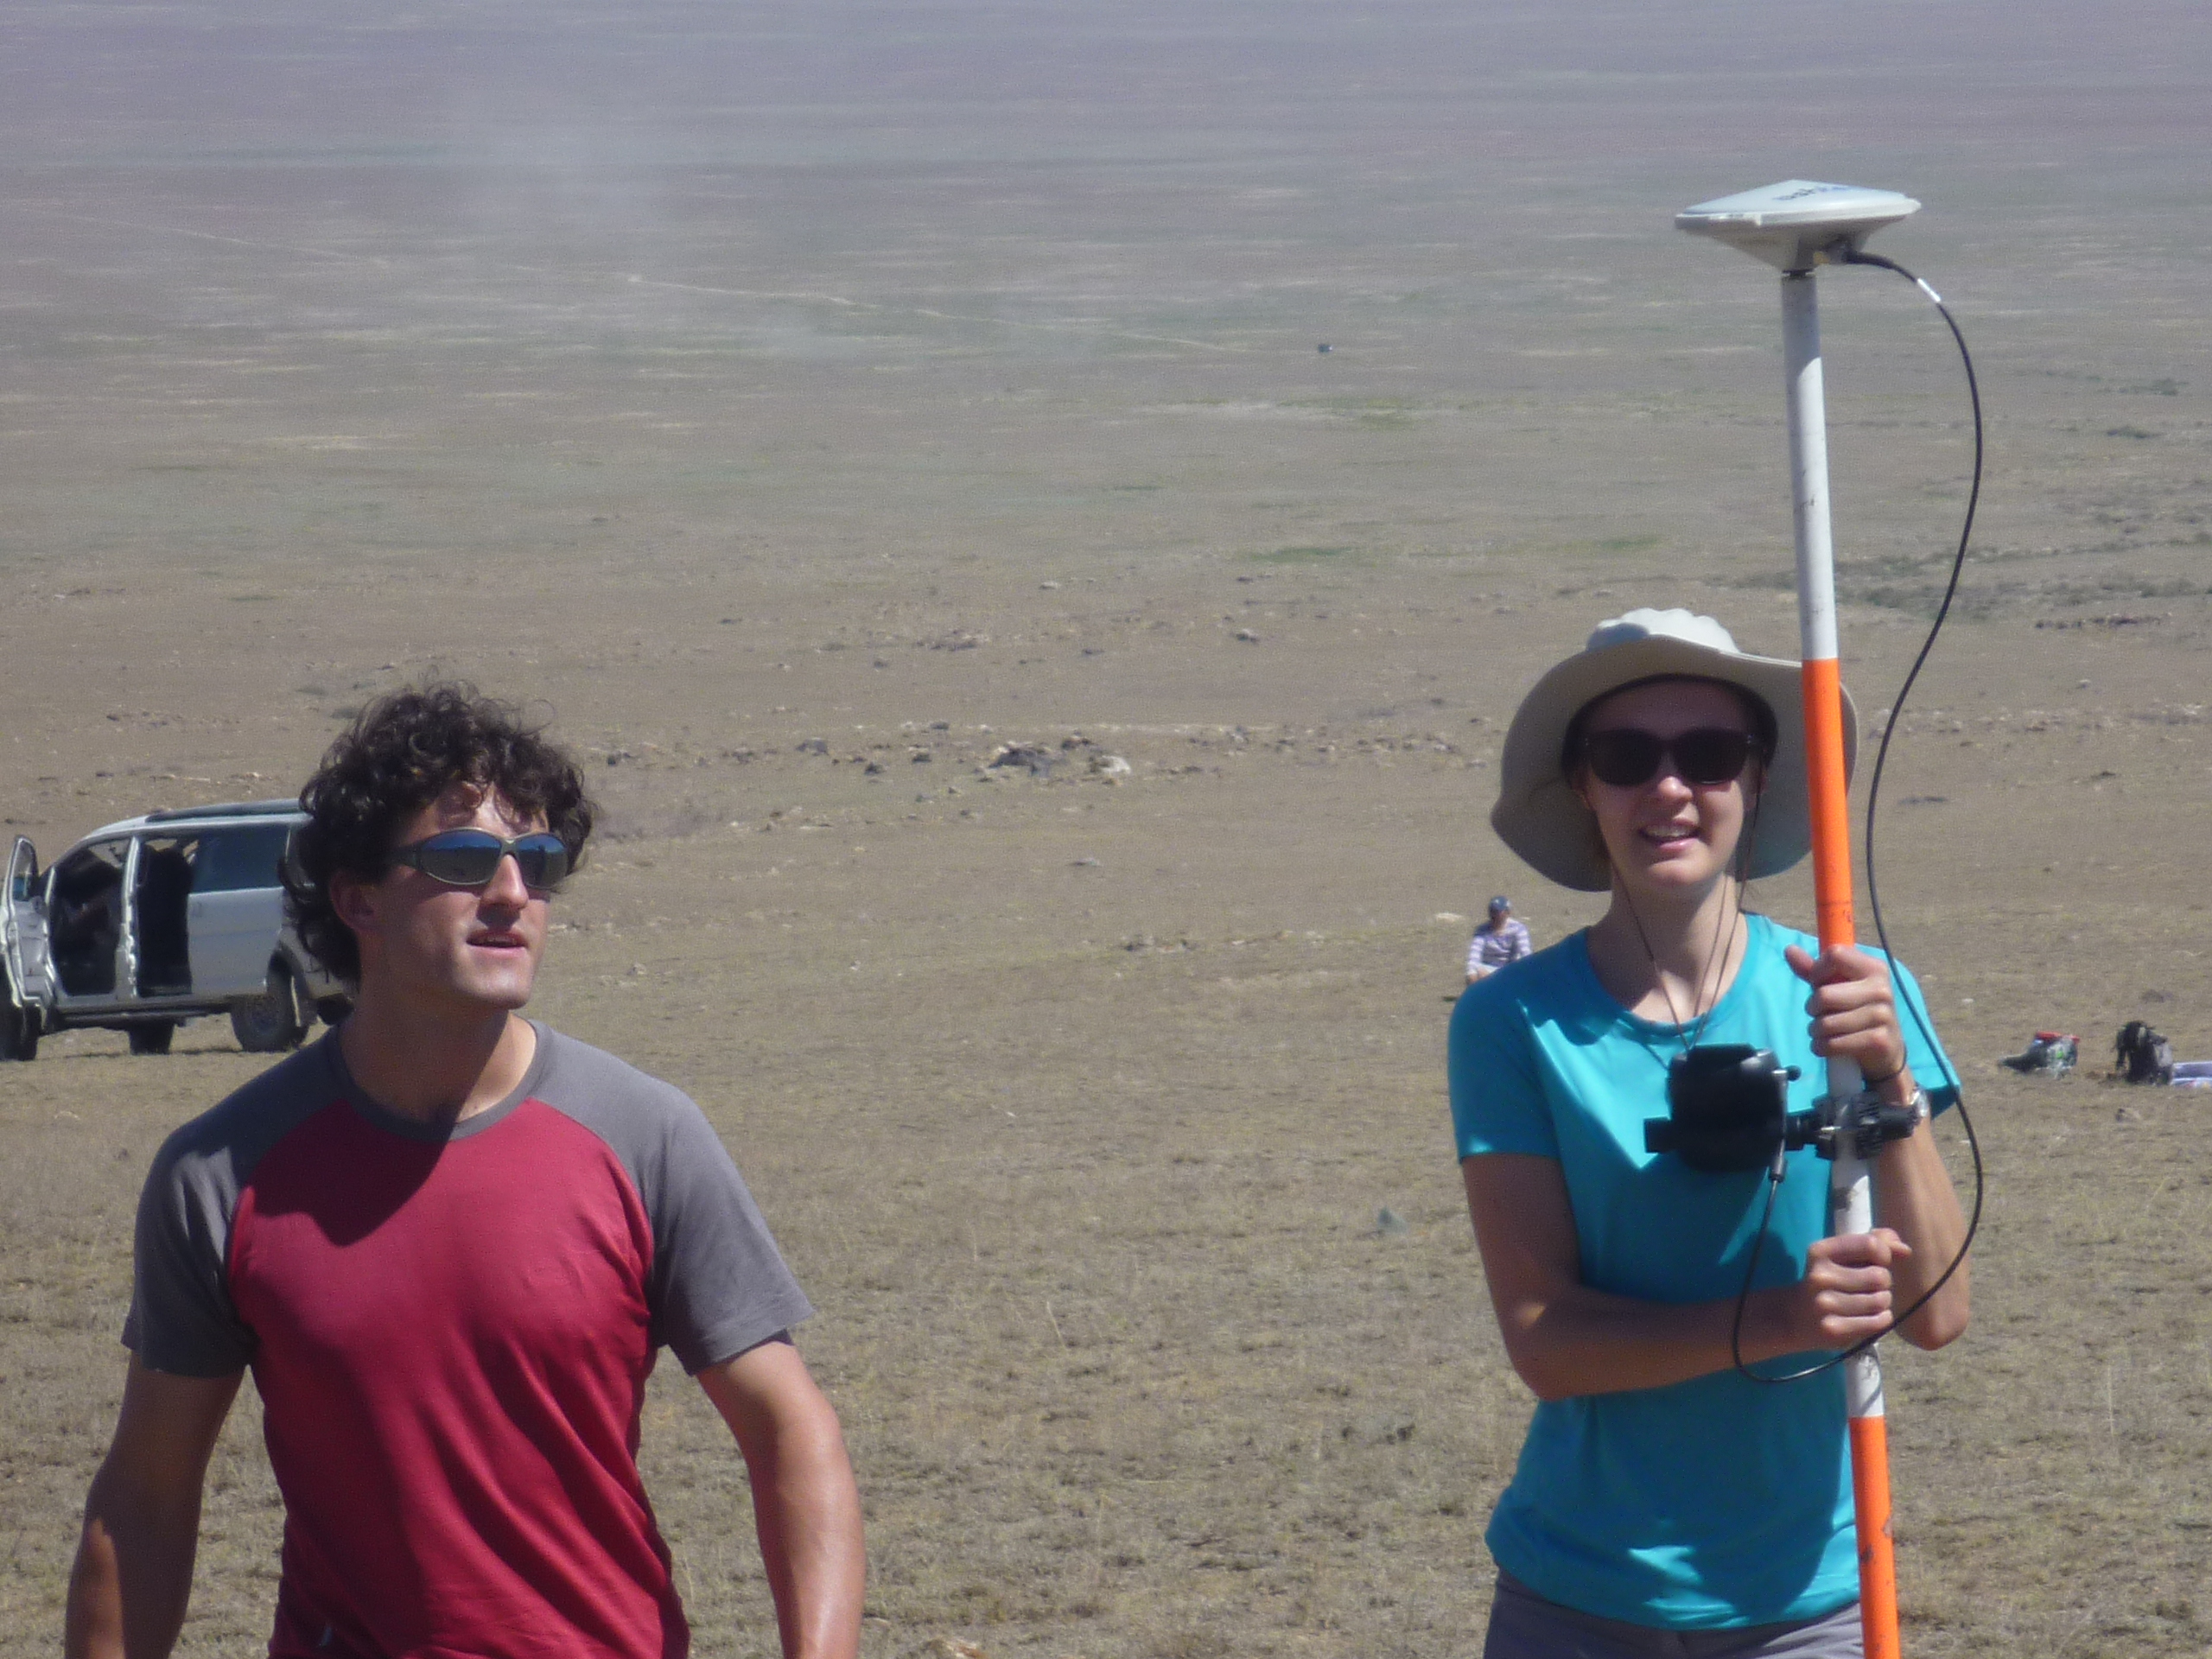
In order to measure the offset we recorded a topographic profile across the scarp by means of a yardstick and a clinometer. We took a series of photographs from the surrounding hills to create an additional SfM-model of the entire valley with the trench in its centre.
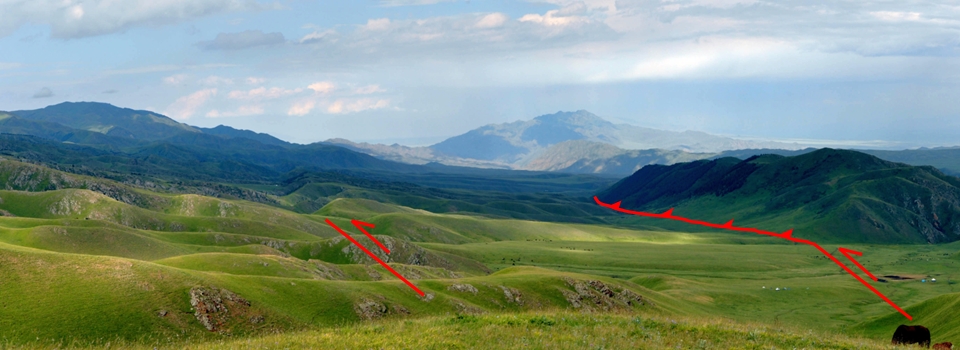
We also visited the trace of the Main Kopeh Dagh Fault at the Purnua/Turtarak site. We mapped a ~1.5 km-long section of the fault, which is clearly expressed in the landscape. Right-lateral offsets in streams were found to be ~5 m at several sites, which may correspond to the last major earthquake. Vertical offsets manifest as breaks in slope along the fault trace. We observed a clear change in lithologies across the fault—river gravels are juxtaposed against fine-grained, wind-blown sediment known as ‘loess’.
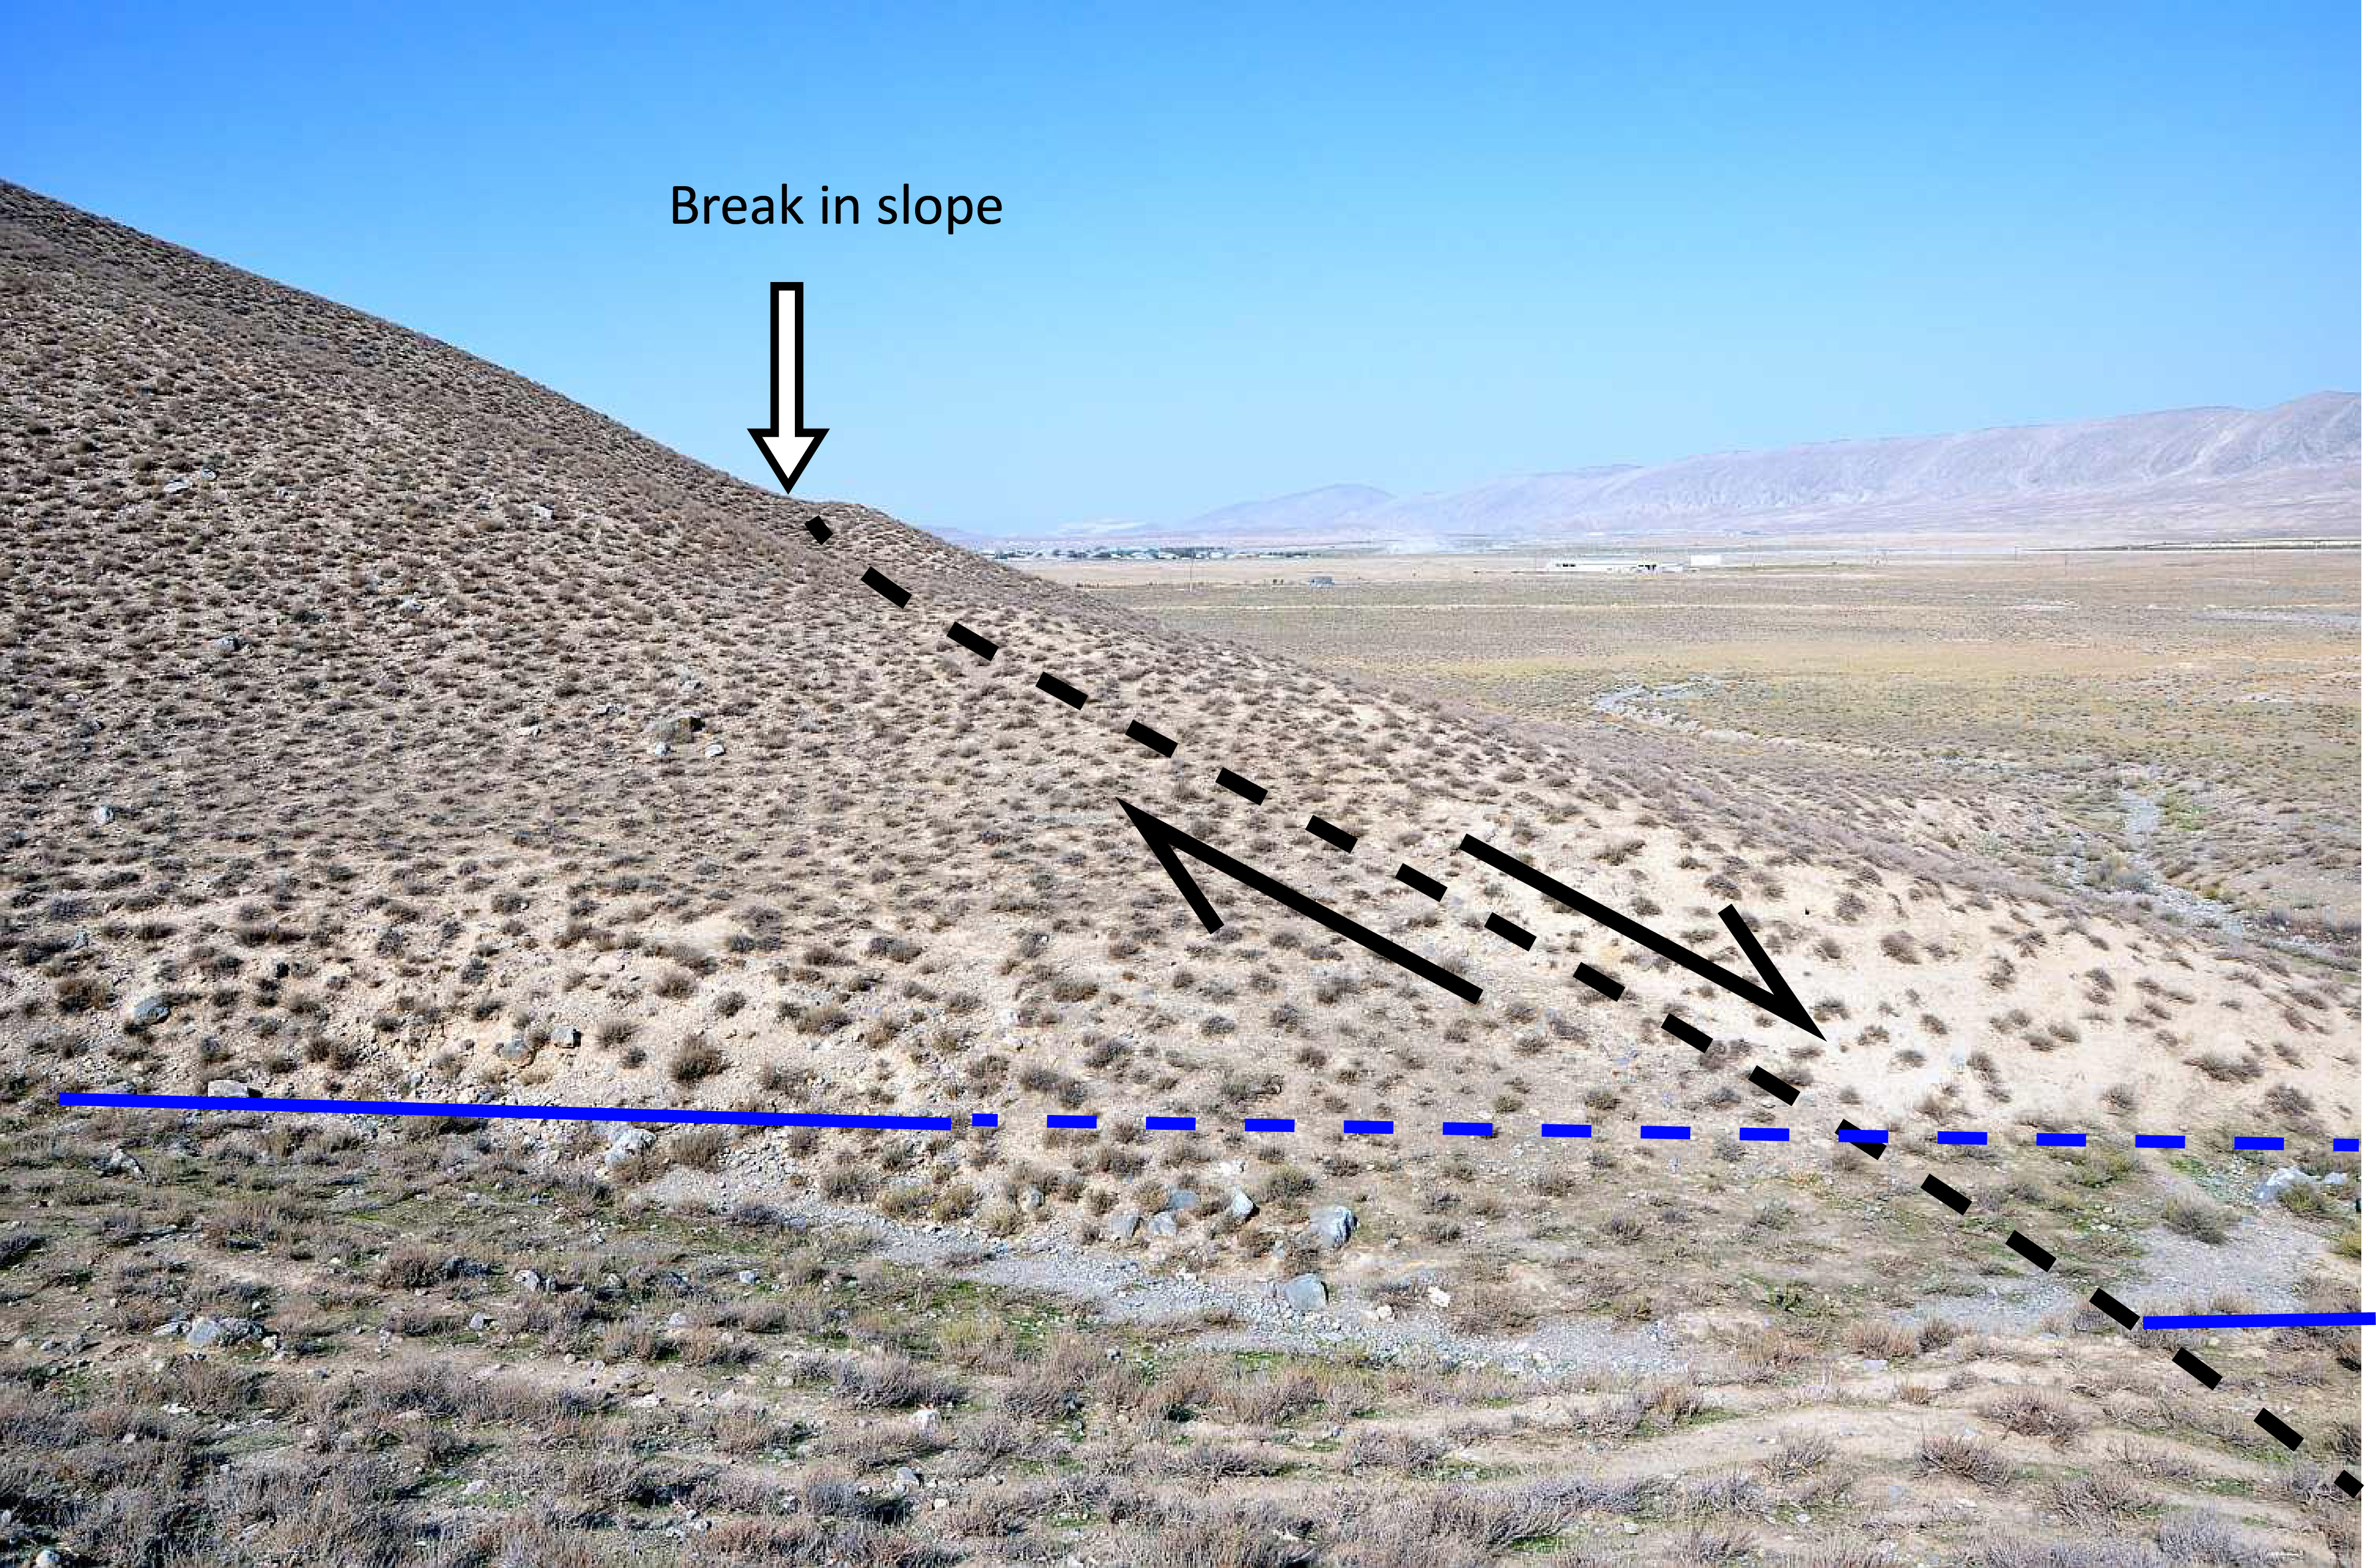
At the Purnua site, right-lateral offsets of around 5 m were found in small streams (blue line).
At another site we inspected two lineaments that we identified on satellite imagery before. From remote sensing data it was not clear whether these features were old shorelines from a relatively higher Caspian Sea level, or whether they are fault scarps. We found two ridges that we identified as sedimentary features, most likely old beach ridges, in outcrops. We sampled the shoreline in order to date them. The data will help us to determine if this region was subject to faulting after the formation of these shorelines. Thus, this work is an important contribution to understand the deformation of the crust between the Main Kopeh Dagh Fault in the southeast and the Apsheron sill in the Caspian Sea to the northwest.
Location of the 2000 earthquake surface ruptures near Kum Dagh.
The field team visited the old sea floor of the retreated Caspian Sea
Paleo-shoreline near Belek.
The Baya Dagh mud volcano near Kum Dagh was the aim of our investigations on 27 October. This interesting feature is situated in the eroded core of an anticline and exhibits both the reservoir rock and the cap rock of one of the main hydrocarbon fields in this area. The reservoir rock, consisting of well-sorted quartzitic sandstone, towers the surrounding clay layers. It was most likely extruded in a sandblow due to overpressured pore liquids, and parts of it lithified close to the surface. Erosion then removed the soft clay layers and created a spectacular dyke-like exposure. Our observations here allowed us to draw some conclusions on the stress state in the subsurface, completing the understanding of the regional tectonic setting and the formation of the hydrocarbon reservoirs.
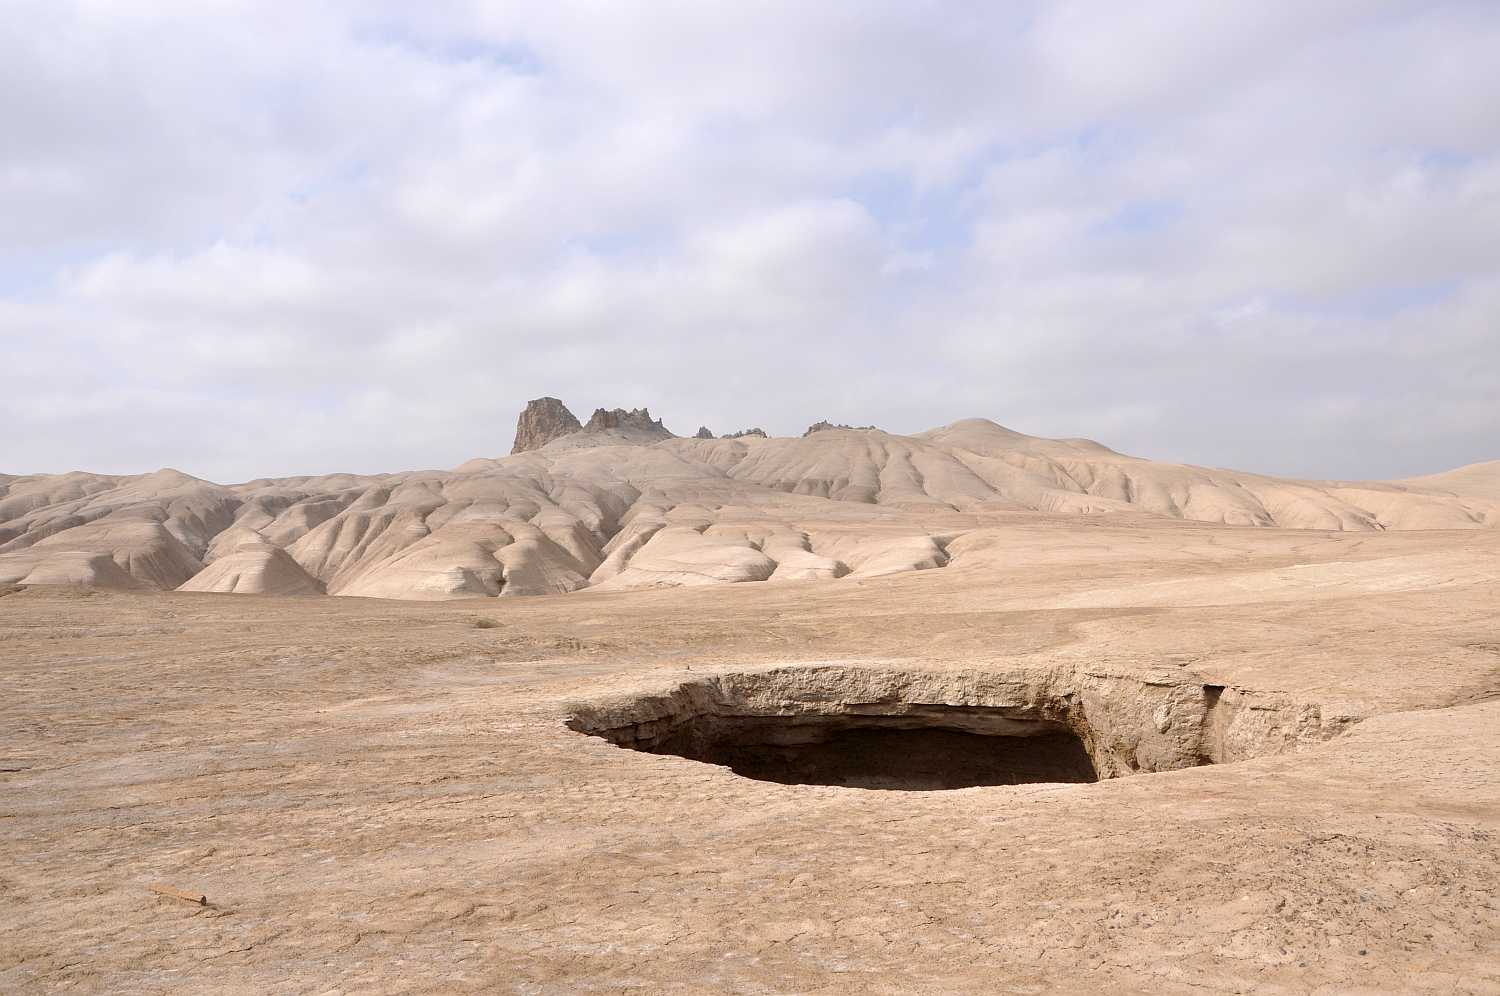
This crater on Baya Dagh mud volcano was active a few years ago according to our local guide.
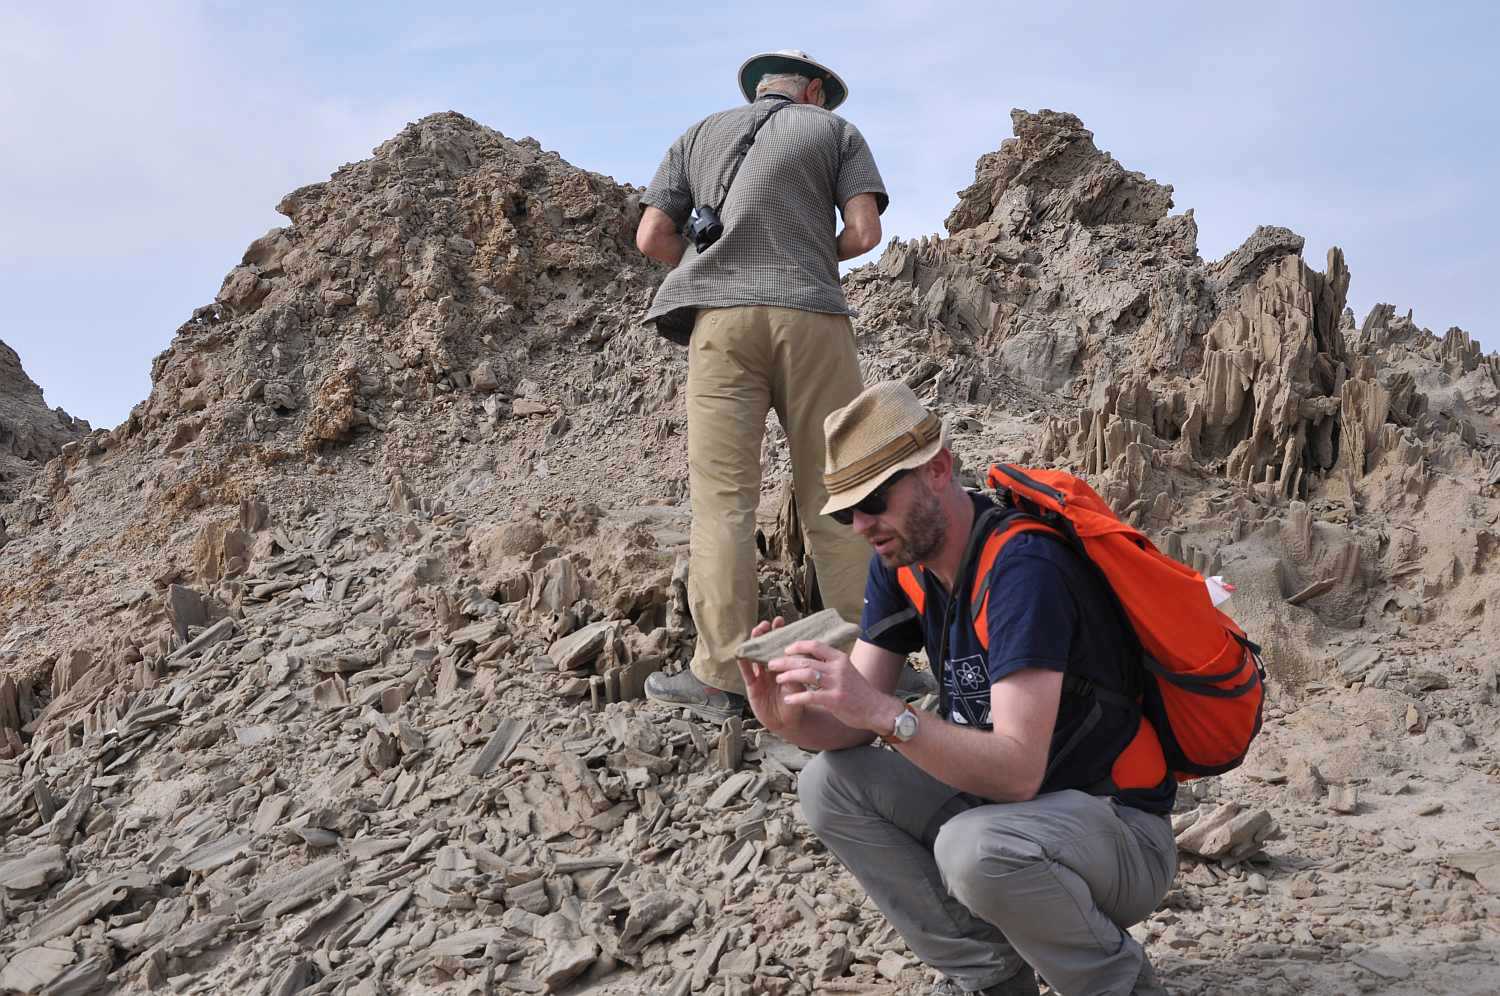
Prof. James Jackson and Prof. Richard Walker inspect the reservoir rock of Baya Dagh mud volcano.
The final stop on 27 October was the city of Kum Dagh. An earthquake in the year 2000 had caused 22 km-long surface ruptures in this area, which are not well-documented in the English literature. Our field guide and Yevgeney Bezmenov reported their accounts of the surface ruptures and showed us the location of their occurrence and their strike. These observations shed light not only on the earthquake-related hazards, but also on the source parameters of this rather unusual seismic event.
We owe thanks to our colleagues from Turkmenistan, namely Geldy Begenjev (Head of Geophysical Laboratory), Yevgeney Bezmenov and Robert Mirzin (both Research Engineers, Geodynamics Laboratory) from the Academy of Sciences. Annaniyaz Golayev was the most careful and reliable driver who managed to reach even the most remote outcrops.
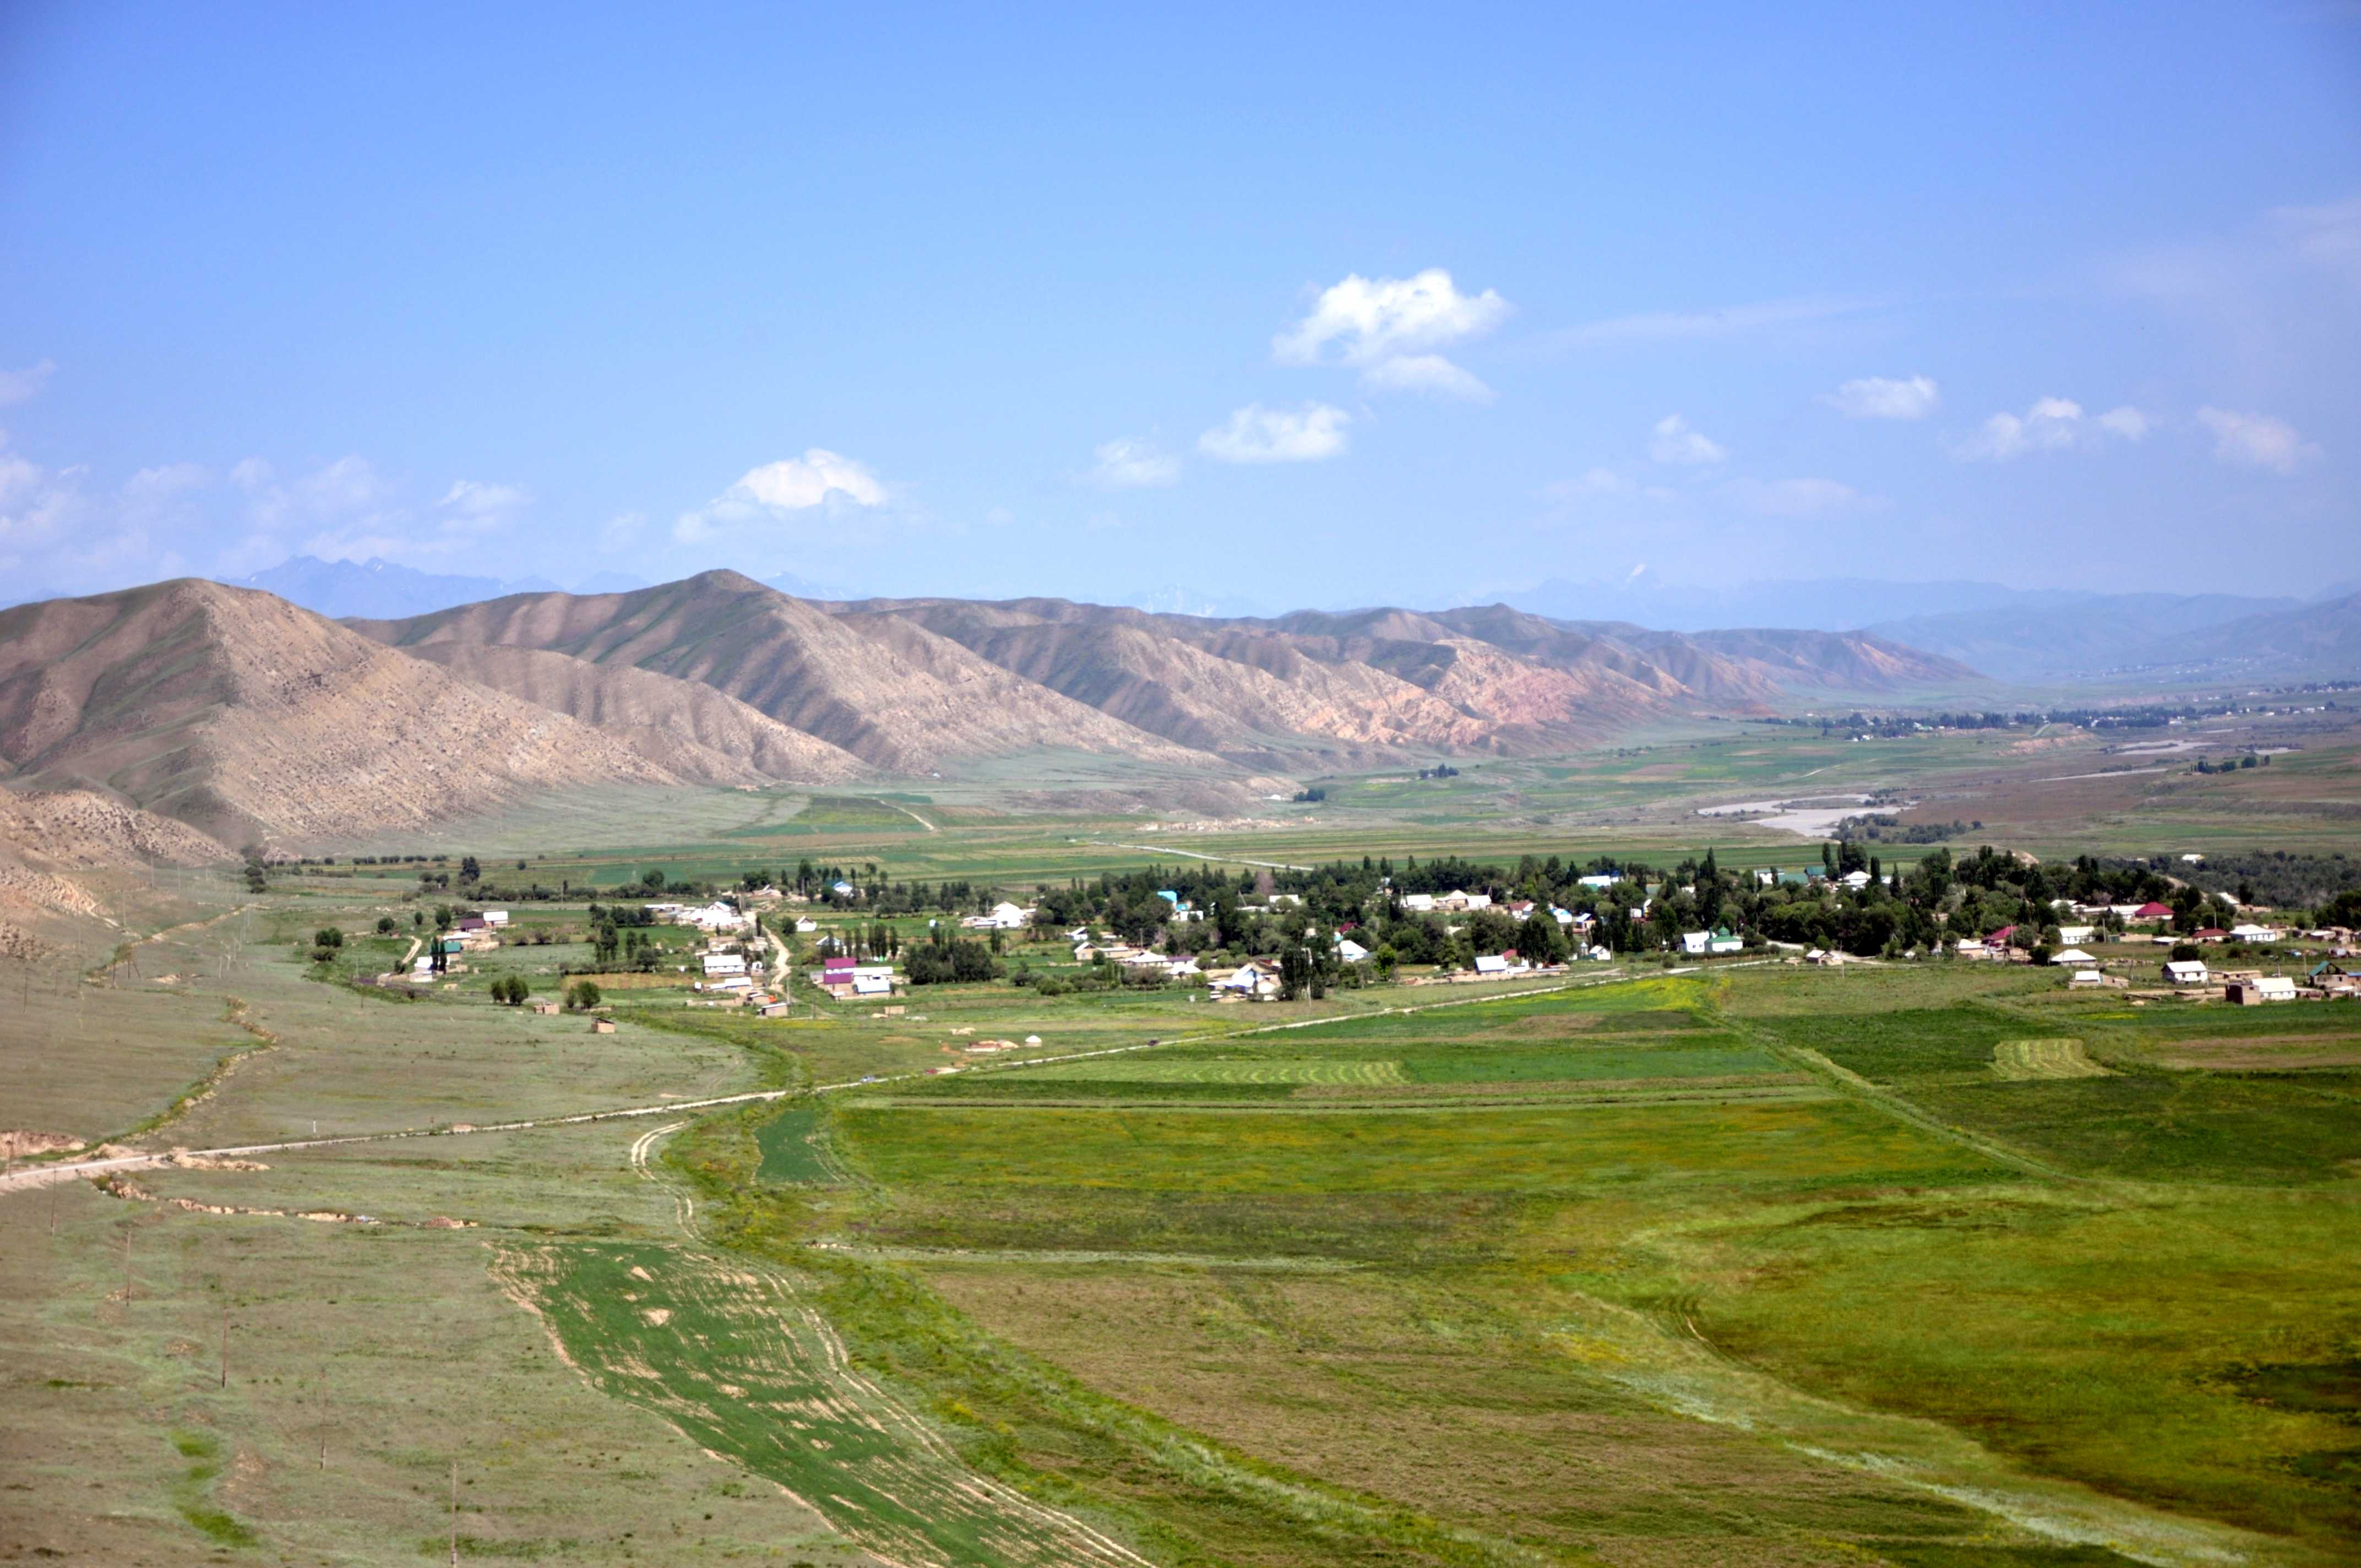
Our past field work campaigns in Kyrgyzstan and Kazakhstan focussed rather on the northern edges of the Tien Shan because we wanted to understand, among other things, where the deformation front is and how deformation propagates into the forelands. In our most recent trip to Central Asia we visited a number of interesting sites in the central parts of Kyrgyzstan. Before we started off we analysed satellite imagery and digital elevation models and observed evidence for dip-slip and strike-slip faulting in the very centre of the mountain chain. This led us to think about where the Tien Shan is deforming internally, at which rates, and if we can find out which faults ruptured in the recent past. Finding these faults, determining their slip rates, and dating the last surface rupturing earthquakes will allow us to address a number of interesting questions:
A fault scarp offsets the youngest river terraces.
A set of uphill-facing fault scarps.
Mapping the fault.
Sampling a thrust fault where Quaternary gravels override Holocene loess.
DGPS surveys were run to measure the offsets across the fault.
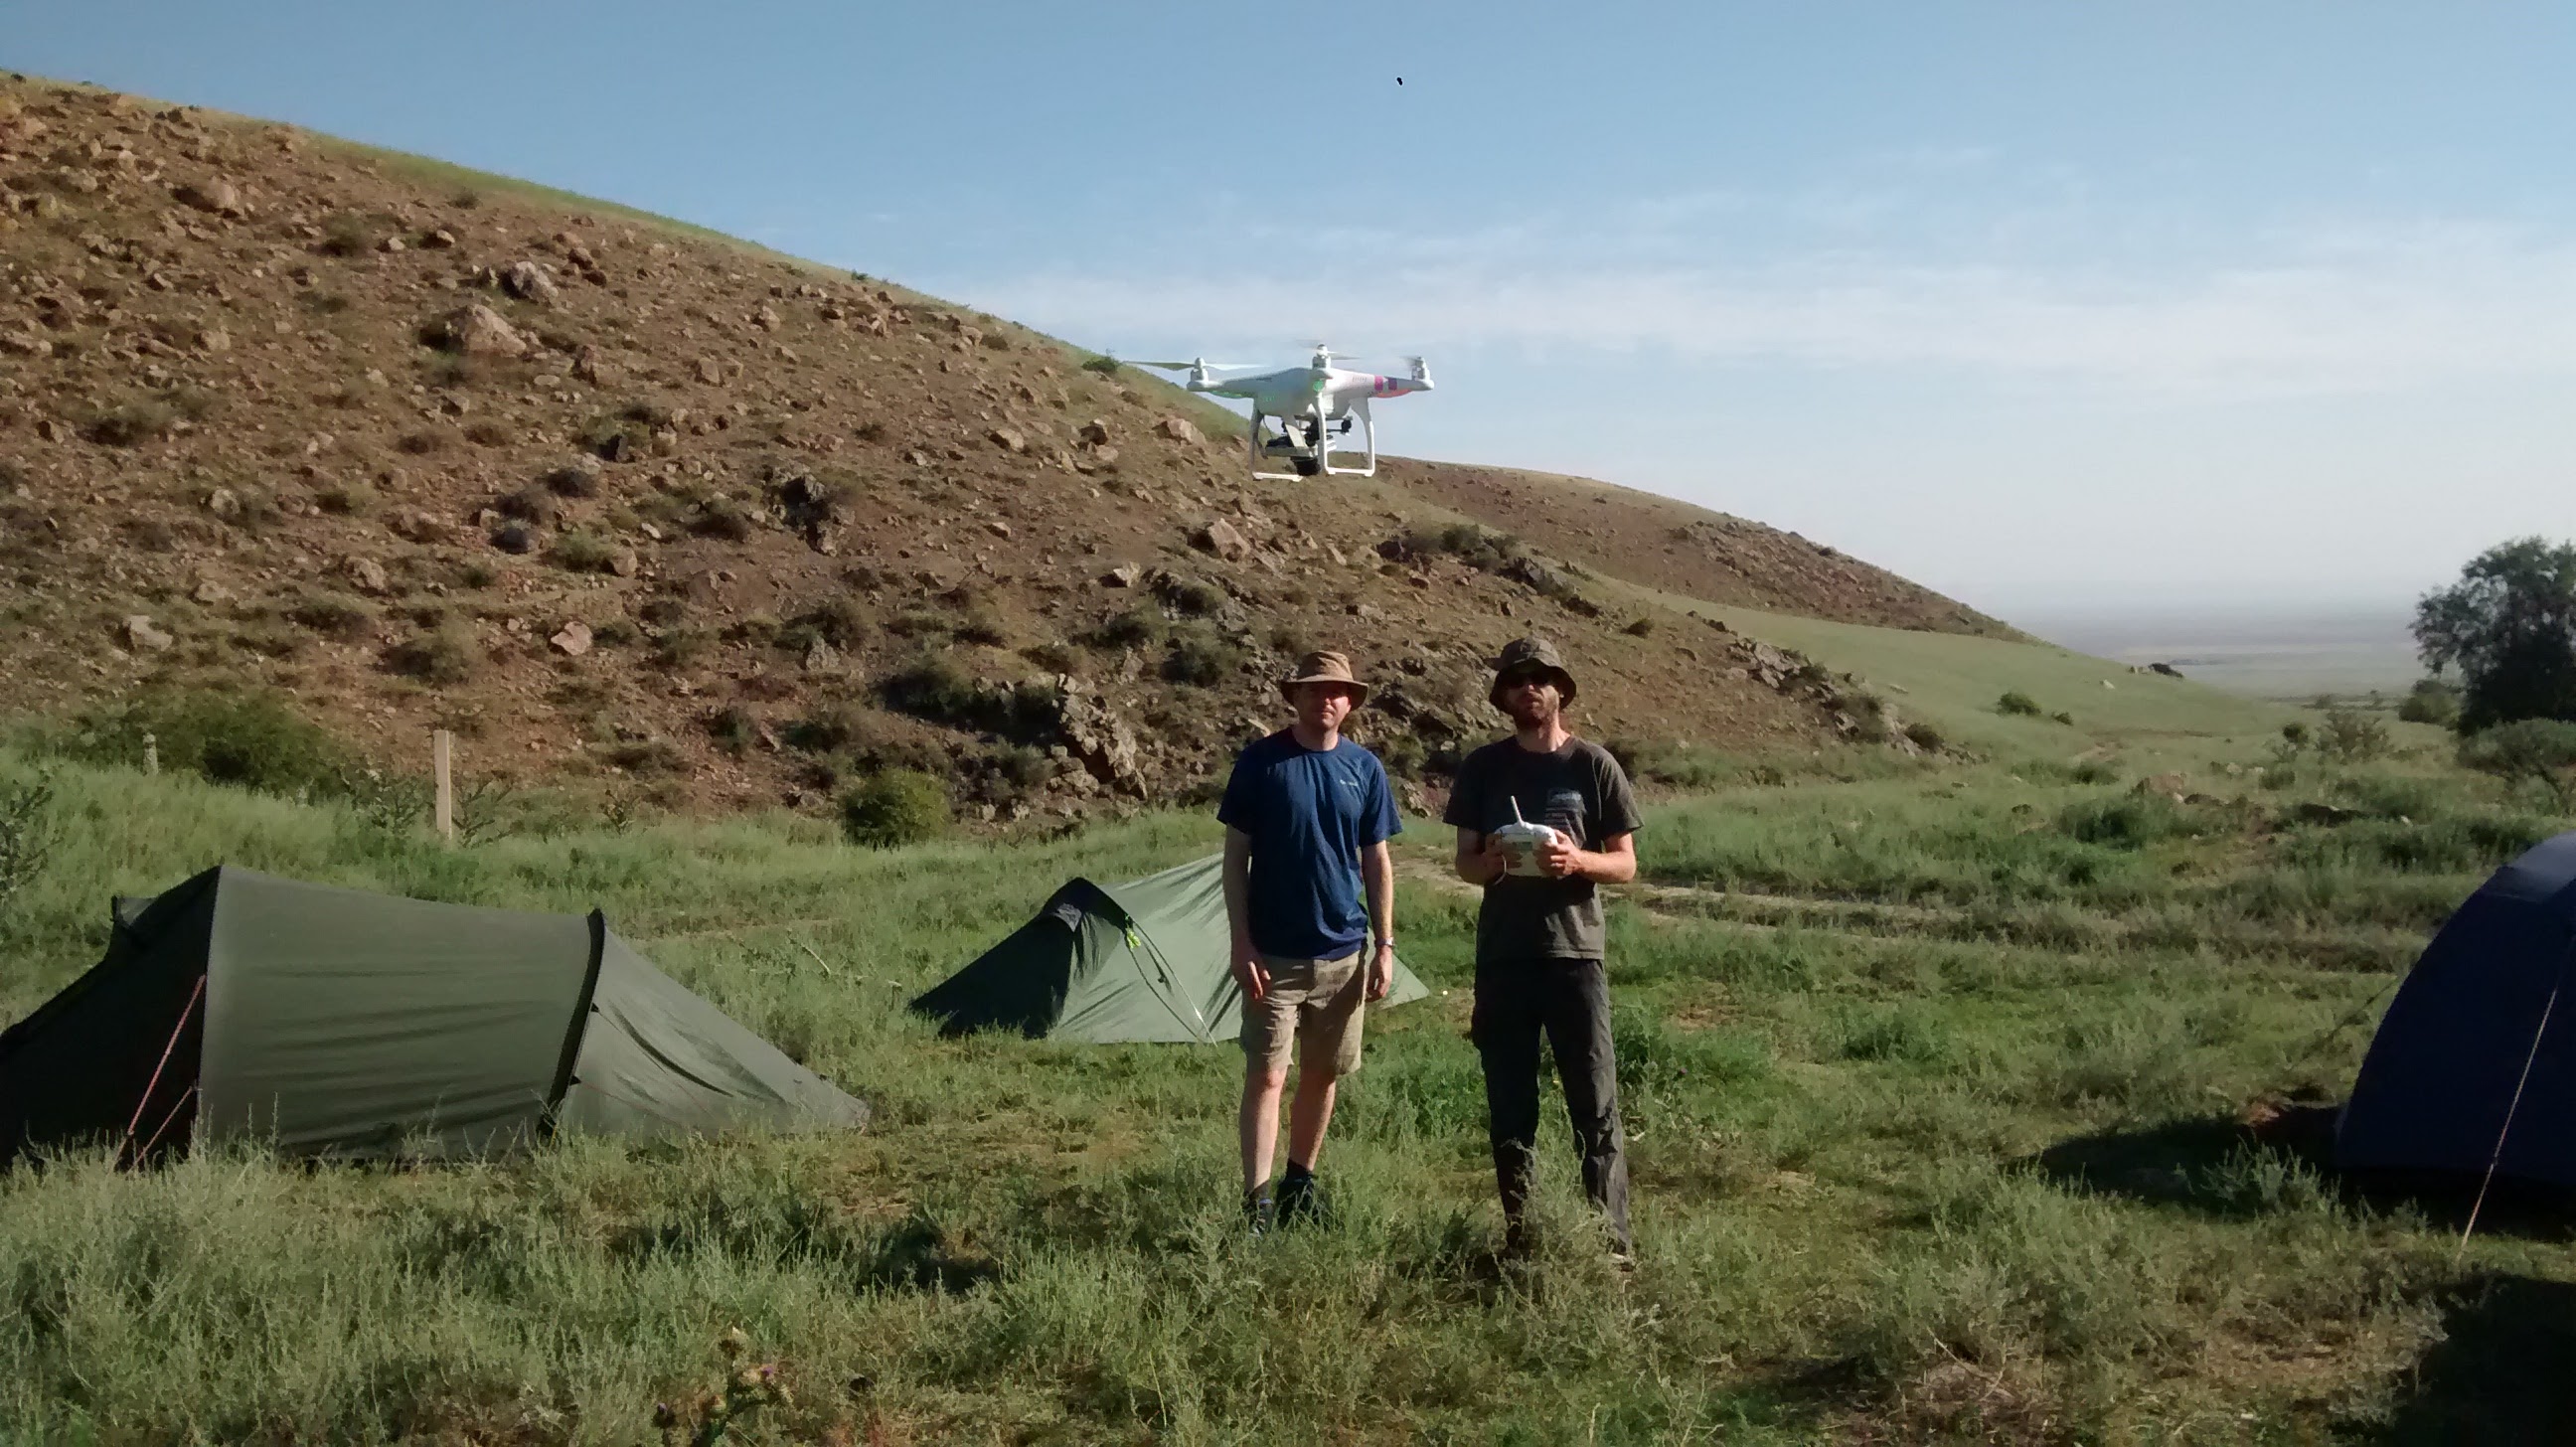
We were a team of scientists from Oxford (Richard Walker and John Dianala) and Cambridge (Andy Howell and Christoph Grützner, now at Jena University), led by our colleague Kanatbek Abdrakhmatov from the Institute of Seismology in Bishkek. Our first target was located near the famous Naryn Basin. A set of huge uphill-facing fault scarp is developed here in one of the steep slopes, and we even found very young fluvial surface to be offset by the fault. However, attempts to excavate and date the most recent offset had only little success due to the very shallow groundwater table. It was decided to at least produce a high-resolution elevation model (DEM) so that we can analyse the morphology of the site. Several hundreds of aerial photos captured with our drone will be used to compute the DEM.
Tilted layers testify to Neogene-Recent faulting and folding near Naryn.
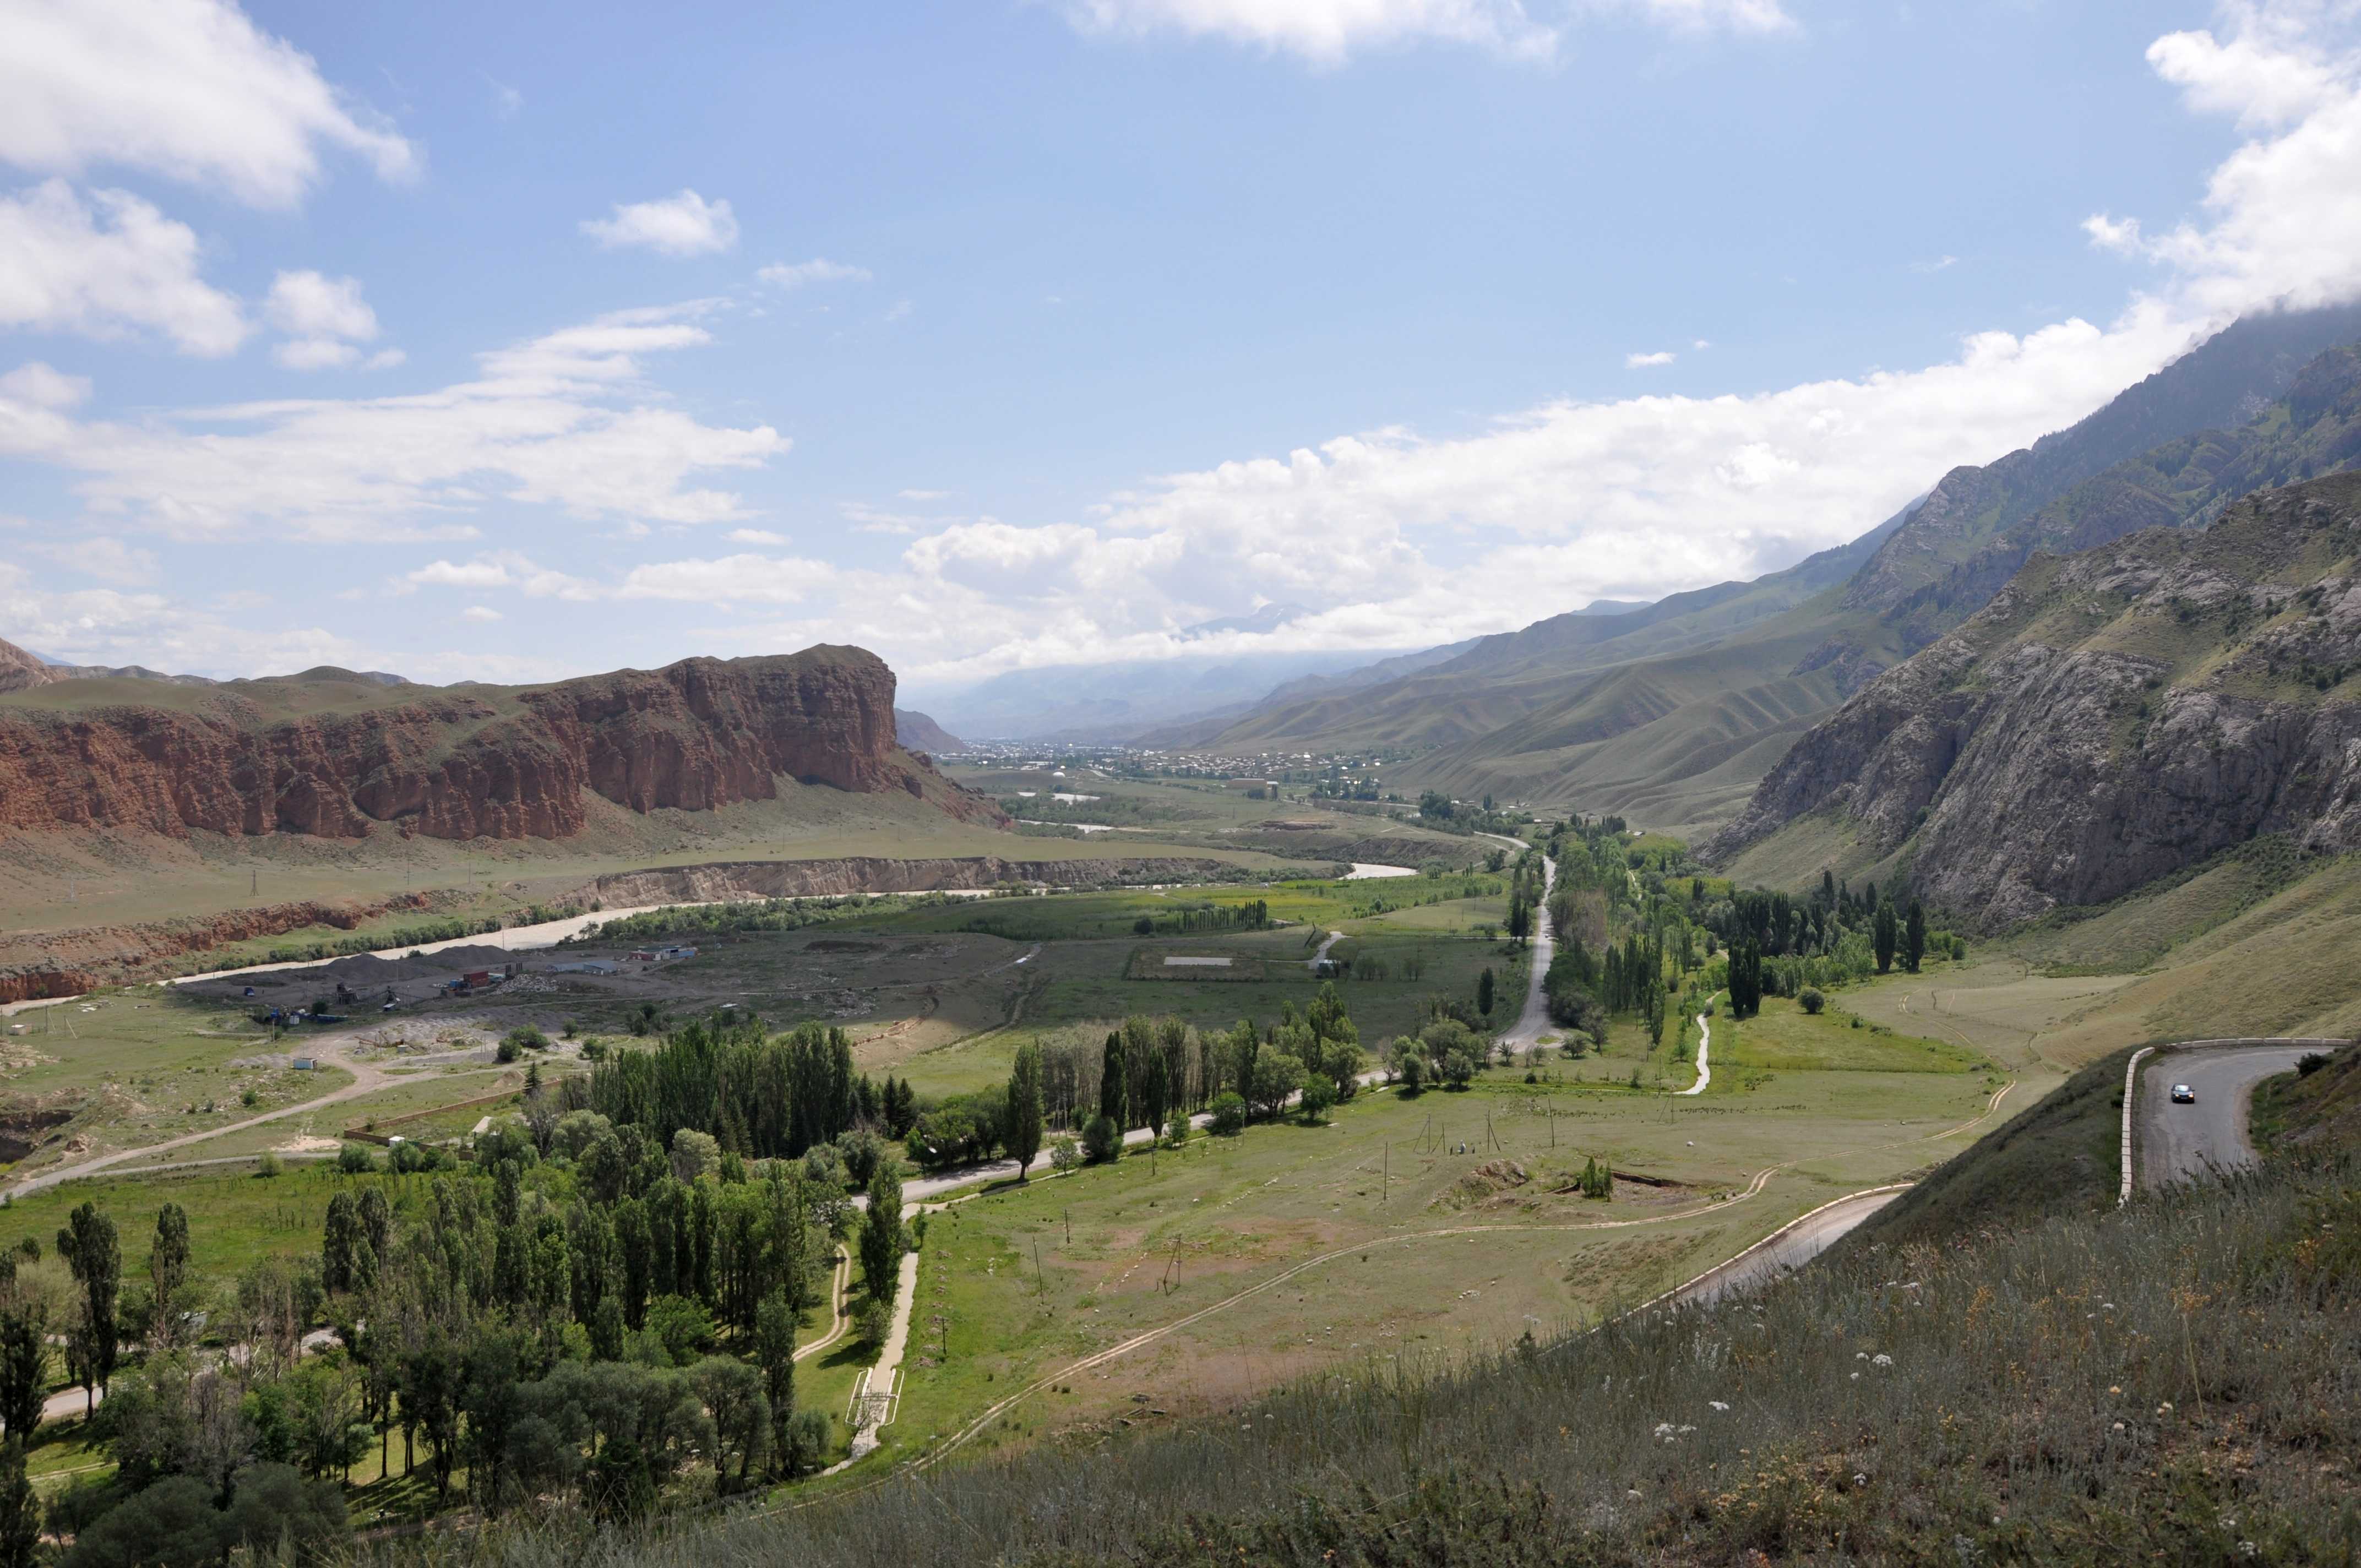
Tilted Neogene rocks, the fault crops out near the river.
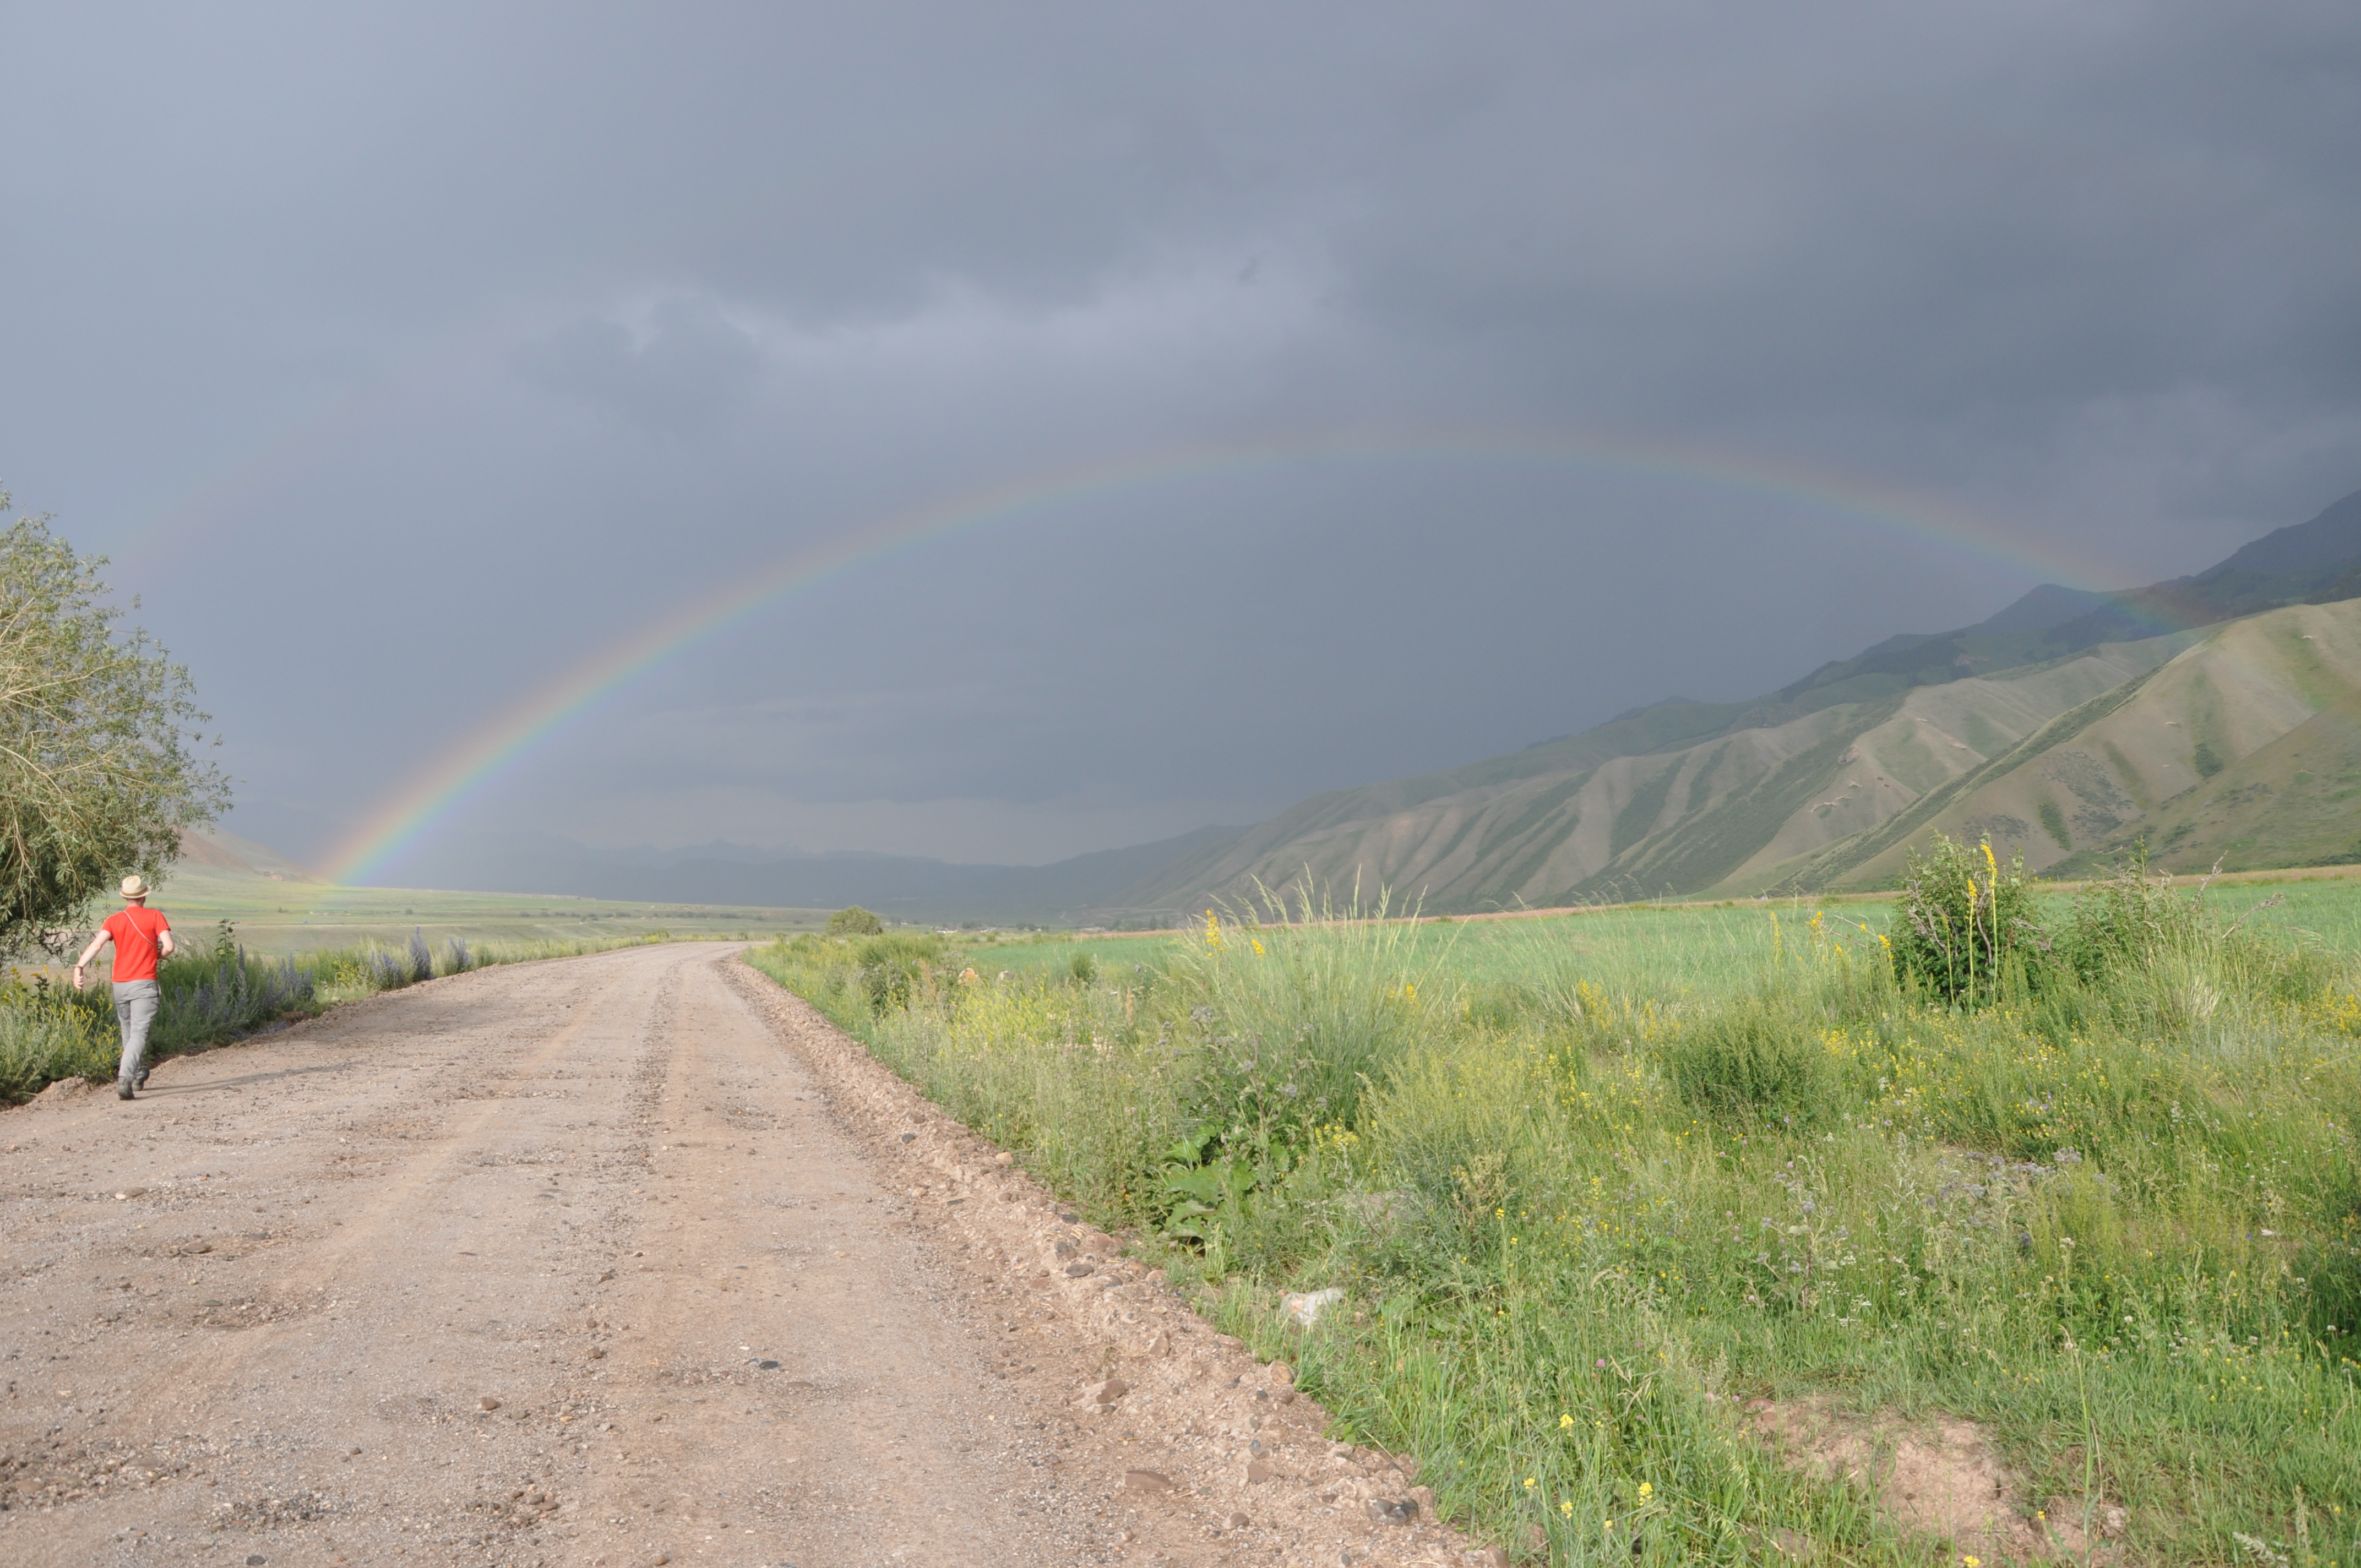
Teh fault is probably at the end of the rainbow.
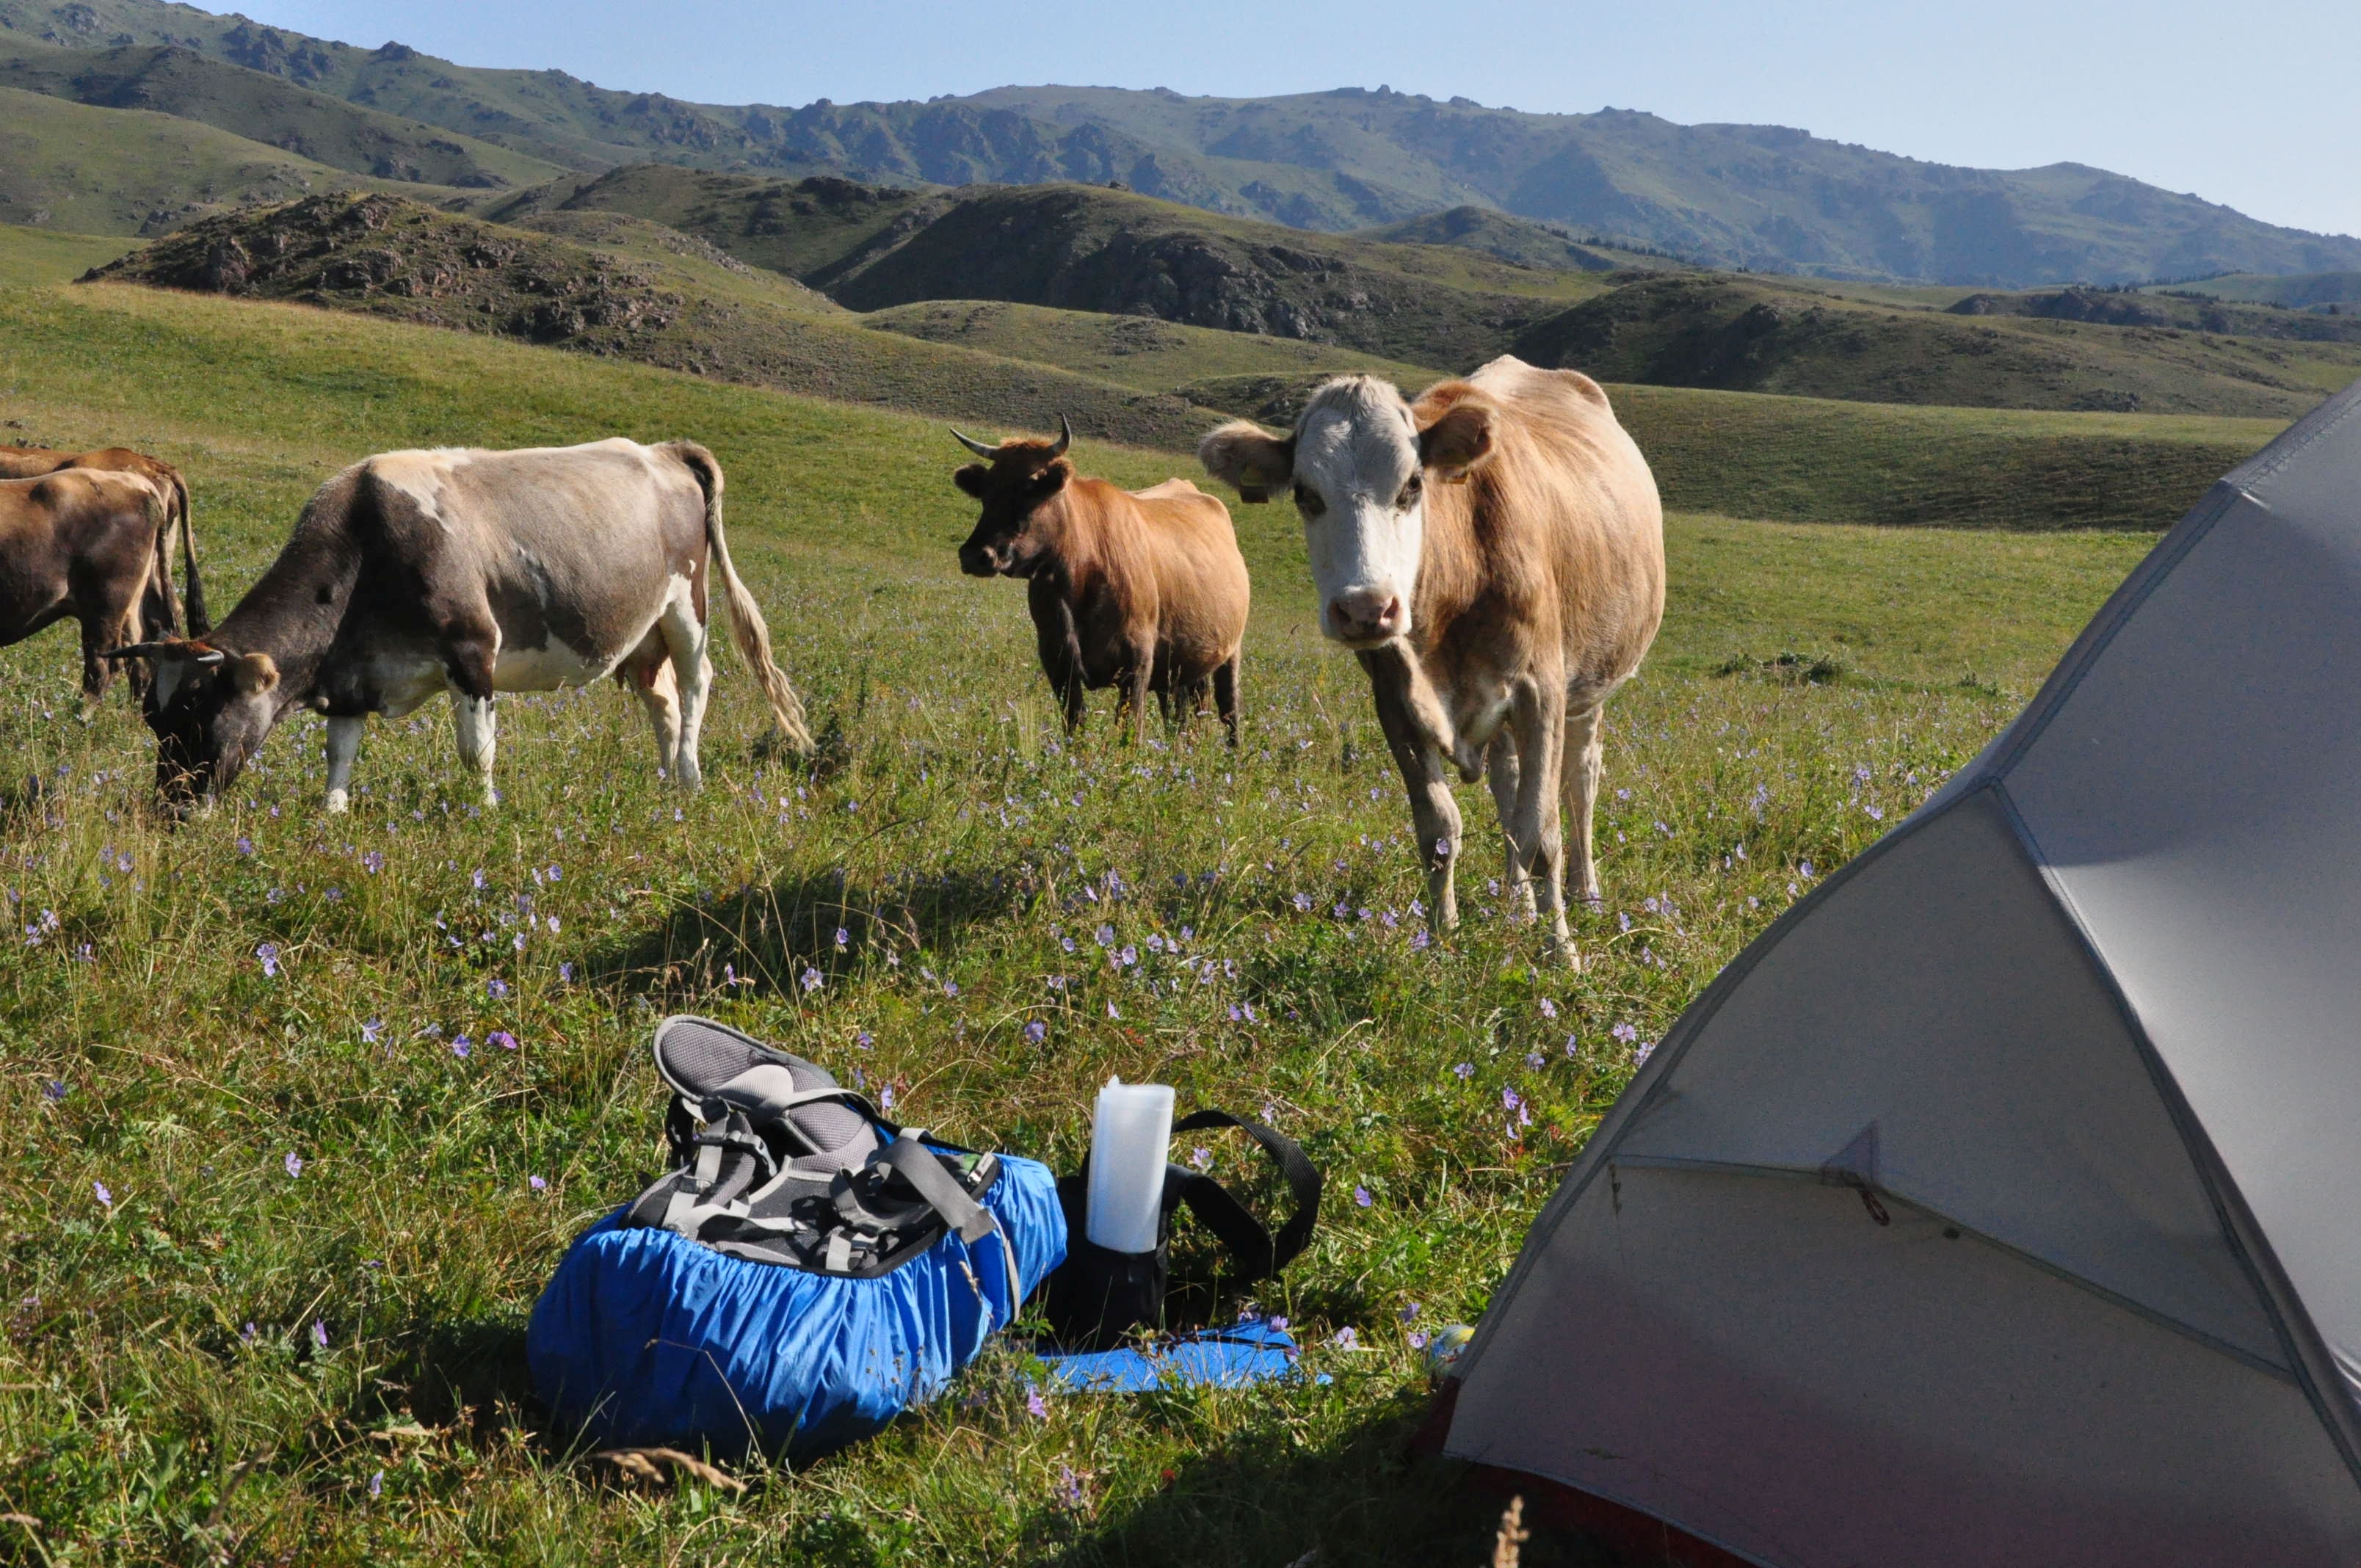
In an adjacent flood plain we also encountered offsets in young surfaces and we droned a large area in order to precisely measure the amount of offset and possibly also the slip vector of the fault. We then moved on to higher ground and surveyed a fault in the high mountains south of Naryn. The fault scarps is somewhat degraded here and this rupture is probably a bit older than the ones we had seen before. We traced it for several kilometres and droned a good part of it. A long hike into the high mountains, always following the scarp, not only led us to discover some interesting sites, but we were also stunned by the wonderful hospitality of the locals who invited us to their yurts and served fresh bread and fermented horse milk (Кымыз).
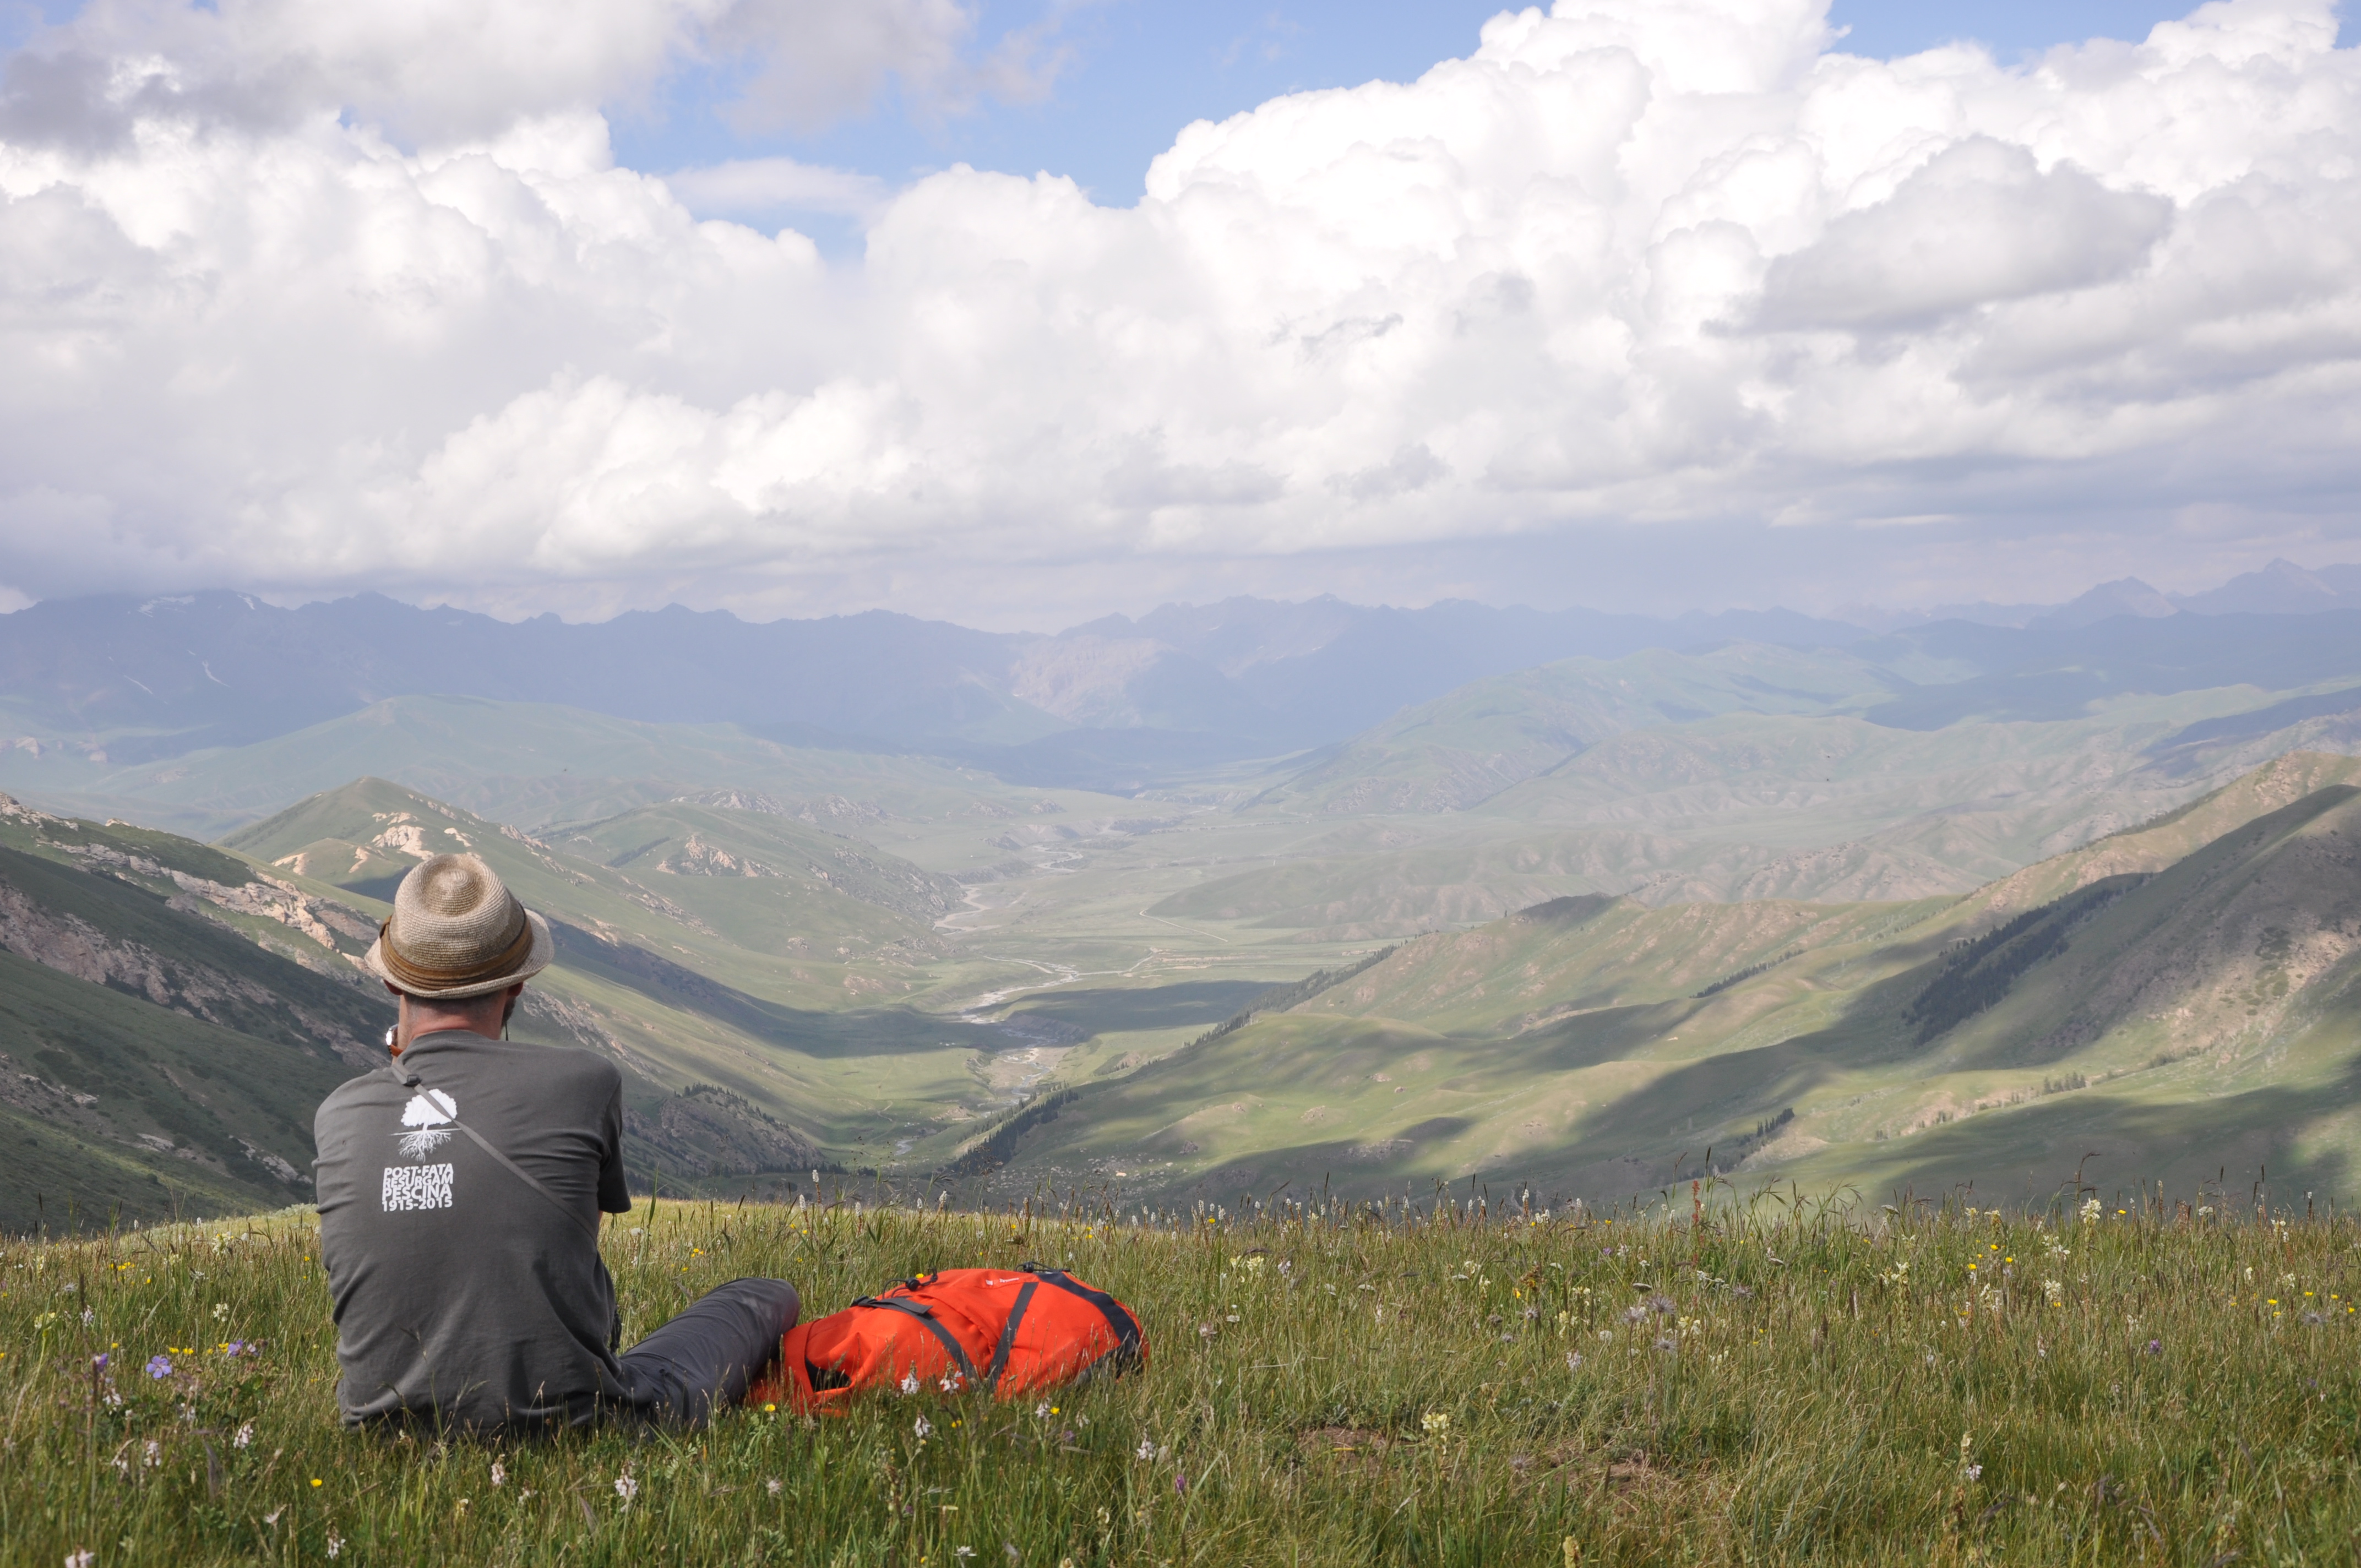
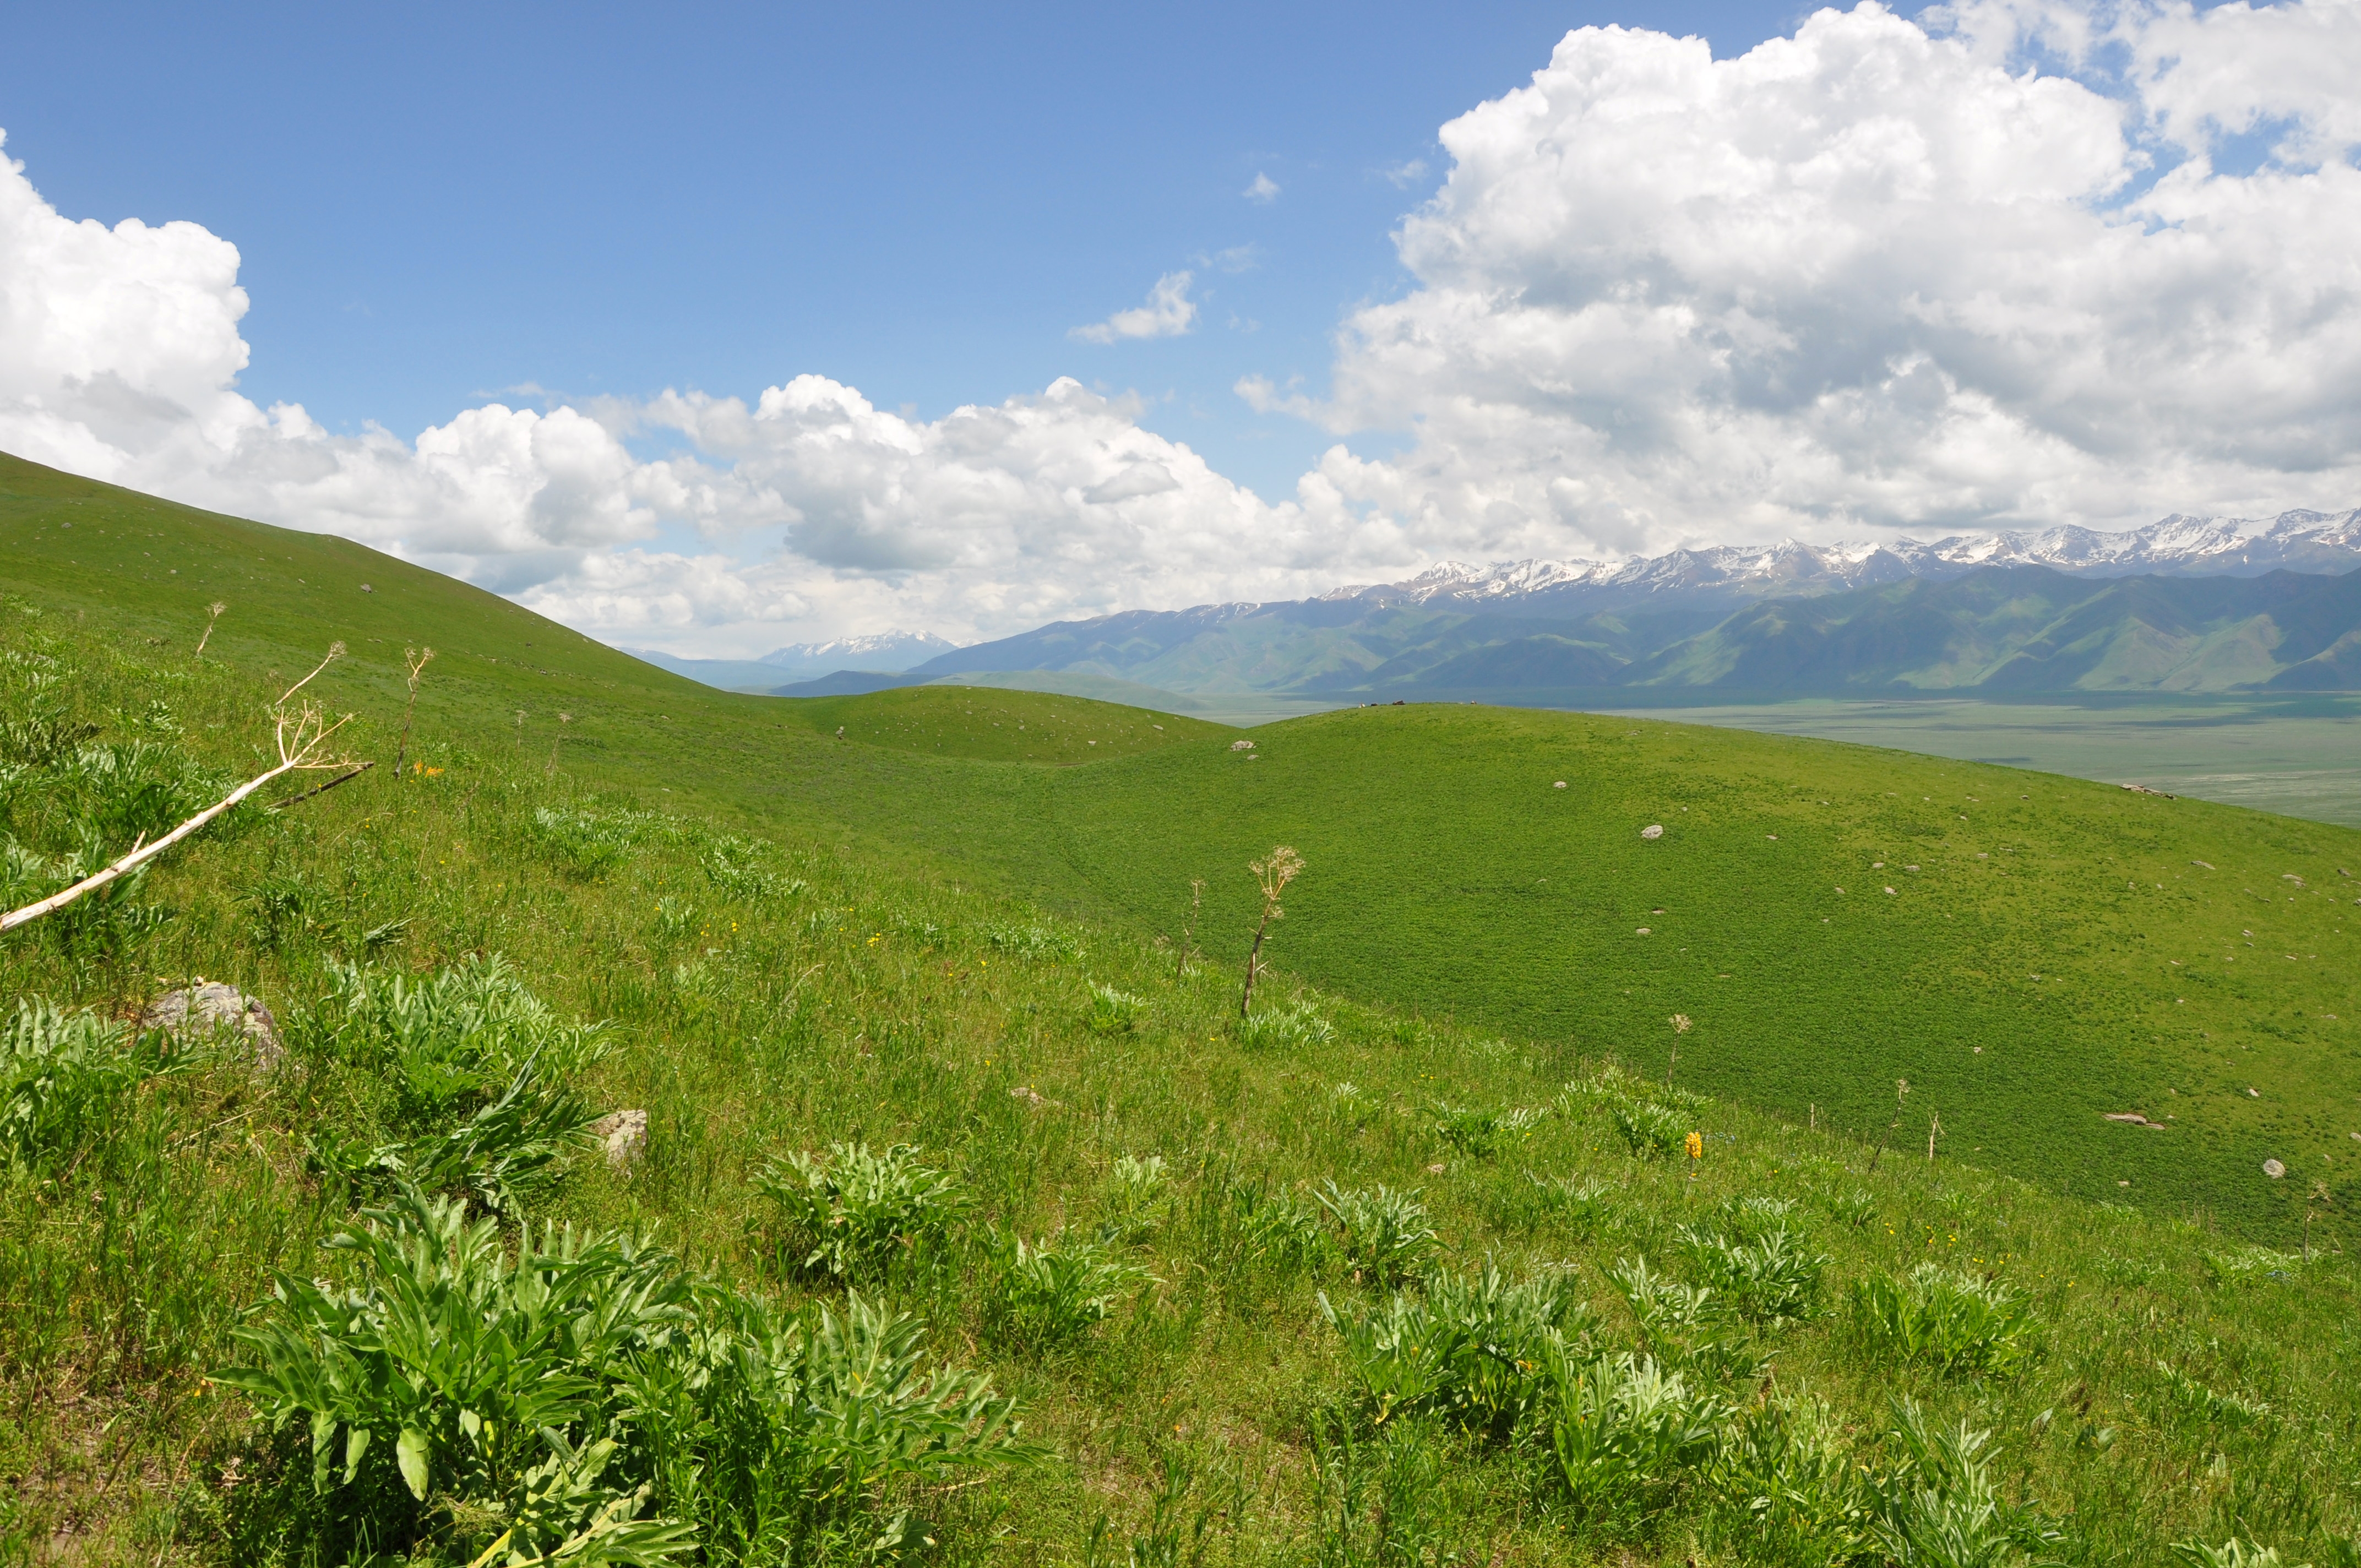
Enjoying a tectonic geomorphology Disneyland.
Aerial photograph of the scarp that formed during the 1911 Chon-Kemin Earthquake and now blocks a little stream.
This scarp formed in the 1911 Chon Kemin Earthquake (M~8) and dammed a small stream.
An uphill facing scarp offsets Late Quaternary gravels.

A cluster of earth scientist climbing the fault scarp.
Our last study site was located at the northern coast of Lake Issyk Kul, where we mapped a thrust fault and a strike-slip fault. The latter had a rather faint expression in the landscape, while the thrust fault showed a scarp of several metres height.
We thank our driver and our cook, and we are grateful to Kanatbek because as always he perfectly organised the logistics and showed us the best outcrops in the region.

Muscat in Oman is particularly vulnerable. Pixabay.
Camilla Penney, University of Cambridge
That tsunamis can cause death and devastation has become painfully clear over the past two decades. On Boxing Day, 2004, a magnitude 9 earthquake off the coast of Sumatra caused waves several metres high to devastate the Indian Ocean – killing more than 230,000 people in 14 countries. In 2011, another magnitude 9 earthquake, this time off Japan, produced waves up to 20 metres in height, flooding the Fukushima nuclear reactor. It killed more than 15,000 people. ![]()
A new study, published in Geophysical Journal International, by my colleagues and me suggests that a 1,000km long fault at the northern end of the Arabian Sea may pose a similar threat.
The Makran, as the southern coastal region of Iran and Pakistan is known, is a subduction zone. In such regions, one of the Earth’s tectonic plates is dragged beneath another, forming a giant fault known as a “megathrust”. As the plates move past each other, they can get stuck, causing stress to build up. At some point the stress becomes high enough that the megathrust breaks in an earthquake.
This was exactly what caused the Sumatra 2004 and Tohoku 2011 earthquakes. When a megathrust moves suddenly, the whole seafloor is offset and the water has to move out of the way over a huge area. This sets off waves with particular characteristics that can cross entire oceans: tsunamis. The phenomenon, along with their potentially large size, makes subduction zone earthquakes particularly dangerous.

But just because a part of a subduction zone produces earthquakes doesn’t mean that the whole megathrust can move in one go. We often see that stress builds up at different rates on different parts of the fault, with some parts sliding smoothly past each other. How much of a megathrust can move in one go is important because it determines the size of the resulting earthquake. The amount that the Makran megathrust can move in earthquakes has been a longstanding question, but the hostile climate and challenging politics of the region have made research there difficult.
We know that the eastern part of the Makran megathrust (in Pakistan) can produce large earthquakes. A magnitude 8.1 quake off the coast of western Pakistan in 1945 caused a tsunami which killed about 300 people along the coasts of Pakistan and Oman. There have been several smaller earthquakes on the megathrust since, including a magnitude 6 in February this year.
If the western part of the Makran (in Iran) also produces earthquakes – and the whole Makran megathrust were to move in one go – it could produce a magnitude 9 earthquake, similar to those in Sumatra and Tohoku.
However, we have never actually recorded a subduction earthquake in this part of Makran. In fact, there are only records of one candidate quake from 1483 – and the actual location of this is disputed. But it’s important to keep in mind that just because we haven’t seen an earthquake doesn’t mean that there couldn’t be one – particularly since the intervals between earthquakes are often hundreds or thousands of years. Historically, not many people have lived in the remote Iranian Makran, a desert which killed Alexander the Great’s army. So earthquakes might simply not have been documented.
We used new data to look for tell-tale signs of a possible earthquake. Imagine a piece of paper on a table. If you hold one end and push the other end towards it, the paper crumples up and the distance between the two ends gets shorter. If you let go, the paper flattens out. The fixed end is like a megathrust which is stuck. Indeed, if the Arabian plate is stuck, and stress is building up, southern Iran will be squeezed and shortened. We can look for evidence of this shortening by using a more accurate version of the GPS systems found in smartphones. My coauthors from the National Cartographic Centre in Iran have set up a network of GPS stations to measure how fast different parts of Iran are moving relative to Arabia.
We found that the velocities fit with Iran being shortened near the coast, suggesting that stress is indeed building up – and meaning there could be a large subduction earthquake in the future. This fits with recent work looking at large boulders along the coast of Oman, thought to have been deposited by tsunamis. The locations of these boulders suggest that the tsunami which brought them there would need to have come from a subduction earthquake, either in western Makran or along the entire subduction zone – including Pakistan. These boulders were probably deposited in the last 5,000 years, but we can’t know for sure.

This is a hazard that people need to be aware of, particularly those living in coastal regions around the Arabian Sea. Rapid urbanisation along the Omani and Pakistani coasts in recent years has increased the population exposed to earthquakes and tsunamis in the Makran. Karachi, at the eastern end of the subduction zone, is now a megacity and home to around 25m people. Much of Muscat, the Omani capital, is less than 10 metres above sea level, making it vulnerable to tsunamis. The port of Gwadar in Pakistan, which was badly damaged in a 1945 earthquake, is also undergoing massive development.
To help protect these people, and make sure that they are properly prepared, we need to understand this hazard better. Education and early warning are both key – exercises testing the Indian Ocean Tsunami Warning System are a step in the right direction, especially if they engage the public.
At the moment, we can only say that a large earthquake in the Makran is consistent with the limited data which we have available. By continuing to work with scientists in Iran and Pakistan to make more measurements I hope that in the future we will have a much better idea of what to expect from this subduction zone.
Camilla Penney, PhD Candidate in Geophysics, University of Cambridge
This article was originally published on The Conversation. Read the original article.
Turkmenistan hosts one of the most spectacular faults in Central Asia. The Ashgabat Fault is a more than 300 km long strike-slip feature with a significant vertical component of motion and a remarkable expression in the landscape. Ashgabat, Turkmenistan’s capital, is located at the foothills of this fault and was heavily damaged by a strong earthquake in 1948. Little is known about the tectonic background of this earthquake and whether it occurred on the main fault or on another tectonic structure. For various reasons, we also do not know much about the slip rate of the Ashgabat Fault and its earthquake history. With more information we would better understand the seismic hazard for Ashgabat and how the regional tectonics work. An EwF team has conducted some preliminary field work in late 2016 to reveal some of the fault’s secrets and to gather data for future detailed field studies.
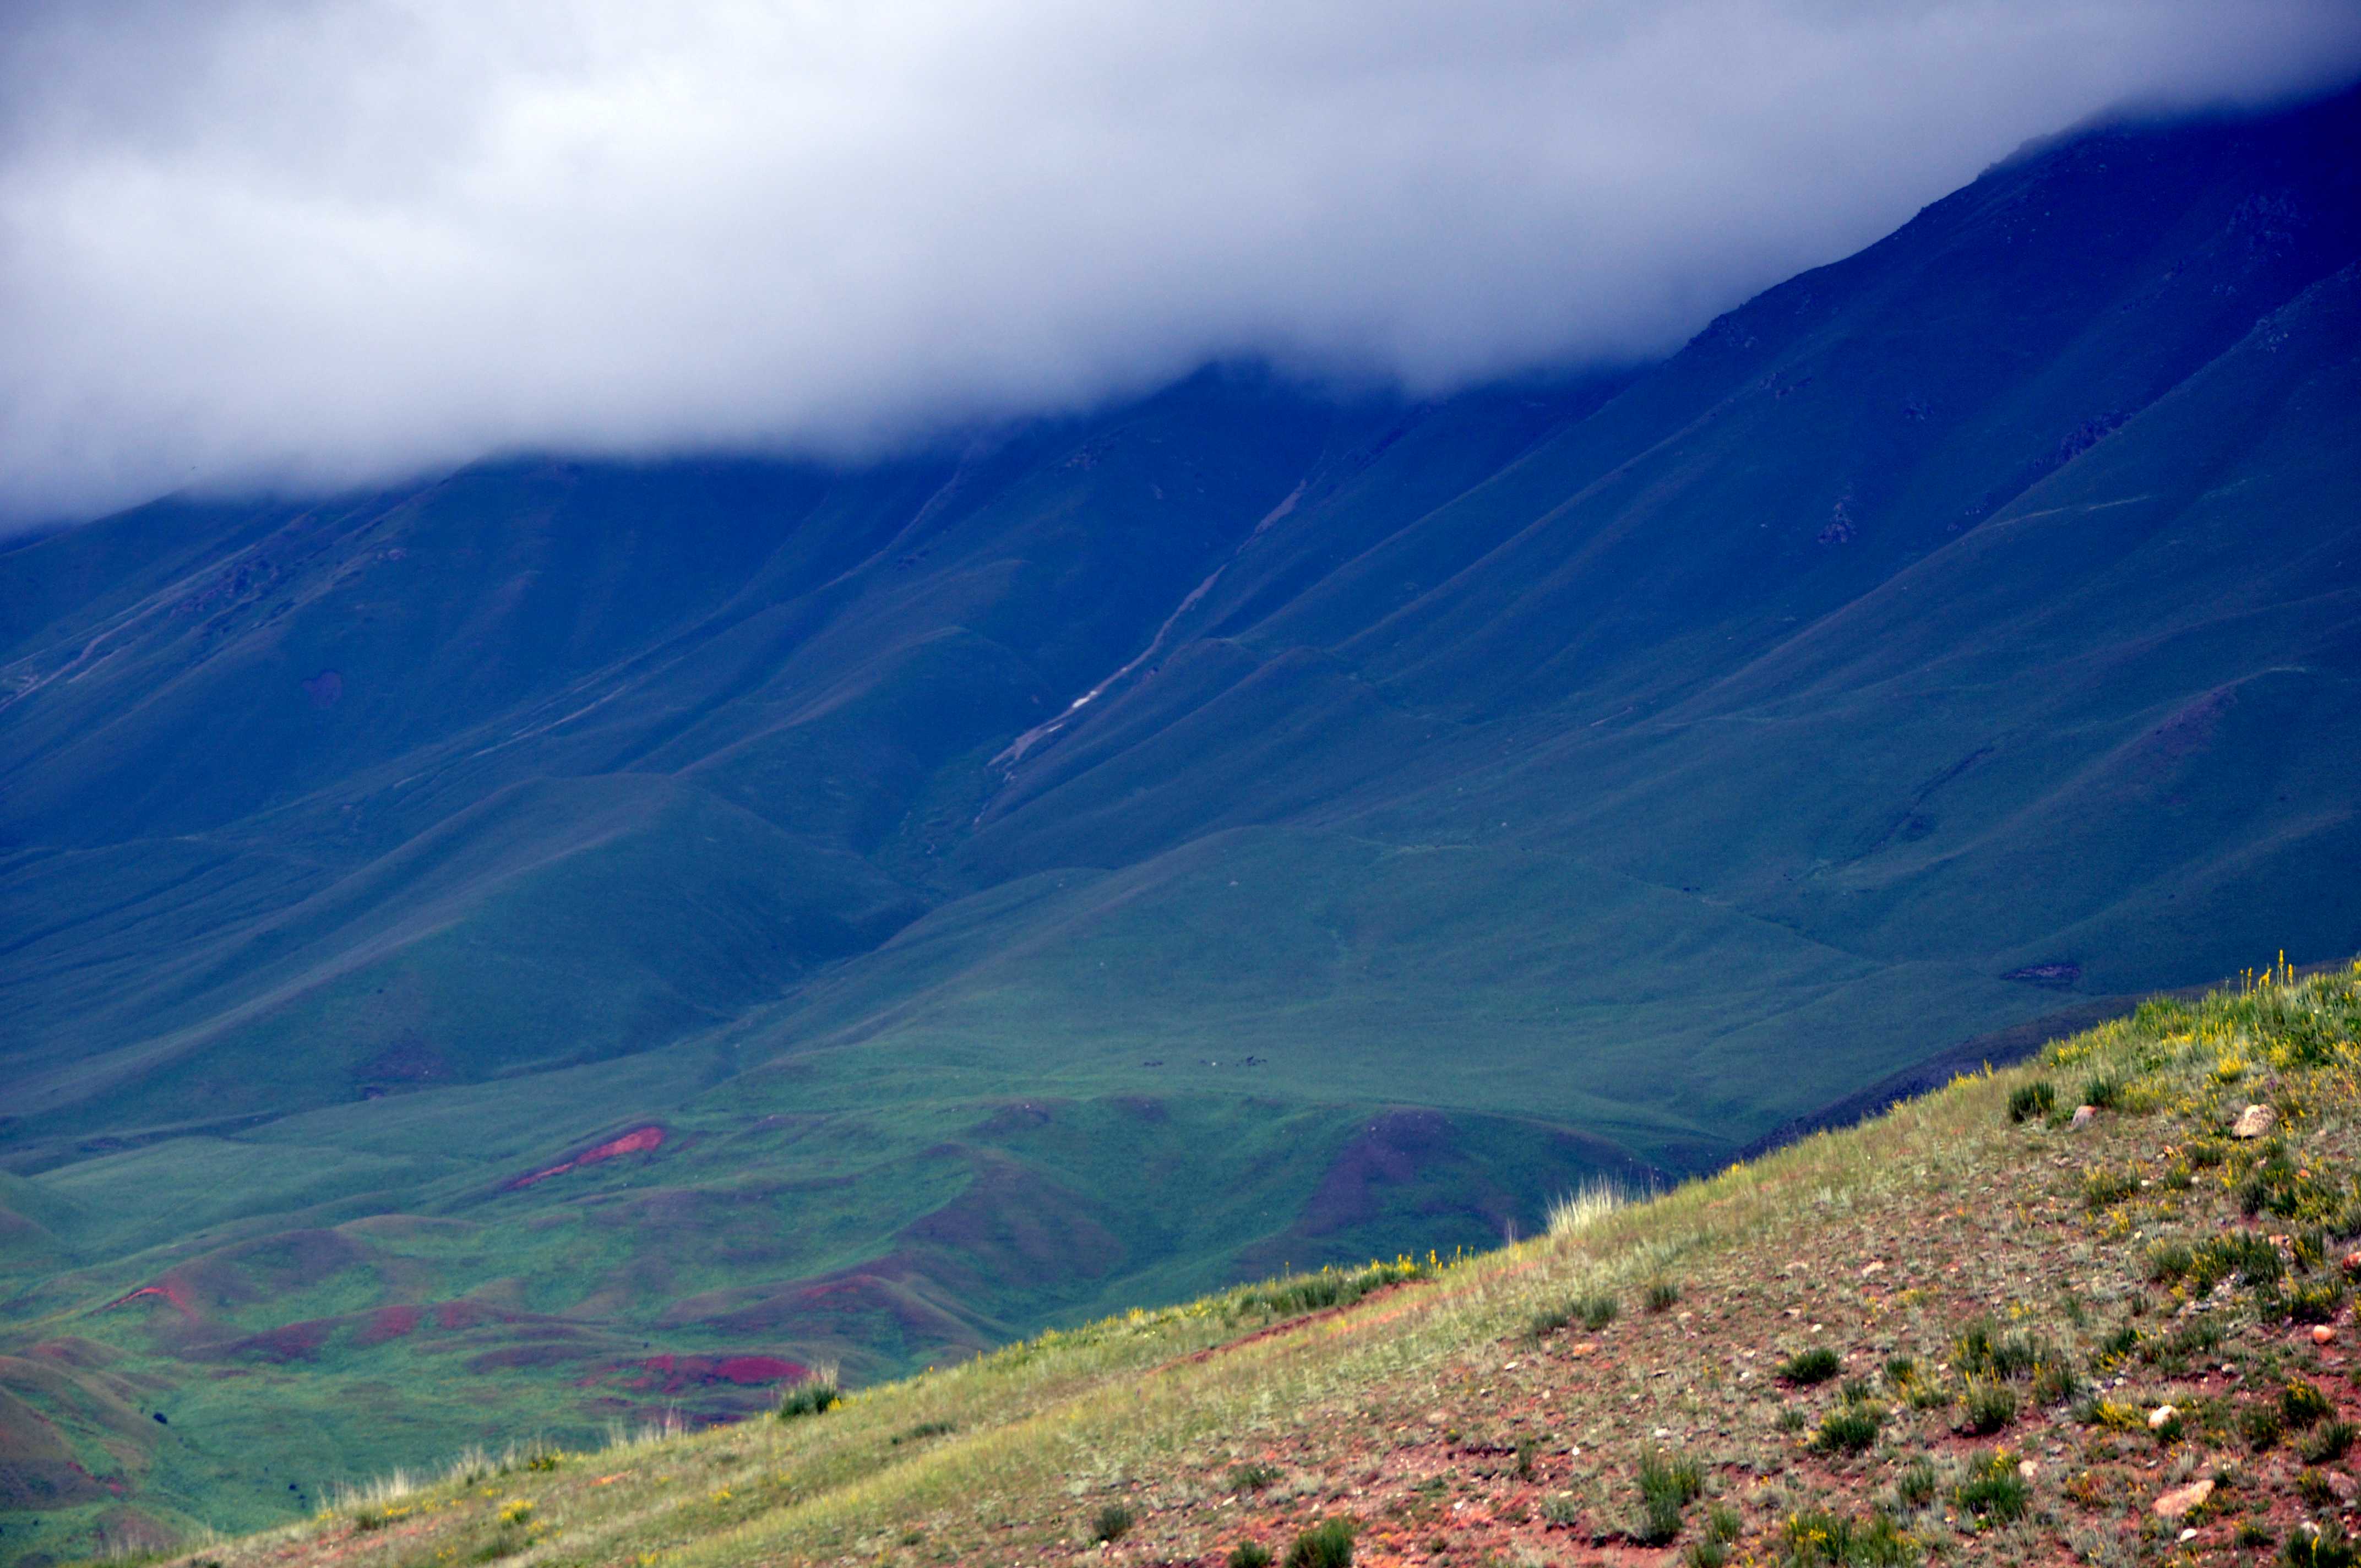
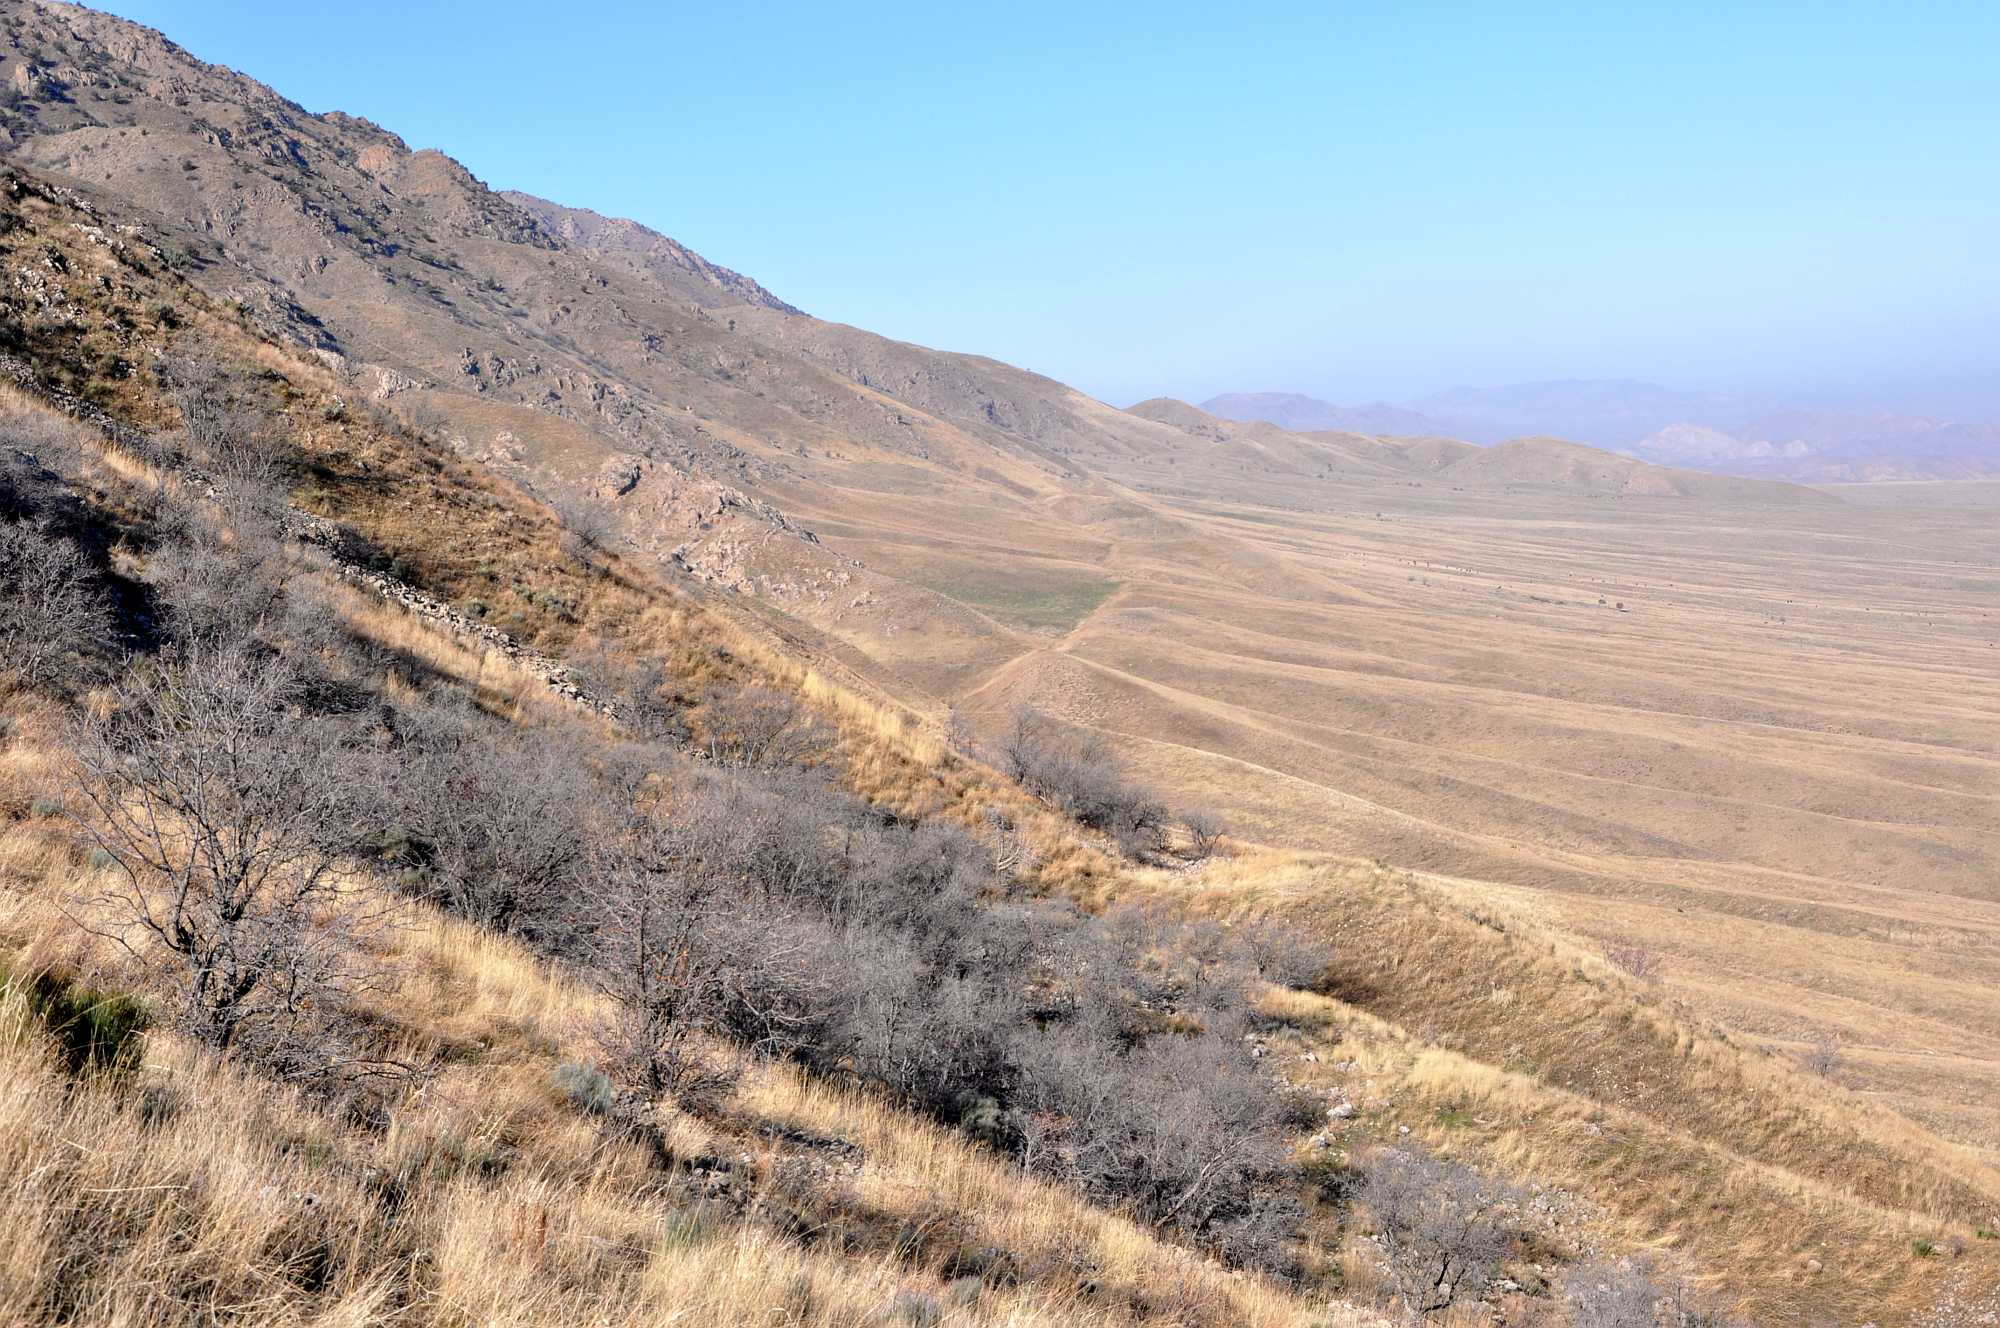
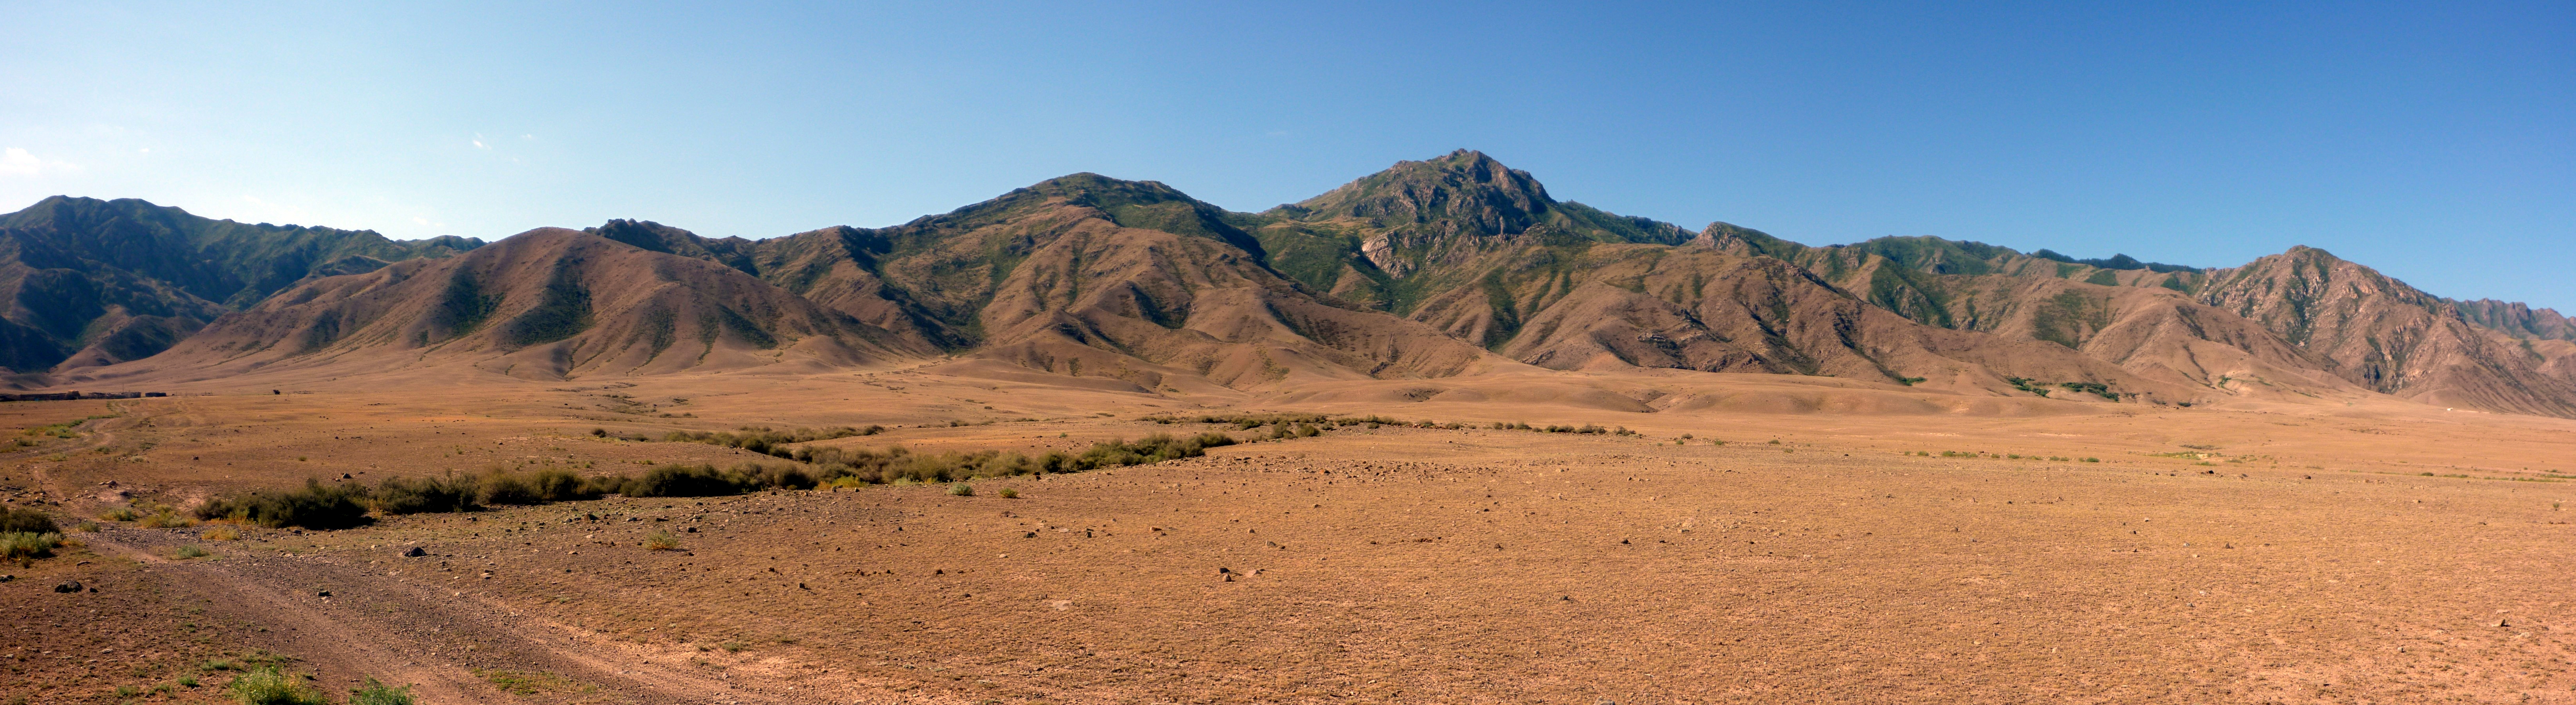
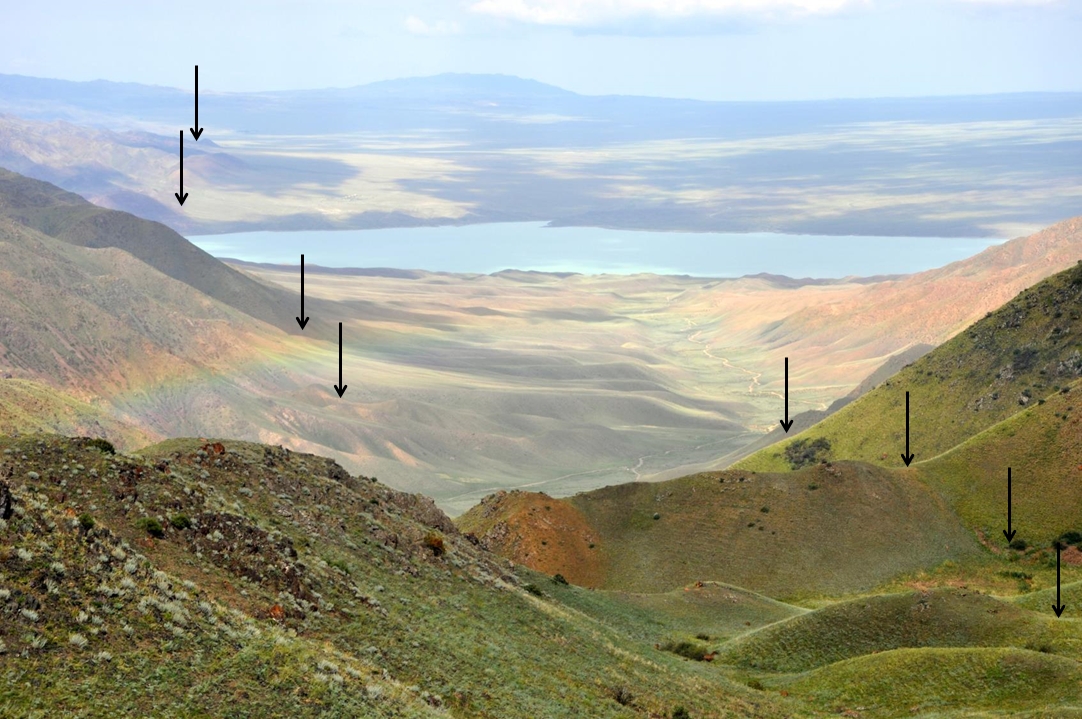
Panoramic view of the mountain front.
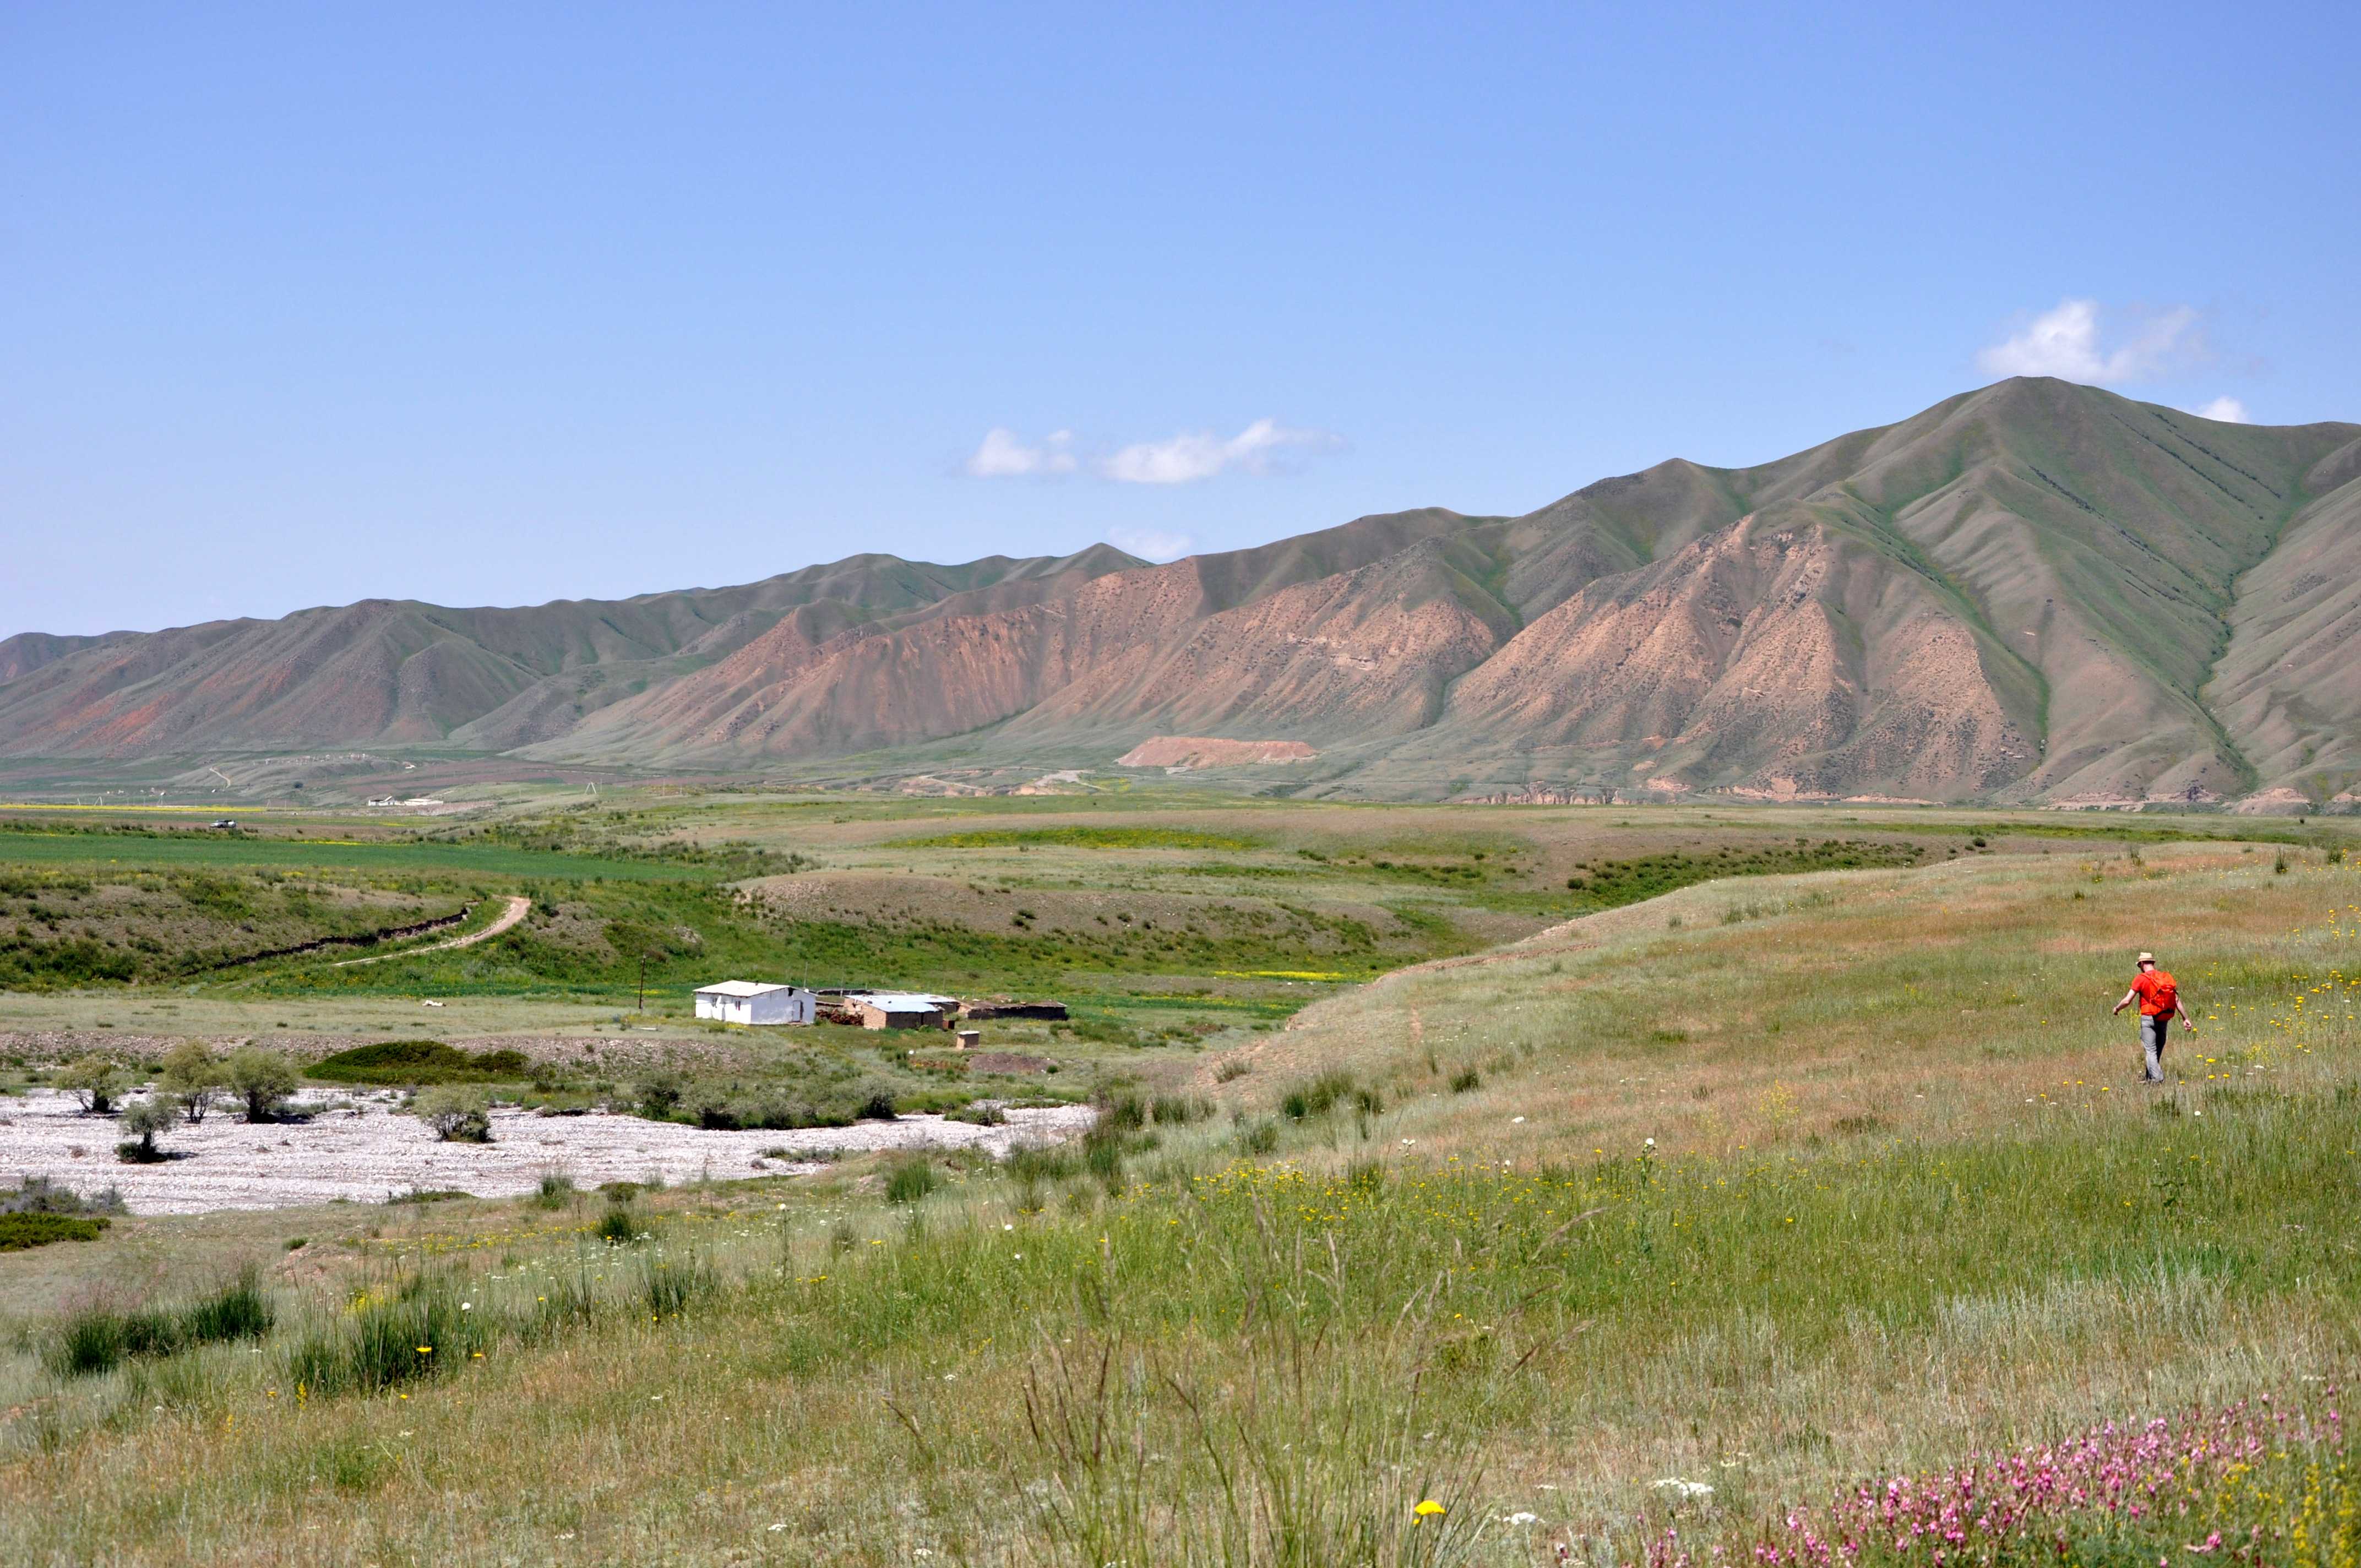
The Ashgabat Fault.

Walking along the fault scarp.
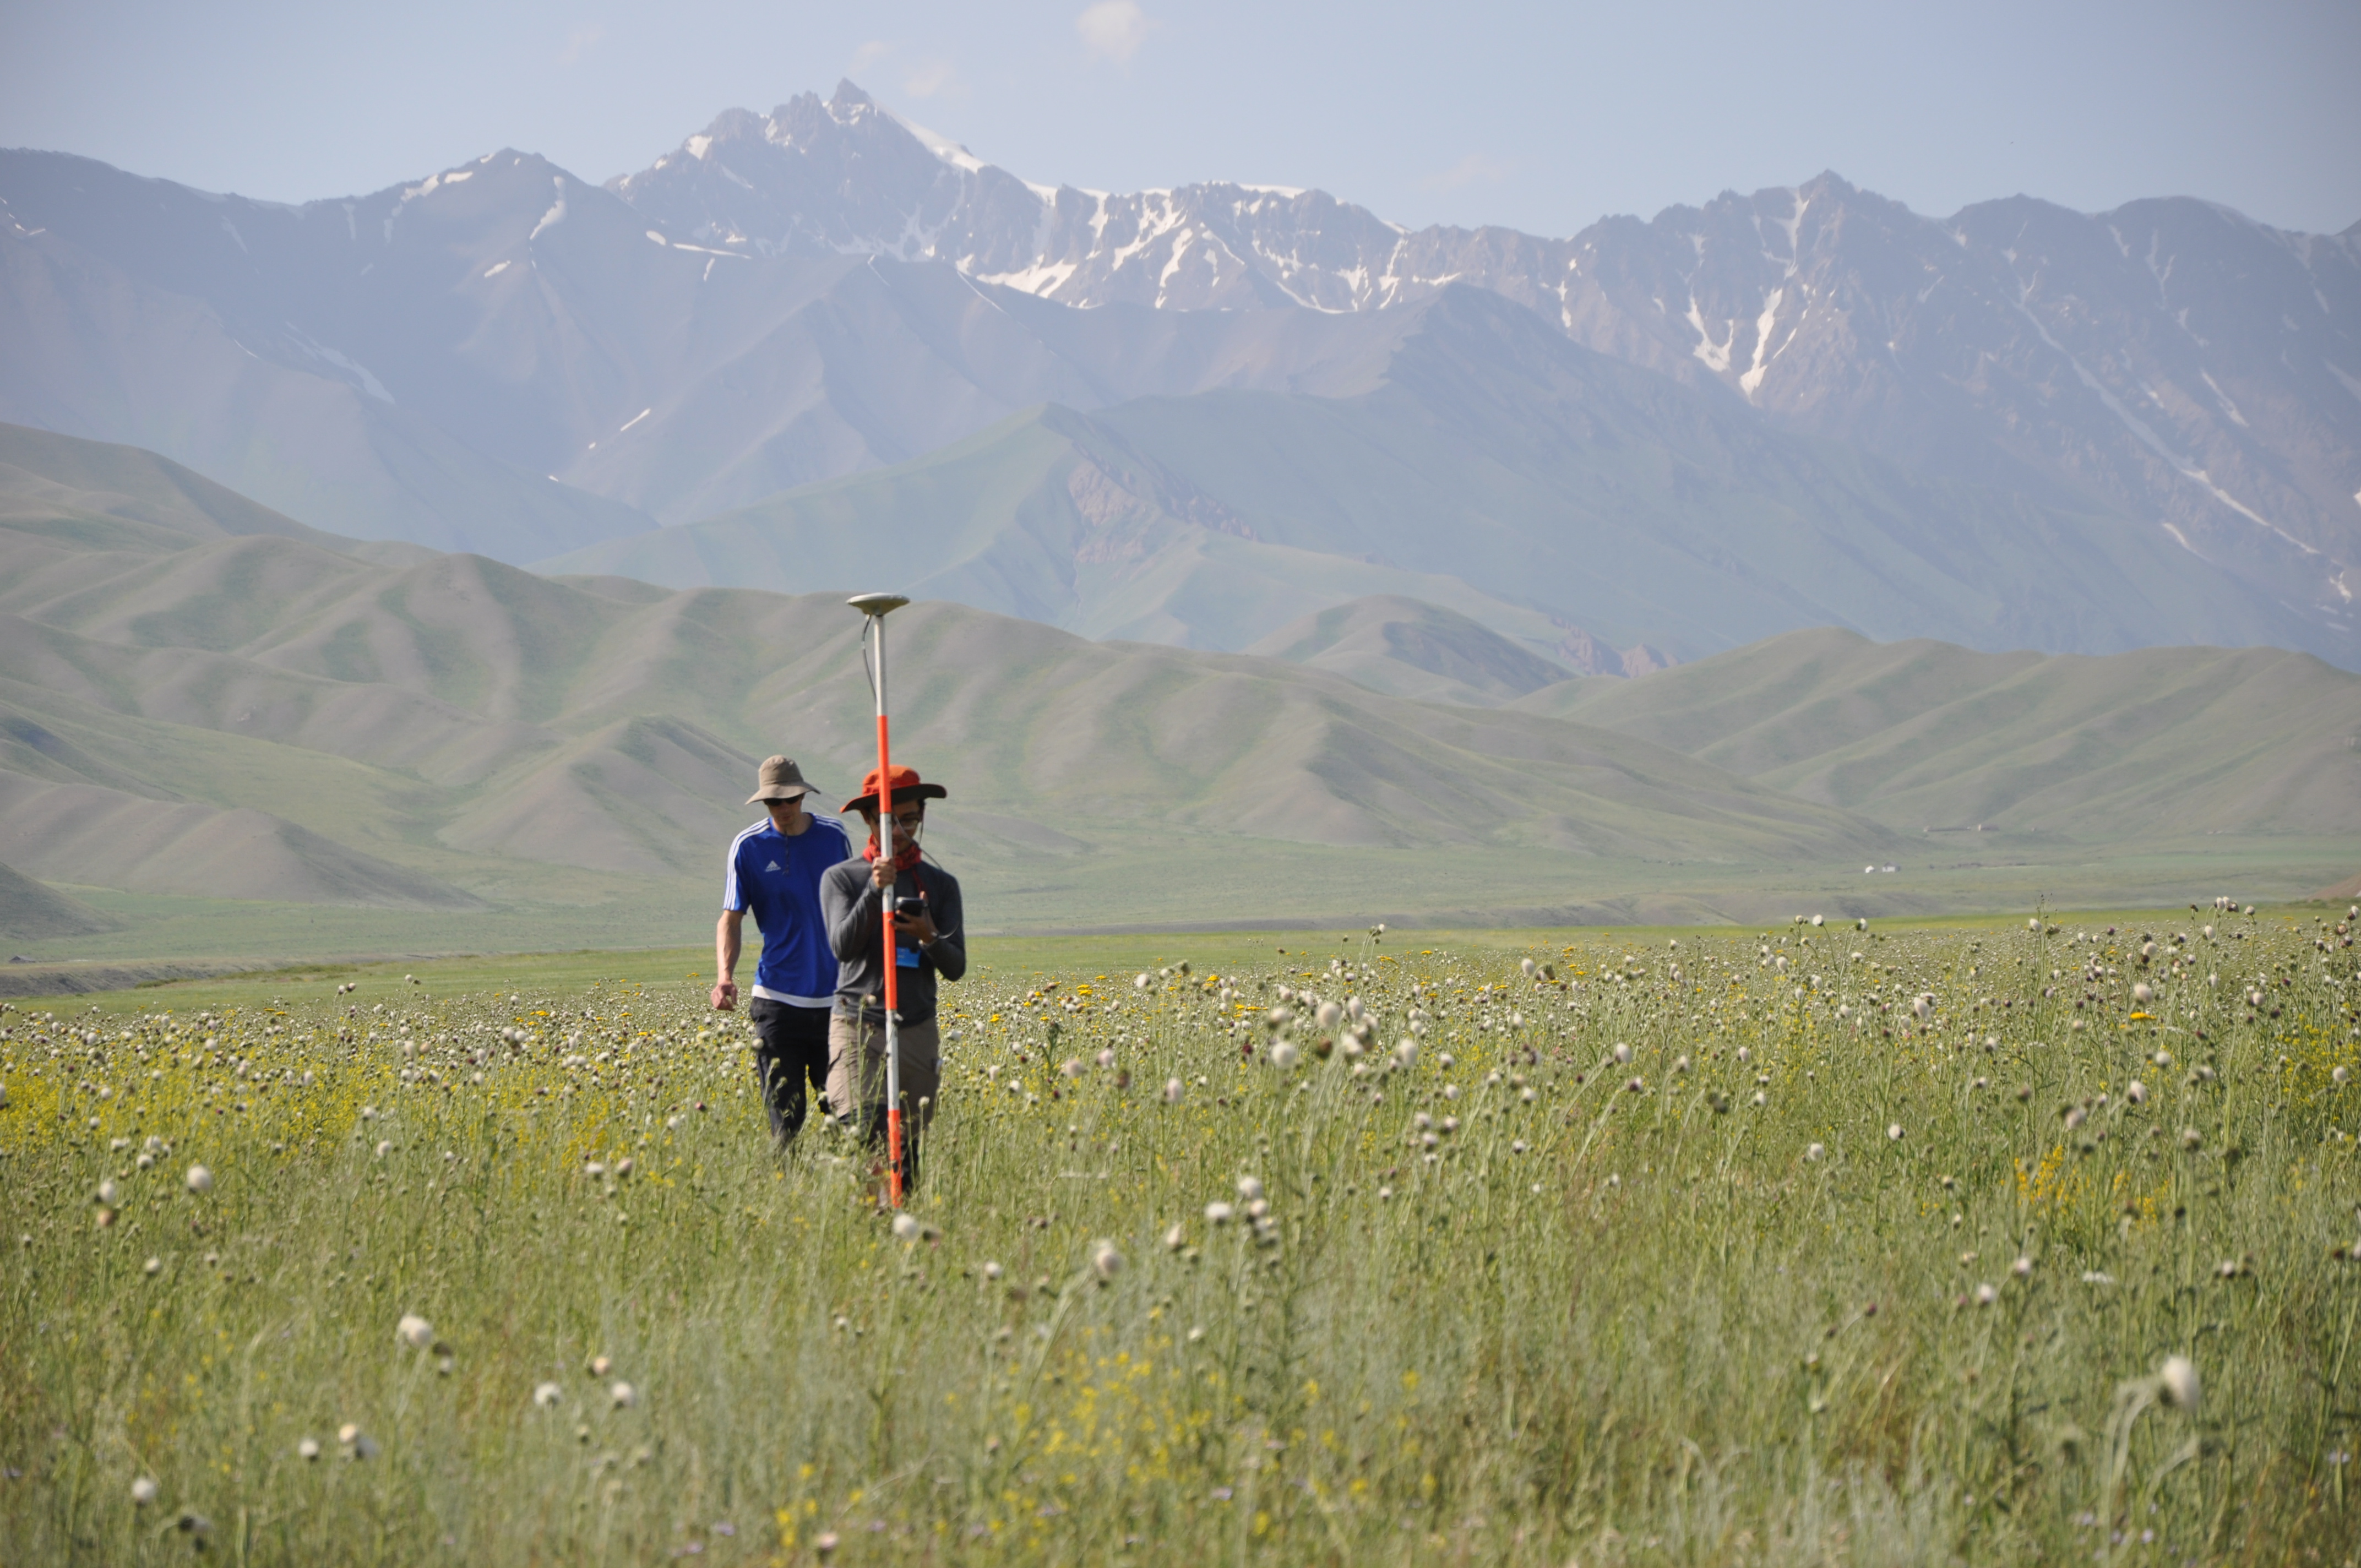
We focussed on those parts of the Ashgabat Fault that exhibit hints for strong past earthquakes in the landscape. At several locations we visited offset morphological features such as deflected streams and displaced alluvial fans. They can tell us about the cumulative amount of offset that happened in the recent geological past. We measured the offsets with differential-GPS and produced high-resolution topographic data sets to reveal even subtle tectonic deformation.
Digging a pit across the fault scarp.
Offset streams show right-lateral displacement.
In order to calculate a fault slip rate we need to know the age of the deformed landforms. We dug pits into alluvial fans and river terraces to take samples for optical stimulated luminescence dating. This technique is used to measure for how long a sample has been shielded from sunlight. In our case we wanted to find out when the sample had been deposited and consequently covered by younger sediment layers.
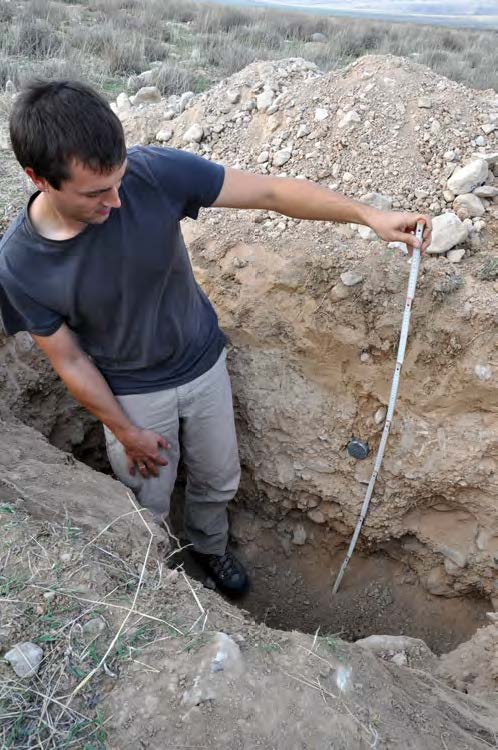
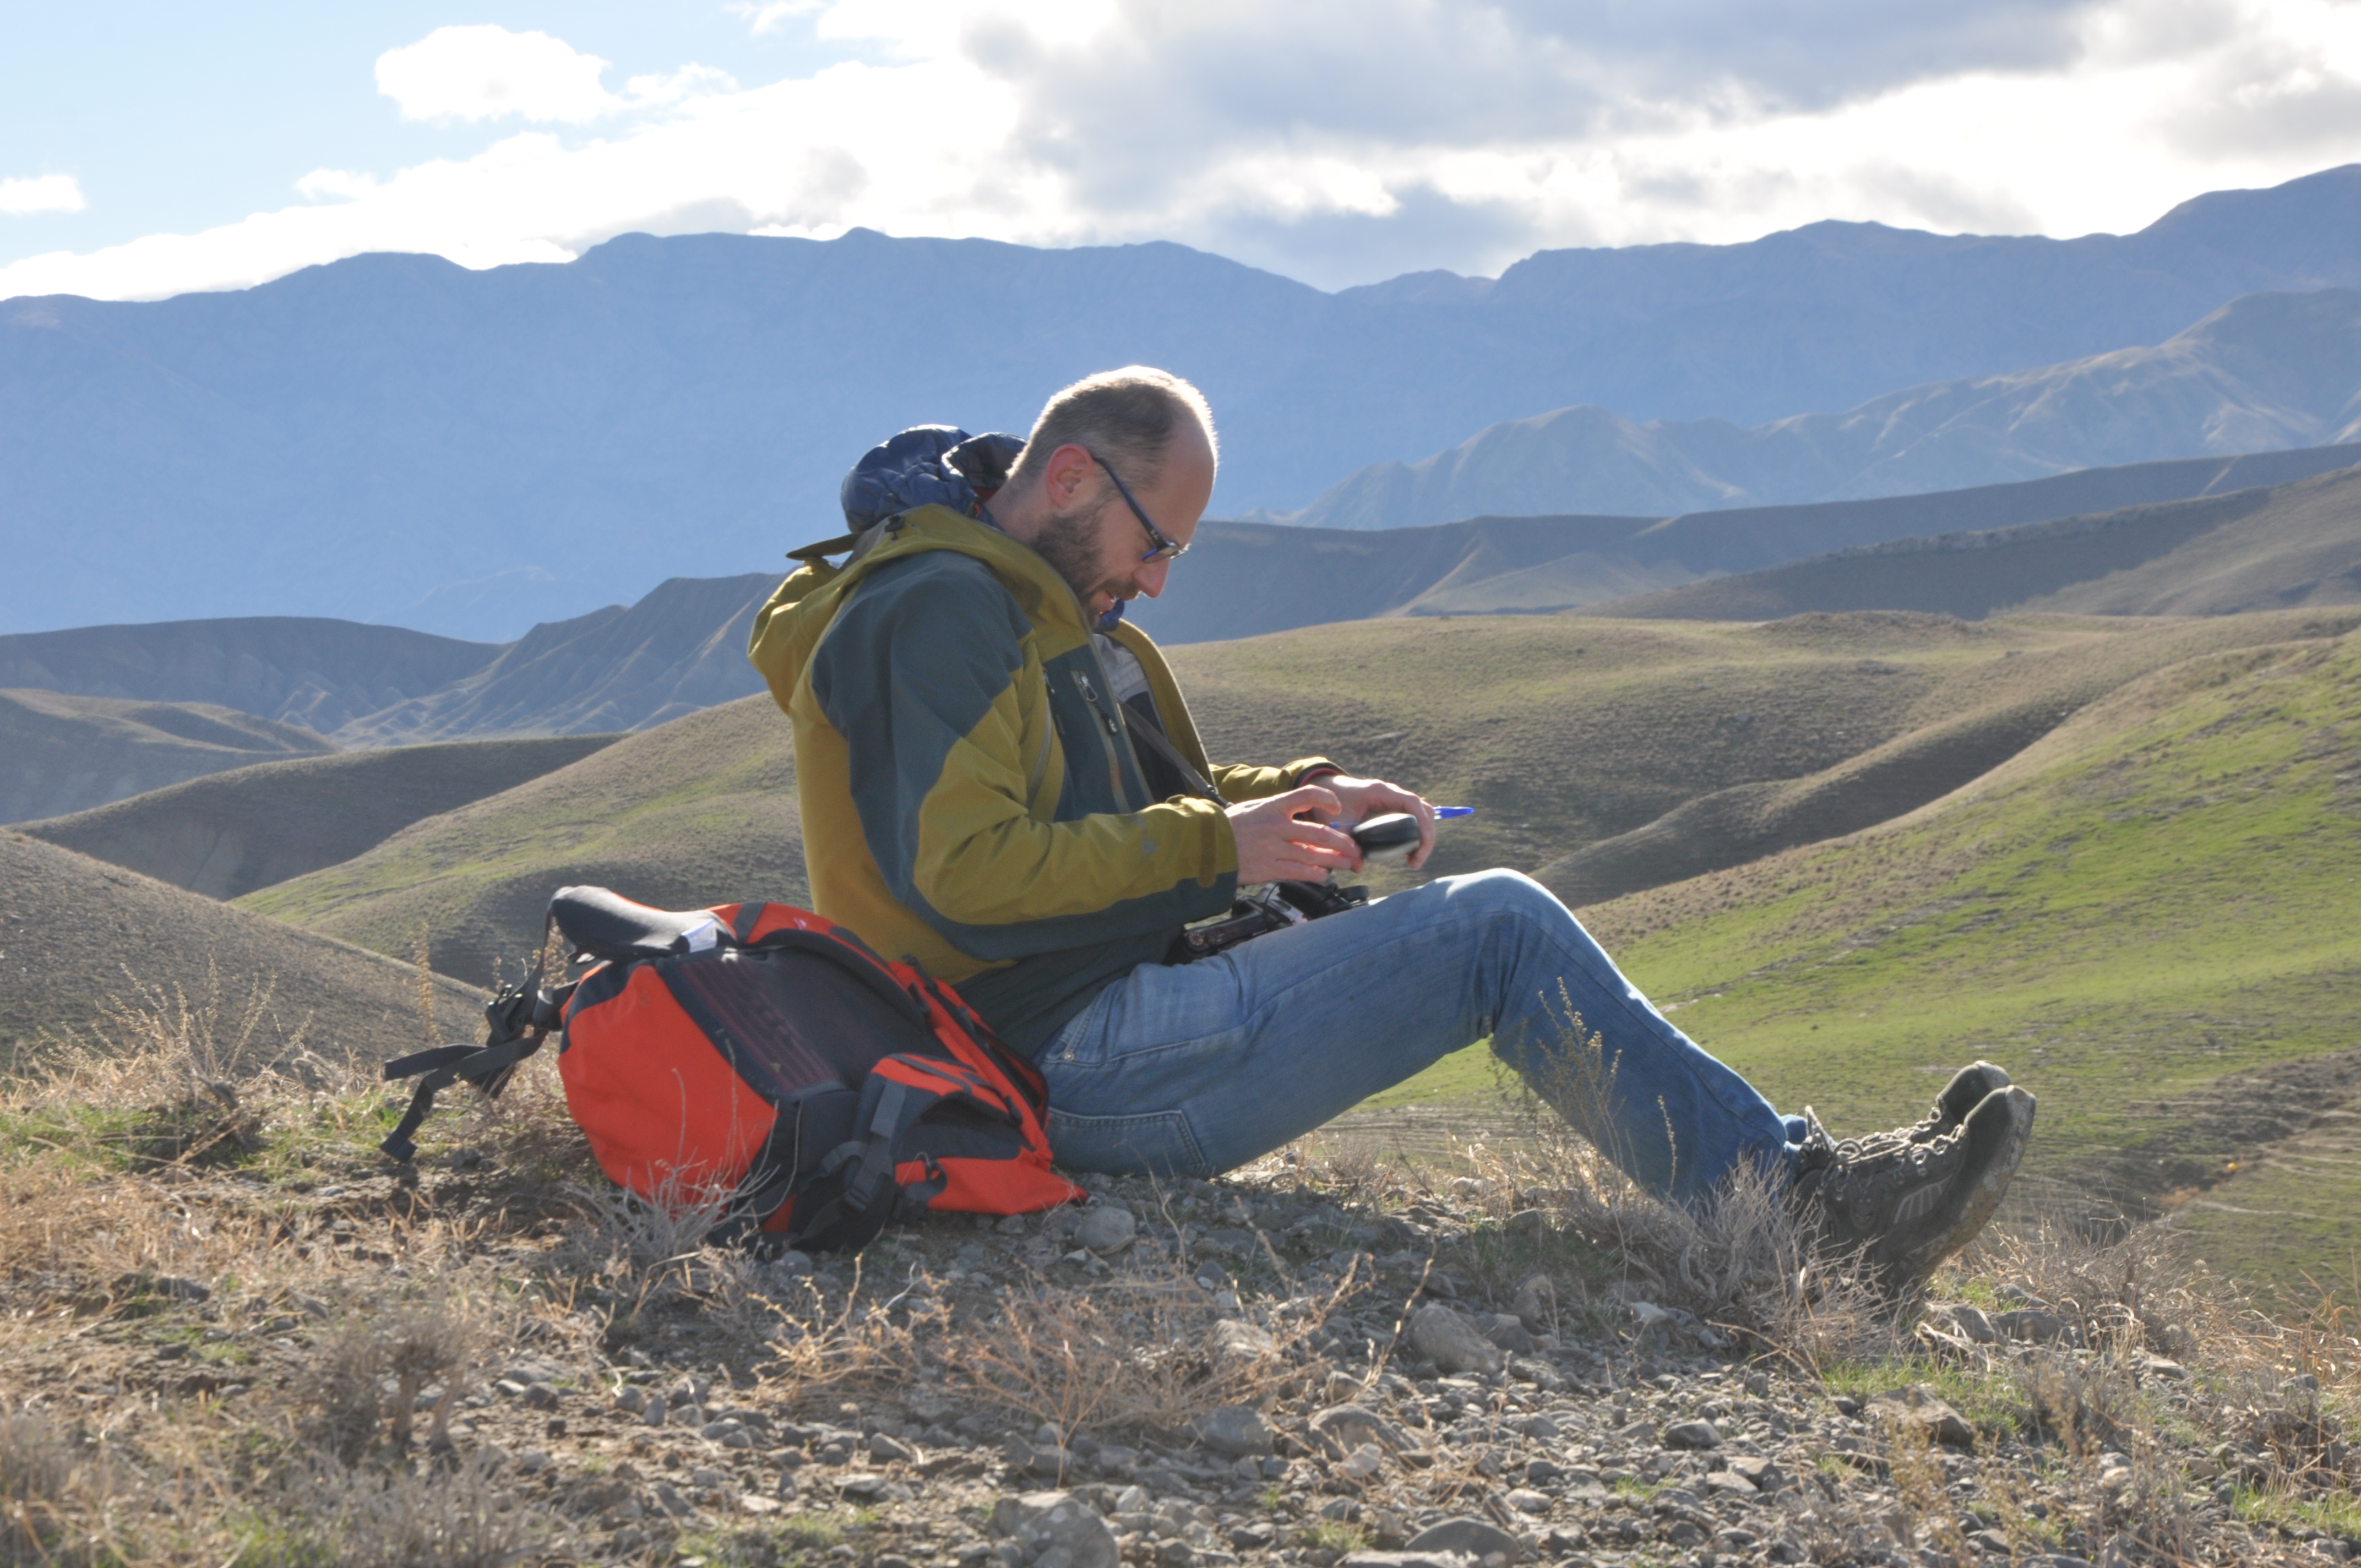
Christoph Grützner taking OSL samples in light-proof steel tubes.
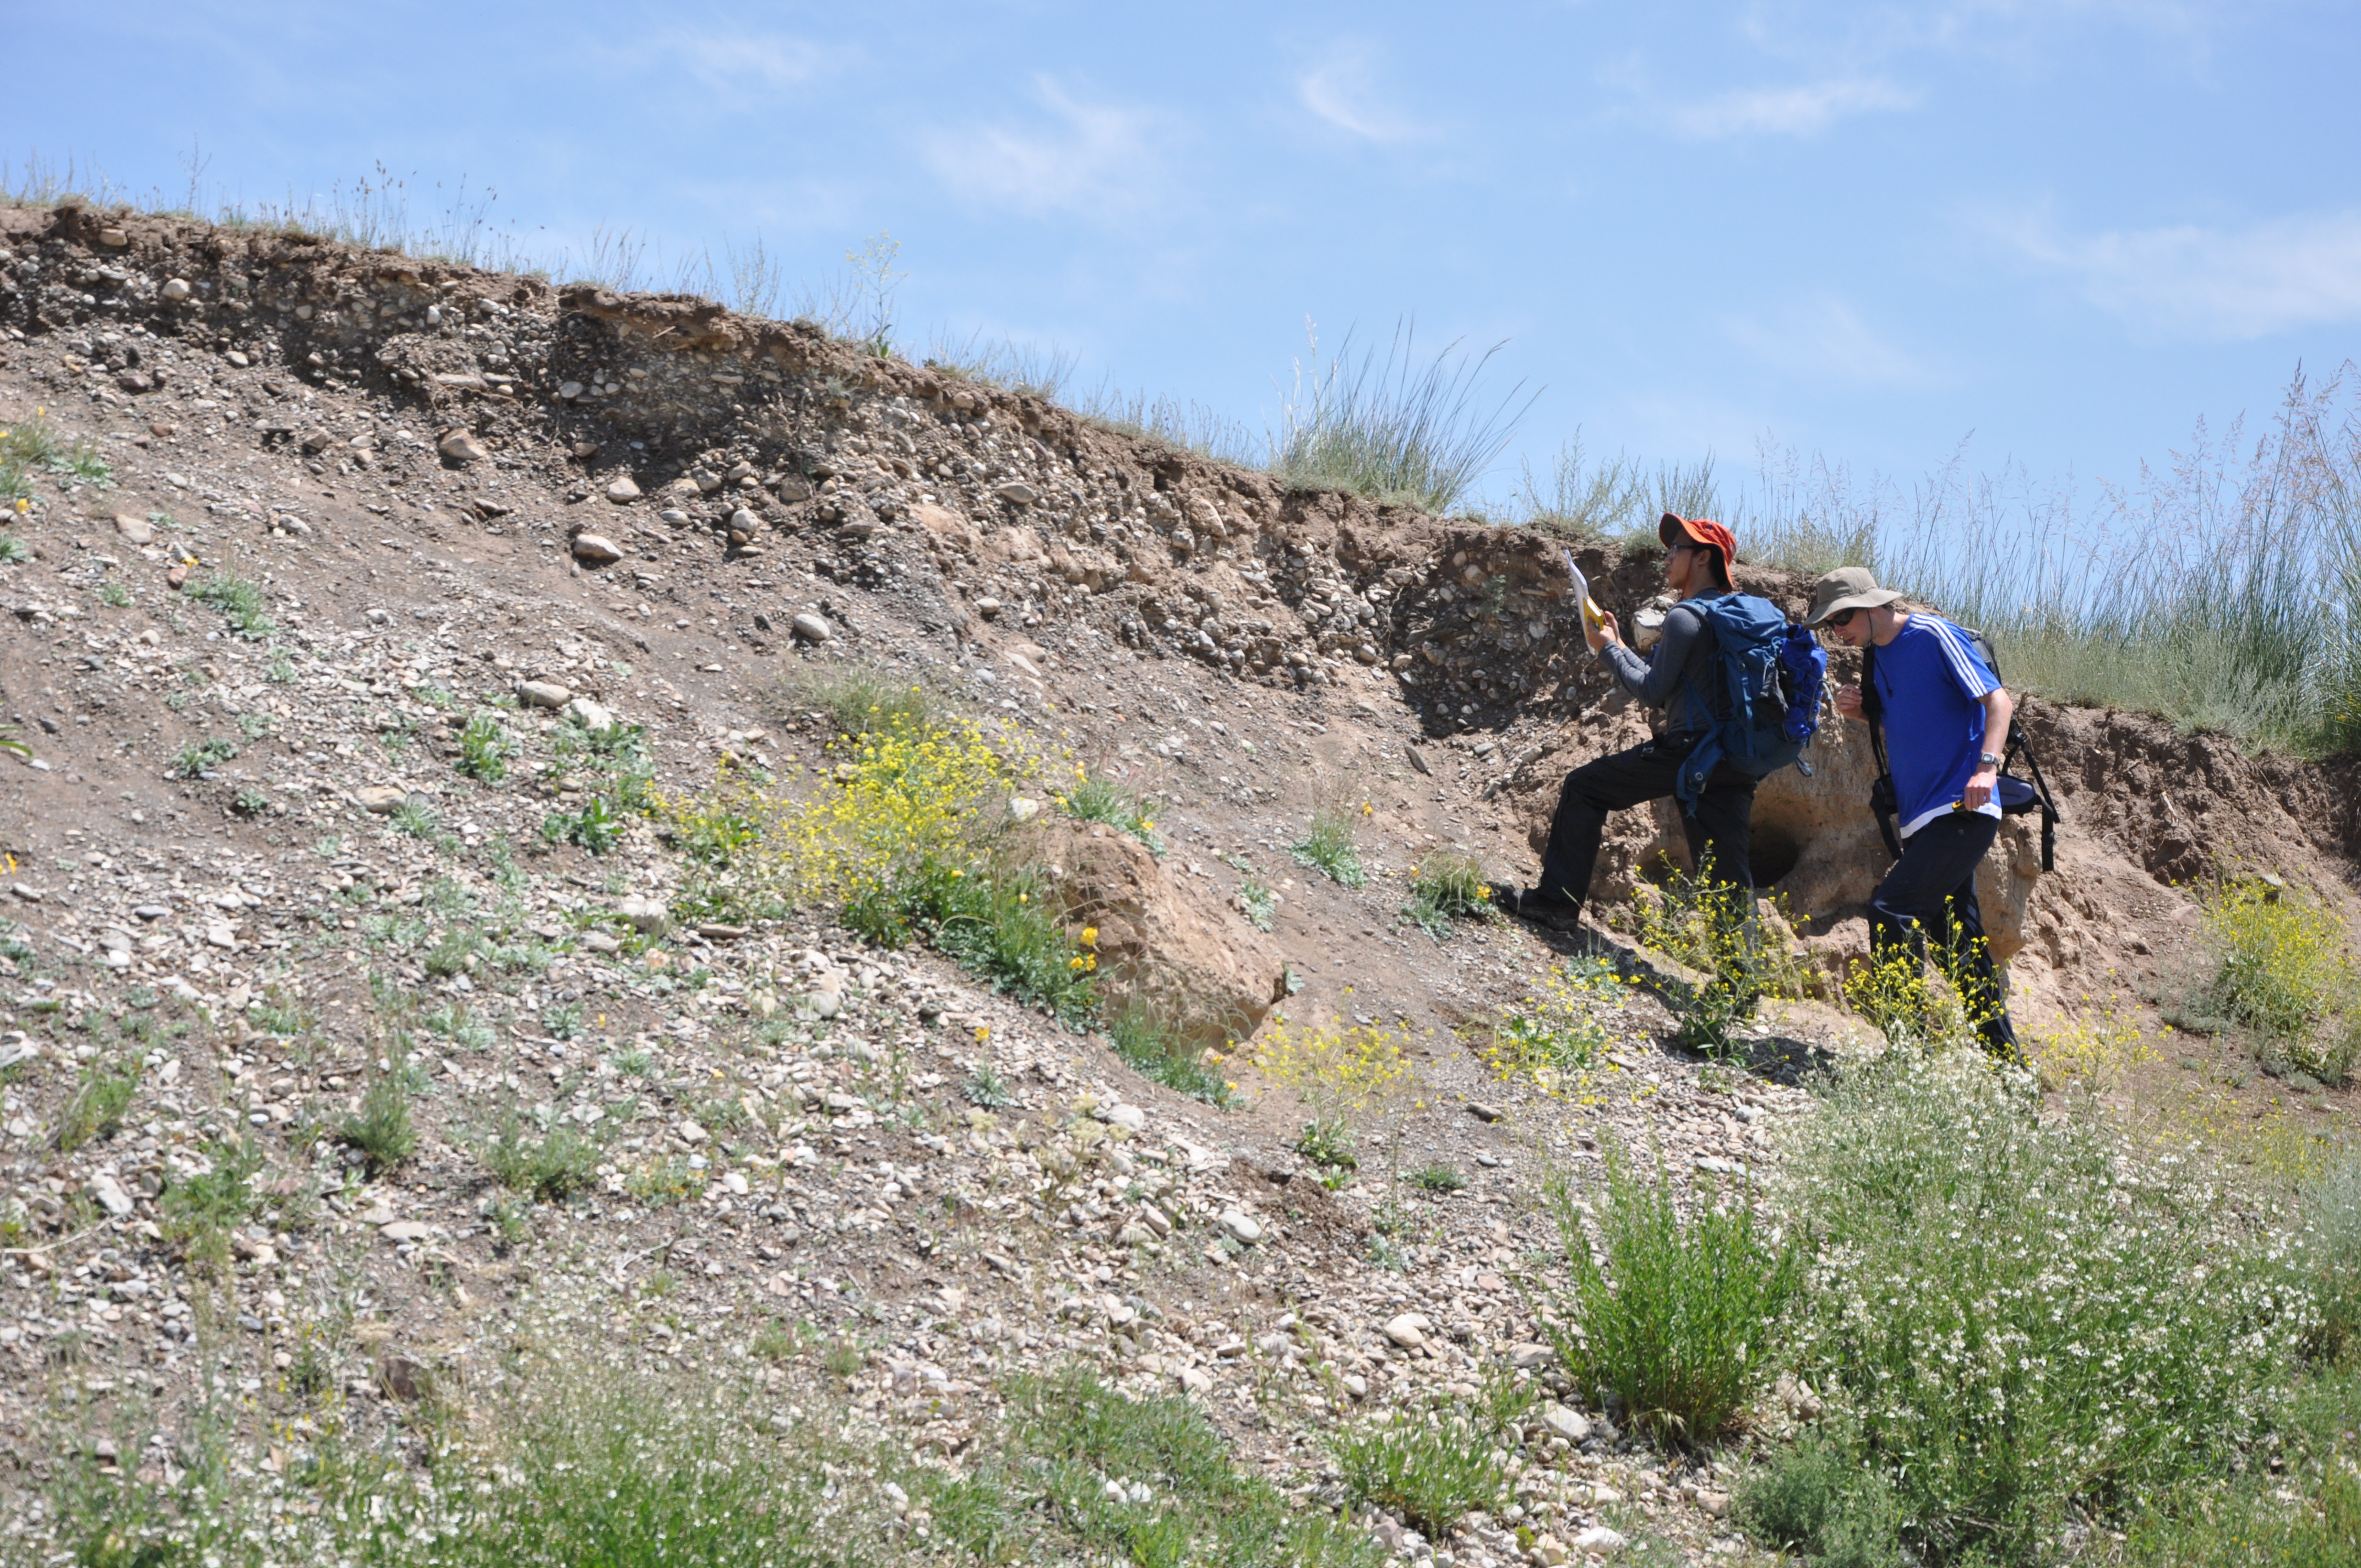
At one location we encountered a fault scarp that was probably produced by a strong, surface-rupturing earthquake. We excavated a pit across this scarp to have a close look at the deformed sediments and to take samples. Similar offsets were also found in a river bank.
Richard Walker taking notes in the field.

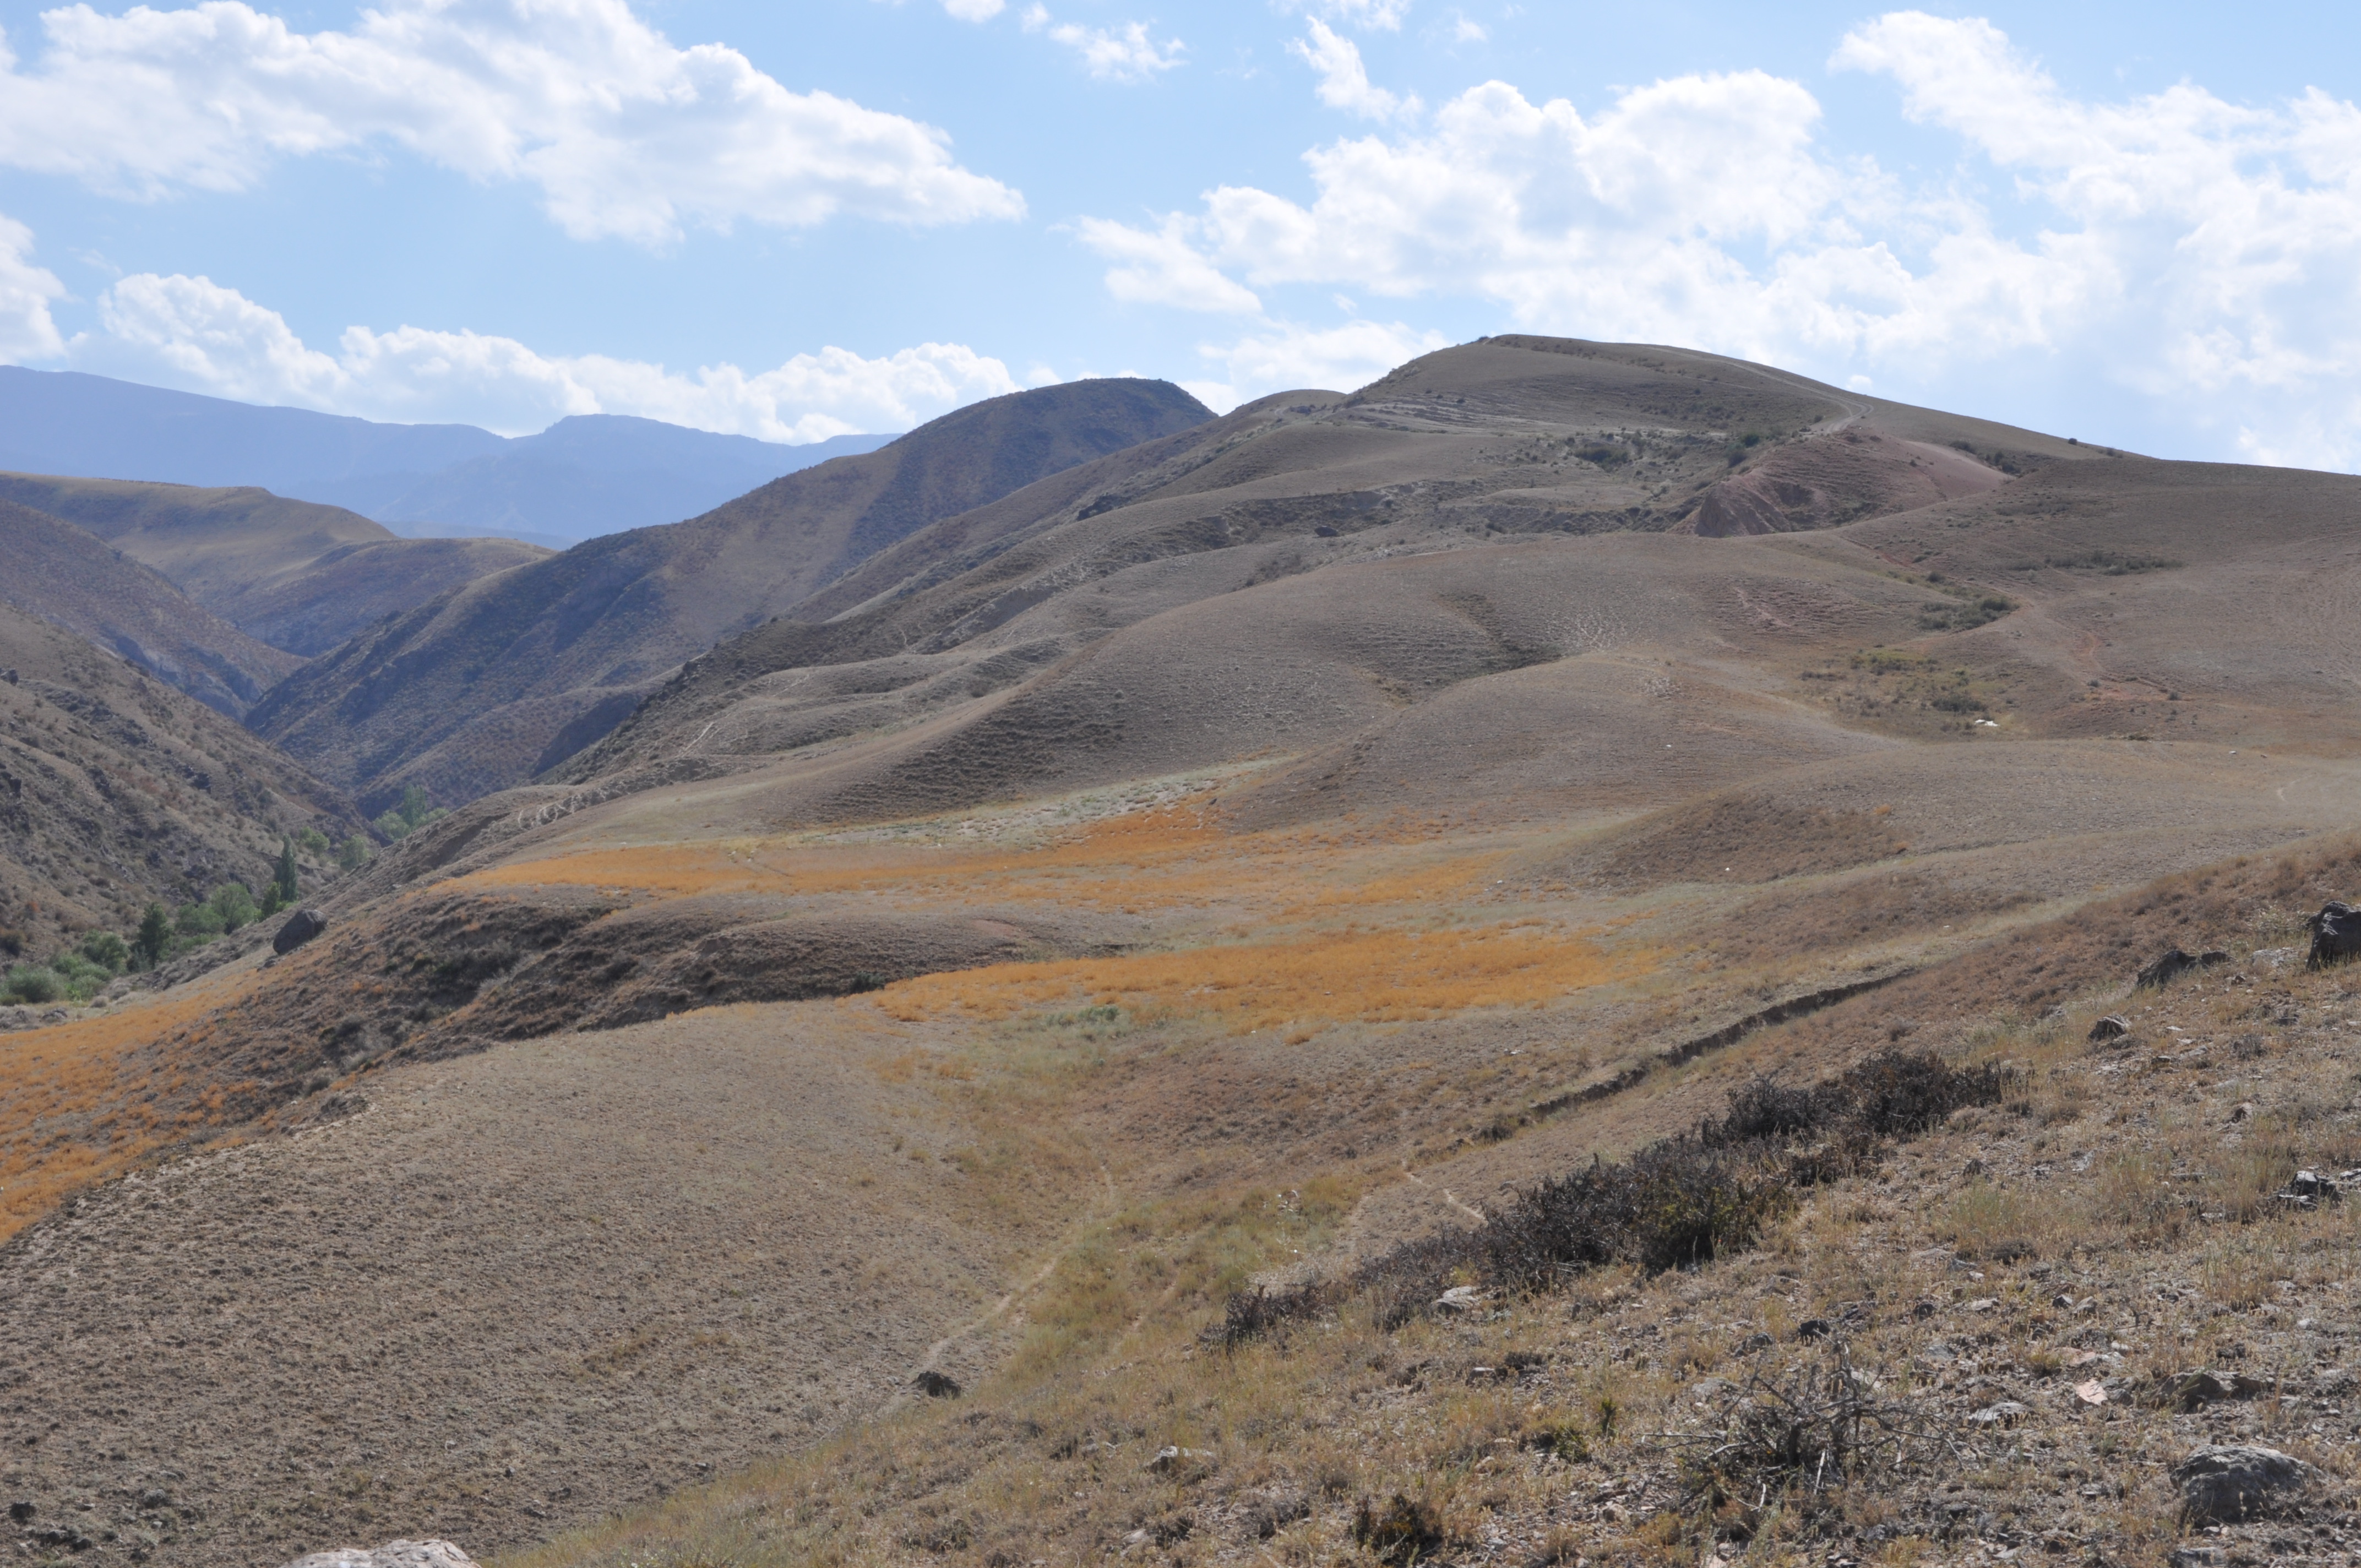
Beautiful mountains with almost no vegetation.
The field work was made possible by our colleagues from the Institute of Seismology, National Academy of Sciences of Turkmenistan. G. Begenjev, Y. Bezmenov, R. Mirzin, and M. Sadykov did not only organise all the logistics and led us to the most interesting sites, but also introduced the exquisite local cuisine. We experienced great hospitality and were amazed by the beauty of the landscape. Thank you very much!
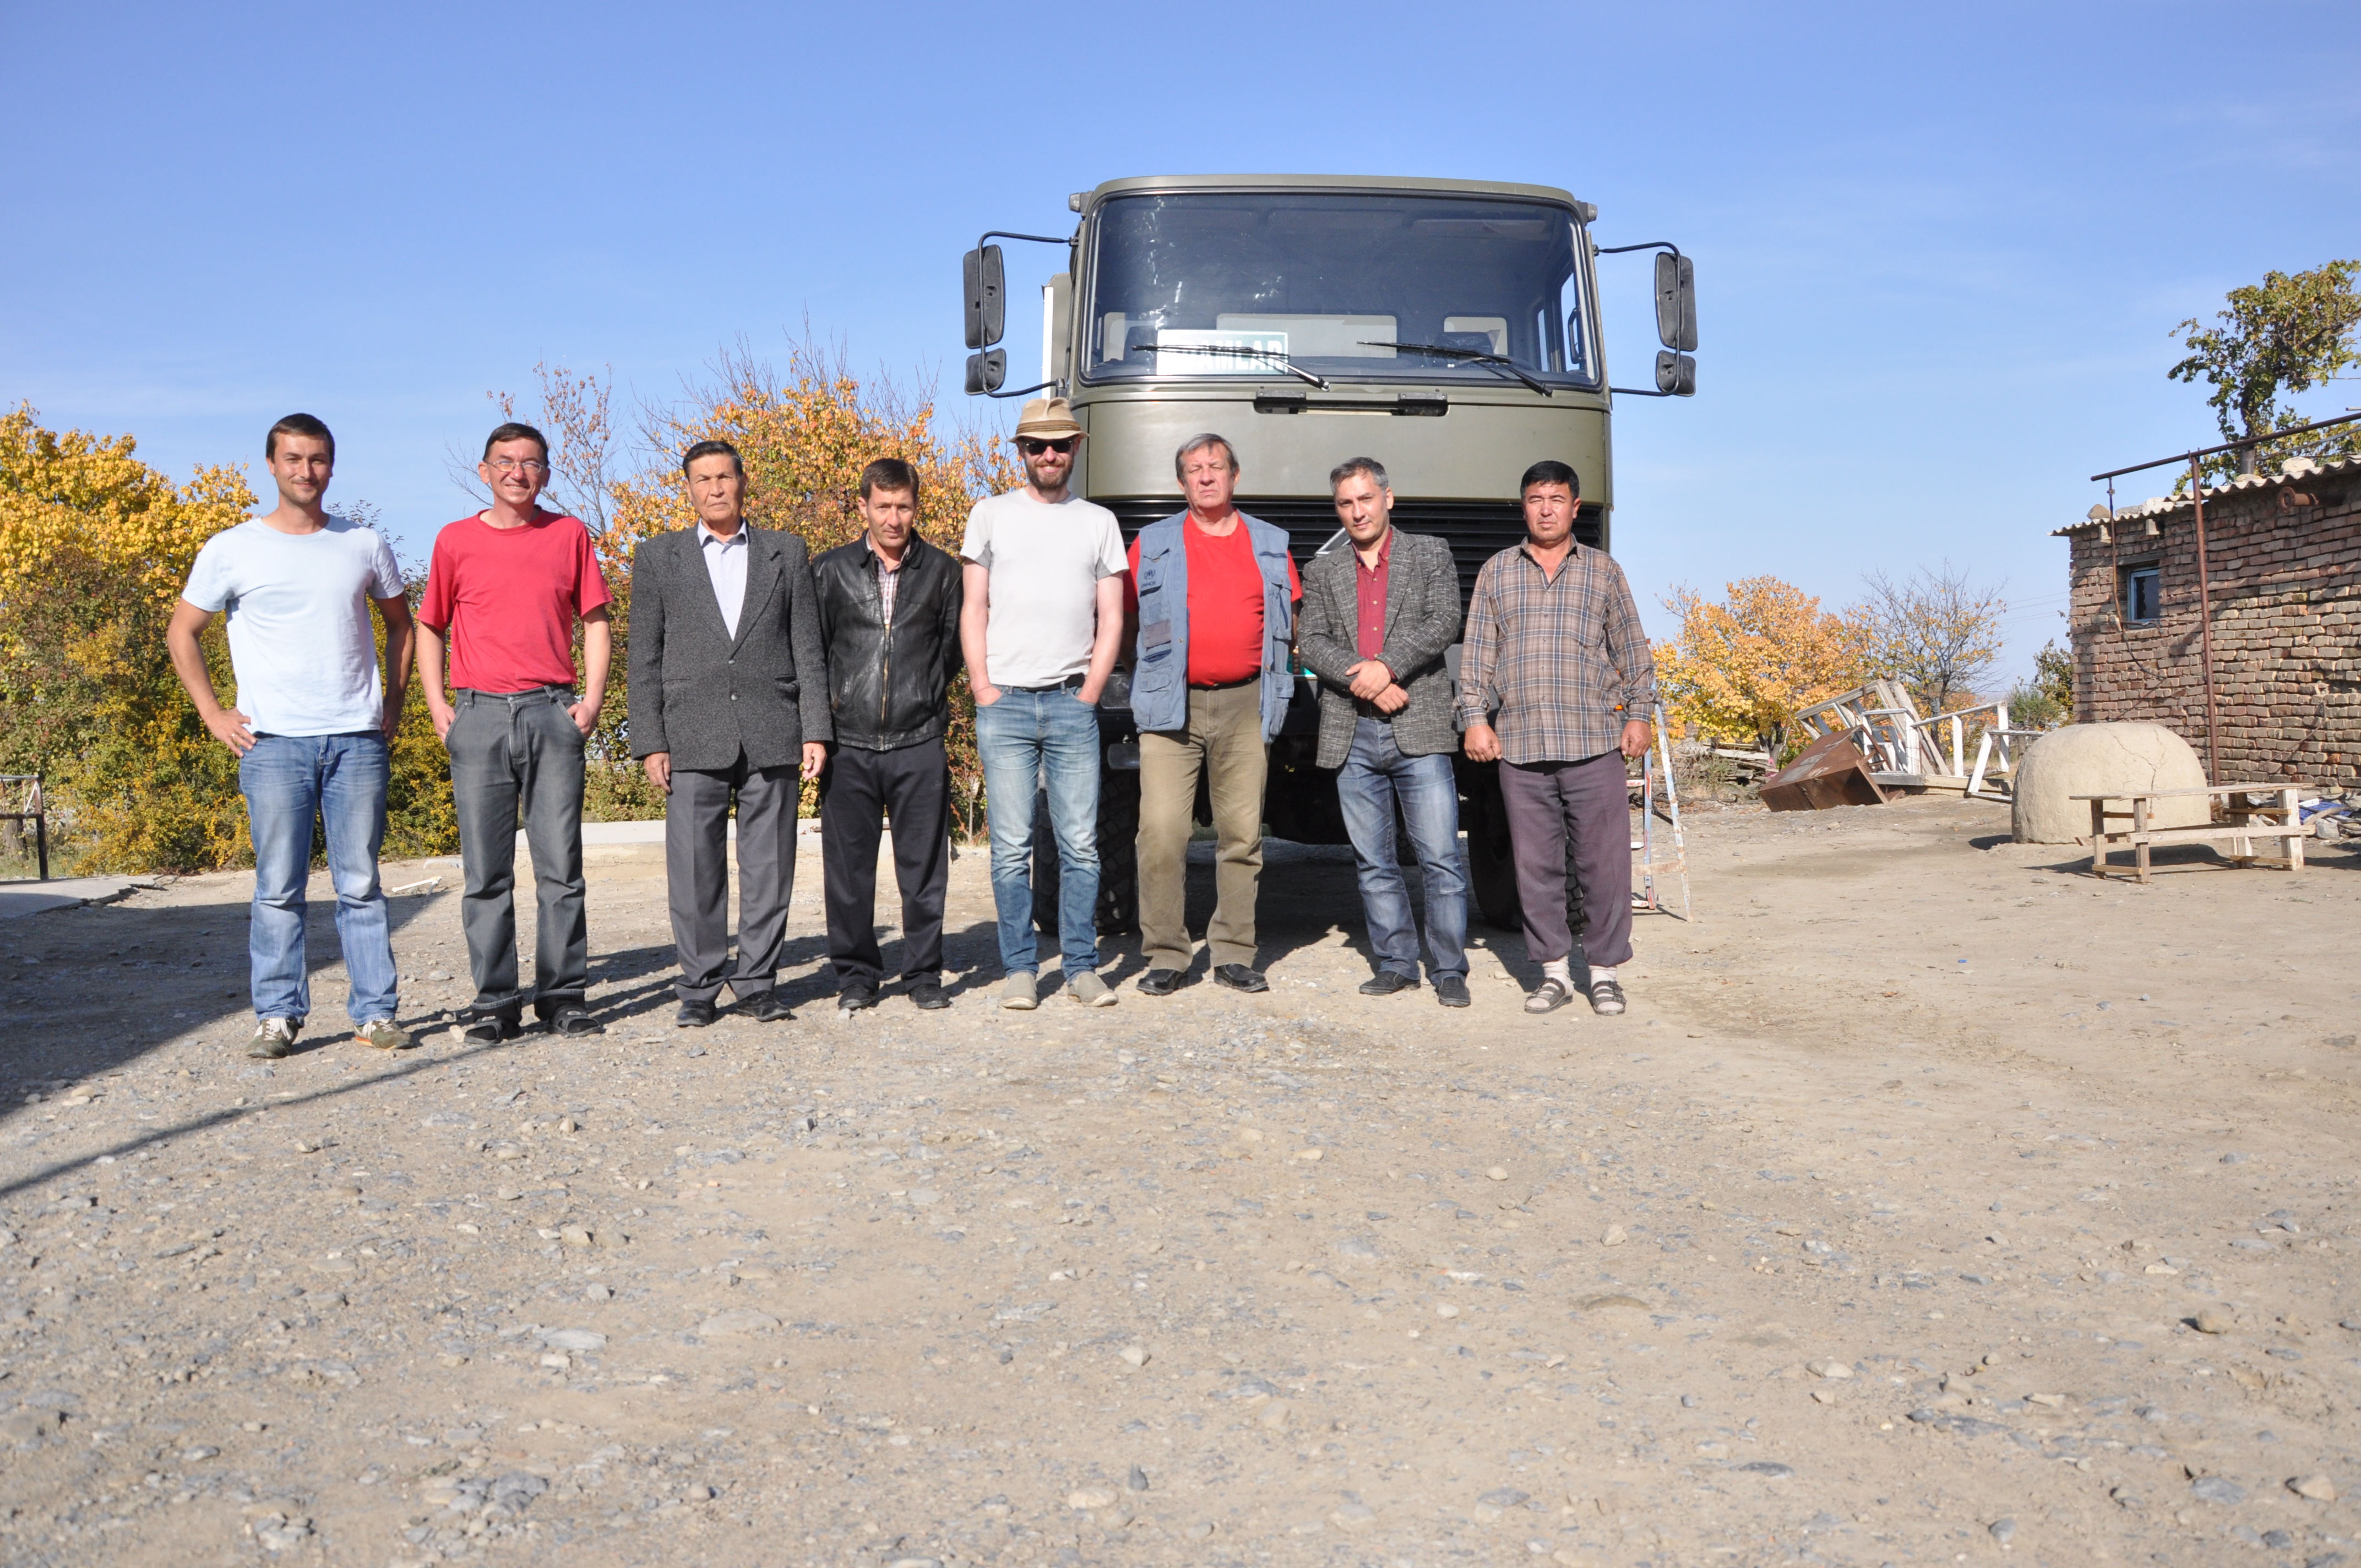
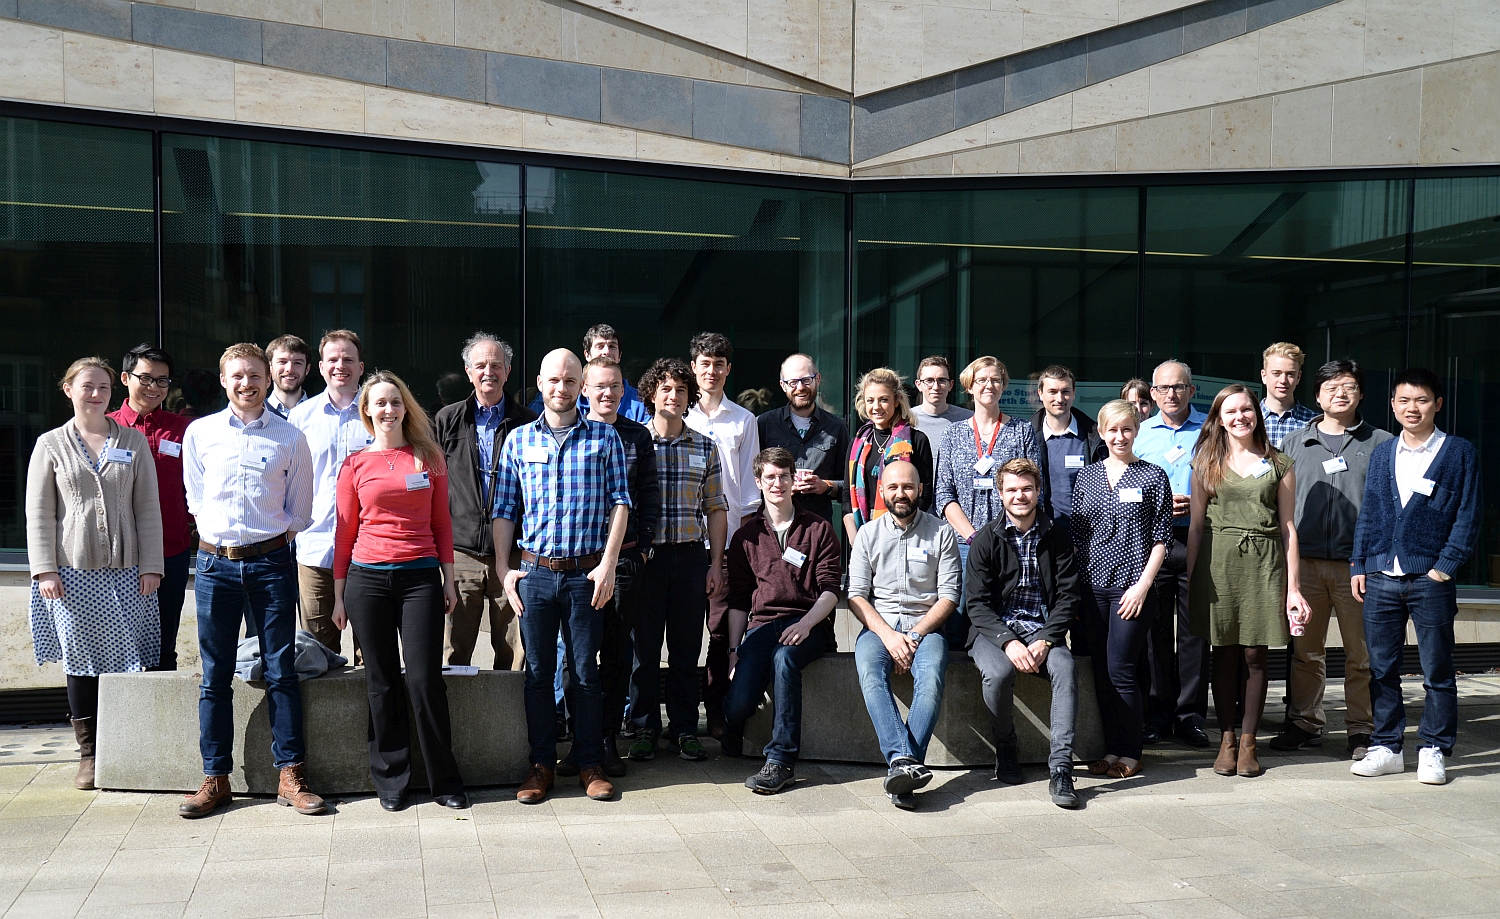
Our team.
In 2015, an EwF team went out for field work in the northern Tien Shan to investigate the slip rate of the Dzhungarian Fault (read the article here). Based on the new findings, we ran another field campaign on this major strike-slip fault in summer 2016. This time we focussed on two different questions:
From 7-11 September, 2016, the conference “Earthquake science and hazard in Central Asia” took place in Almaty, Kazakhstan. The meeting brought together earth scientists and social scientists from the EwF project, and scientists and decision makers from Kazakhstan. Aim was to report on the state of the art of modern earthquake science, to explore strategies for mitigating earthquake risk, and to discuss strategies for communicating science to the public and decision makers. The Shakhmardan Yessenov Foundation sponsered the meeting, which was co-hosted by the Kazakhstan Institute of Seismology of the Academy of Sciences, the National Technical University of Kazakhstan, and the EwP Project. Besides scientific presentations and discussions, a field trip led the participants to earthquake study sites in the vicinity of Almaty.
A conference summary has now been published by Hannah Caddick and Louise Ball from the Overseas Development Institute, ODI. The report can be downloaded here: https://www.odi.org/sites/odi.org.uk/files/resource-documents/11151.pdf.
Here are some impressions from the field trip led by Richard Walker:
Deformed gravel layers testify to tectonic deformation.
Uplifted river terraces can be used to calculate fault slip rates.
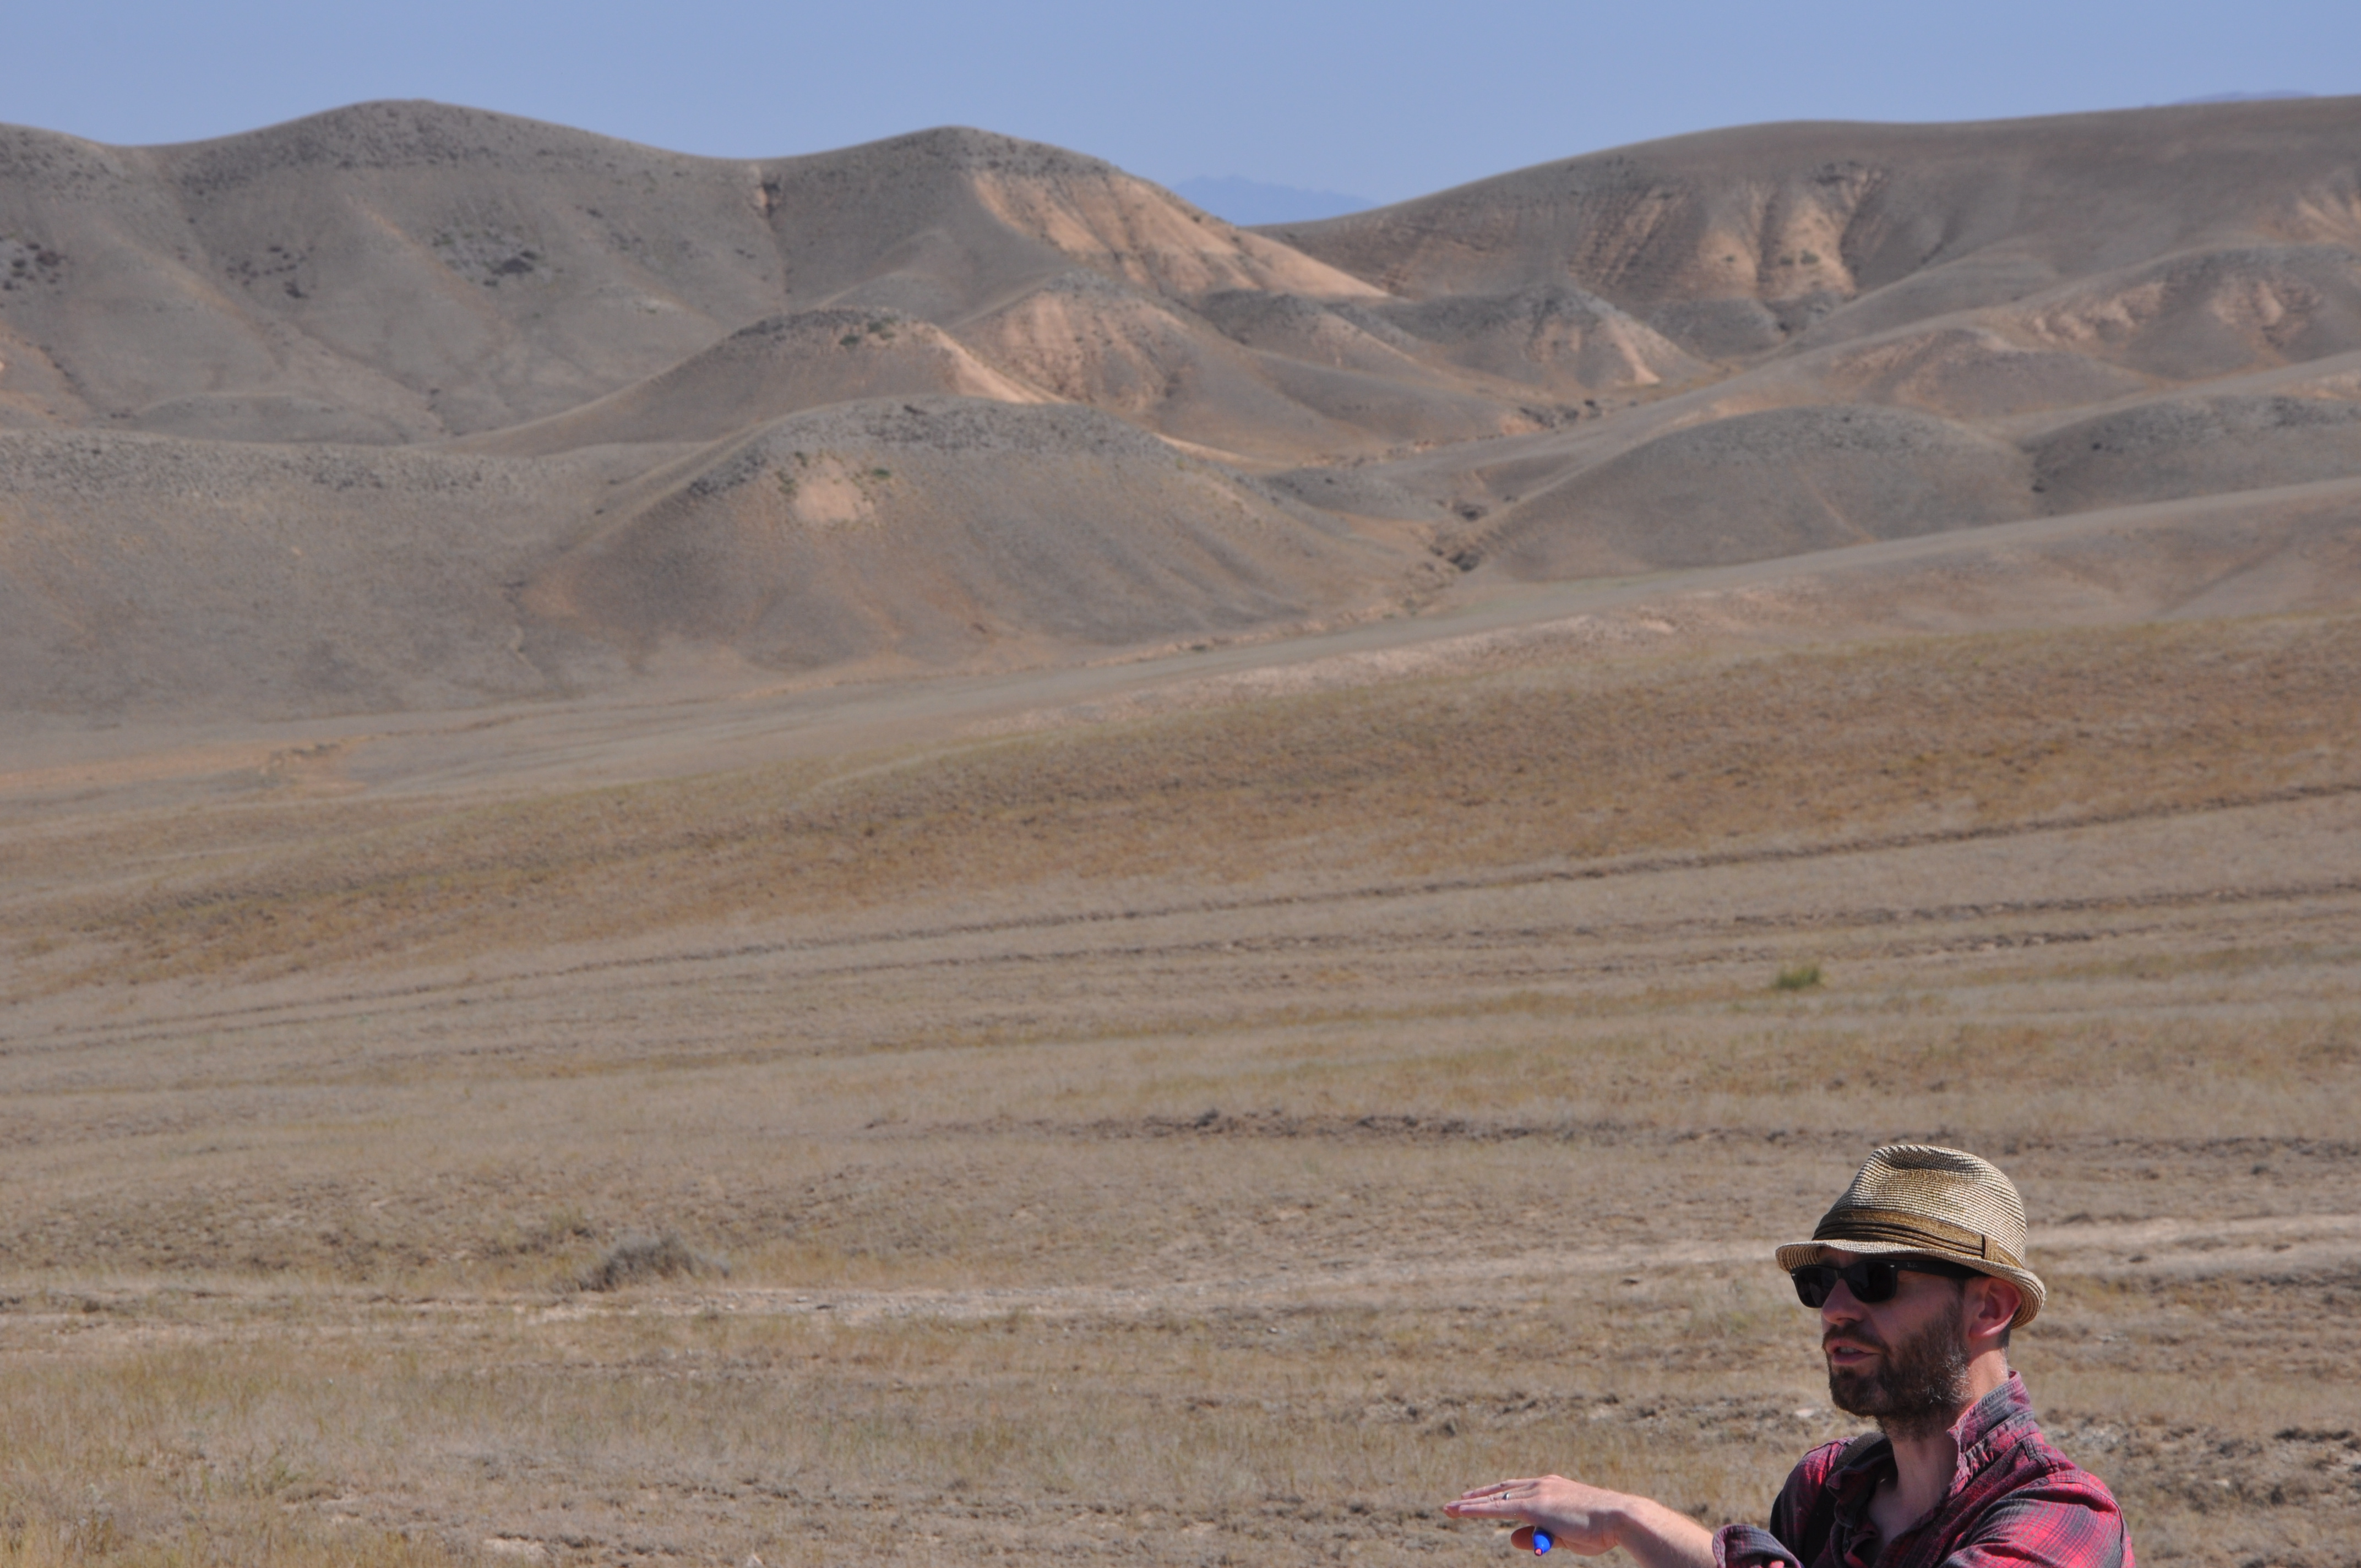
Richard Walker explaining the local geology.
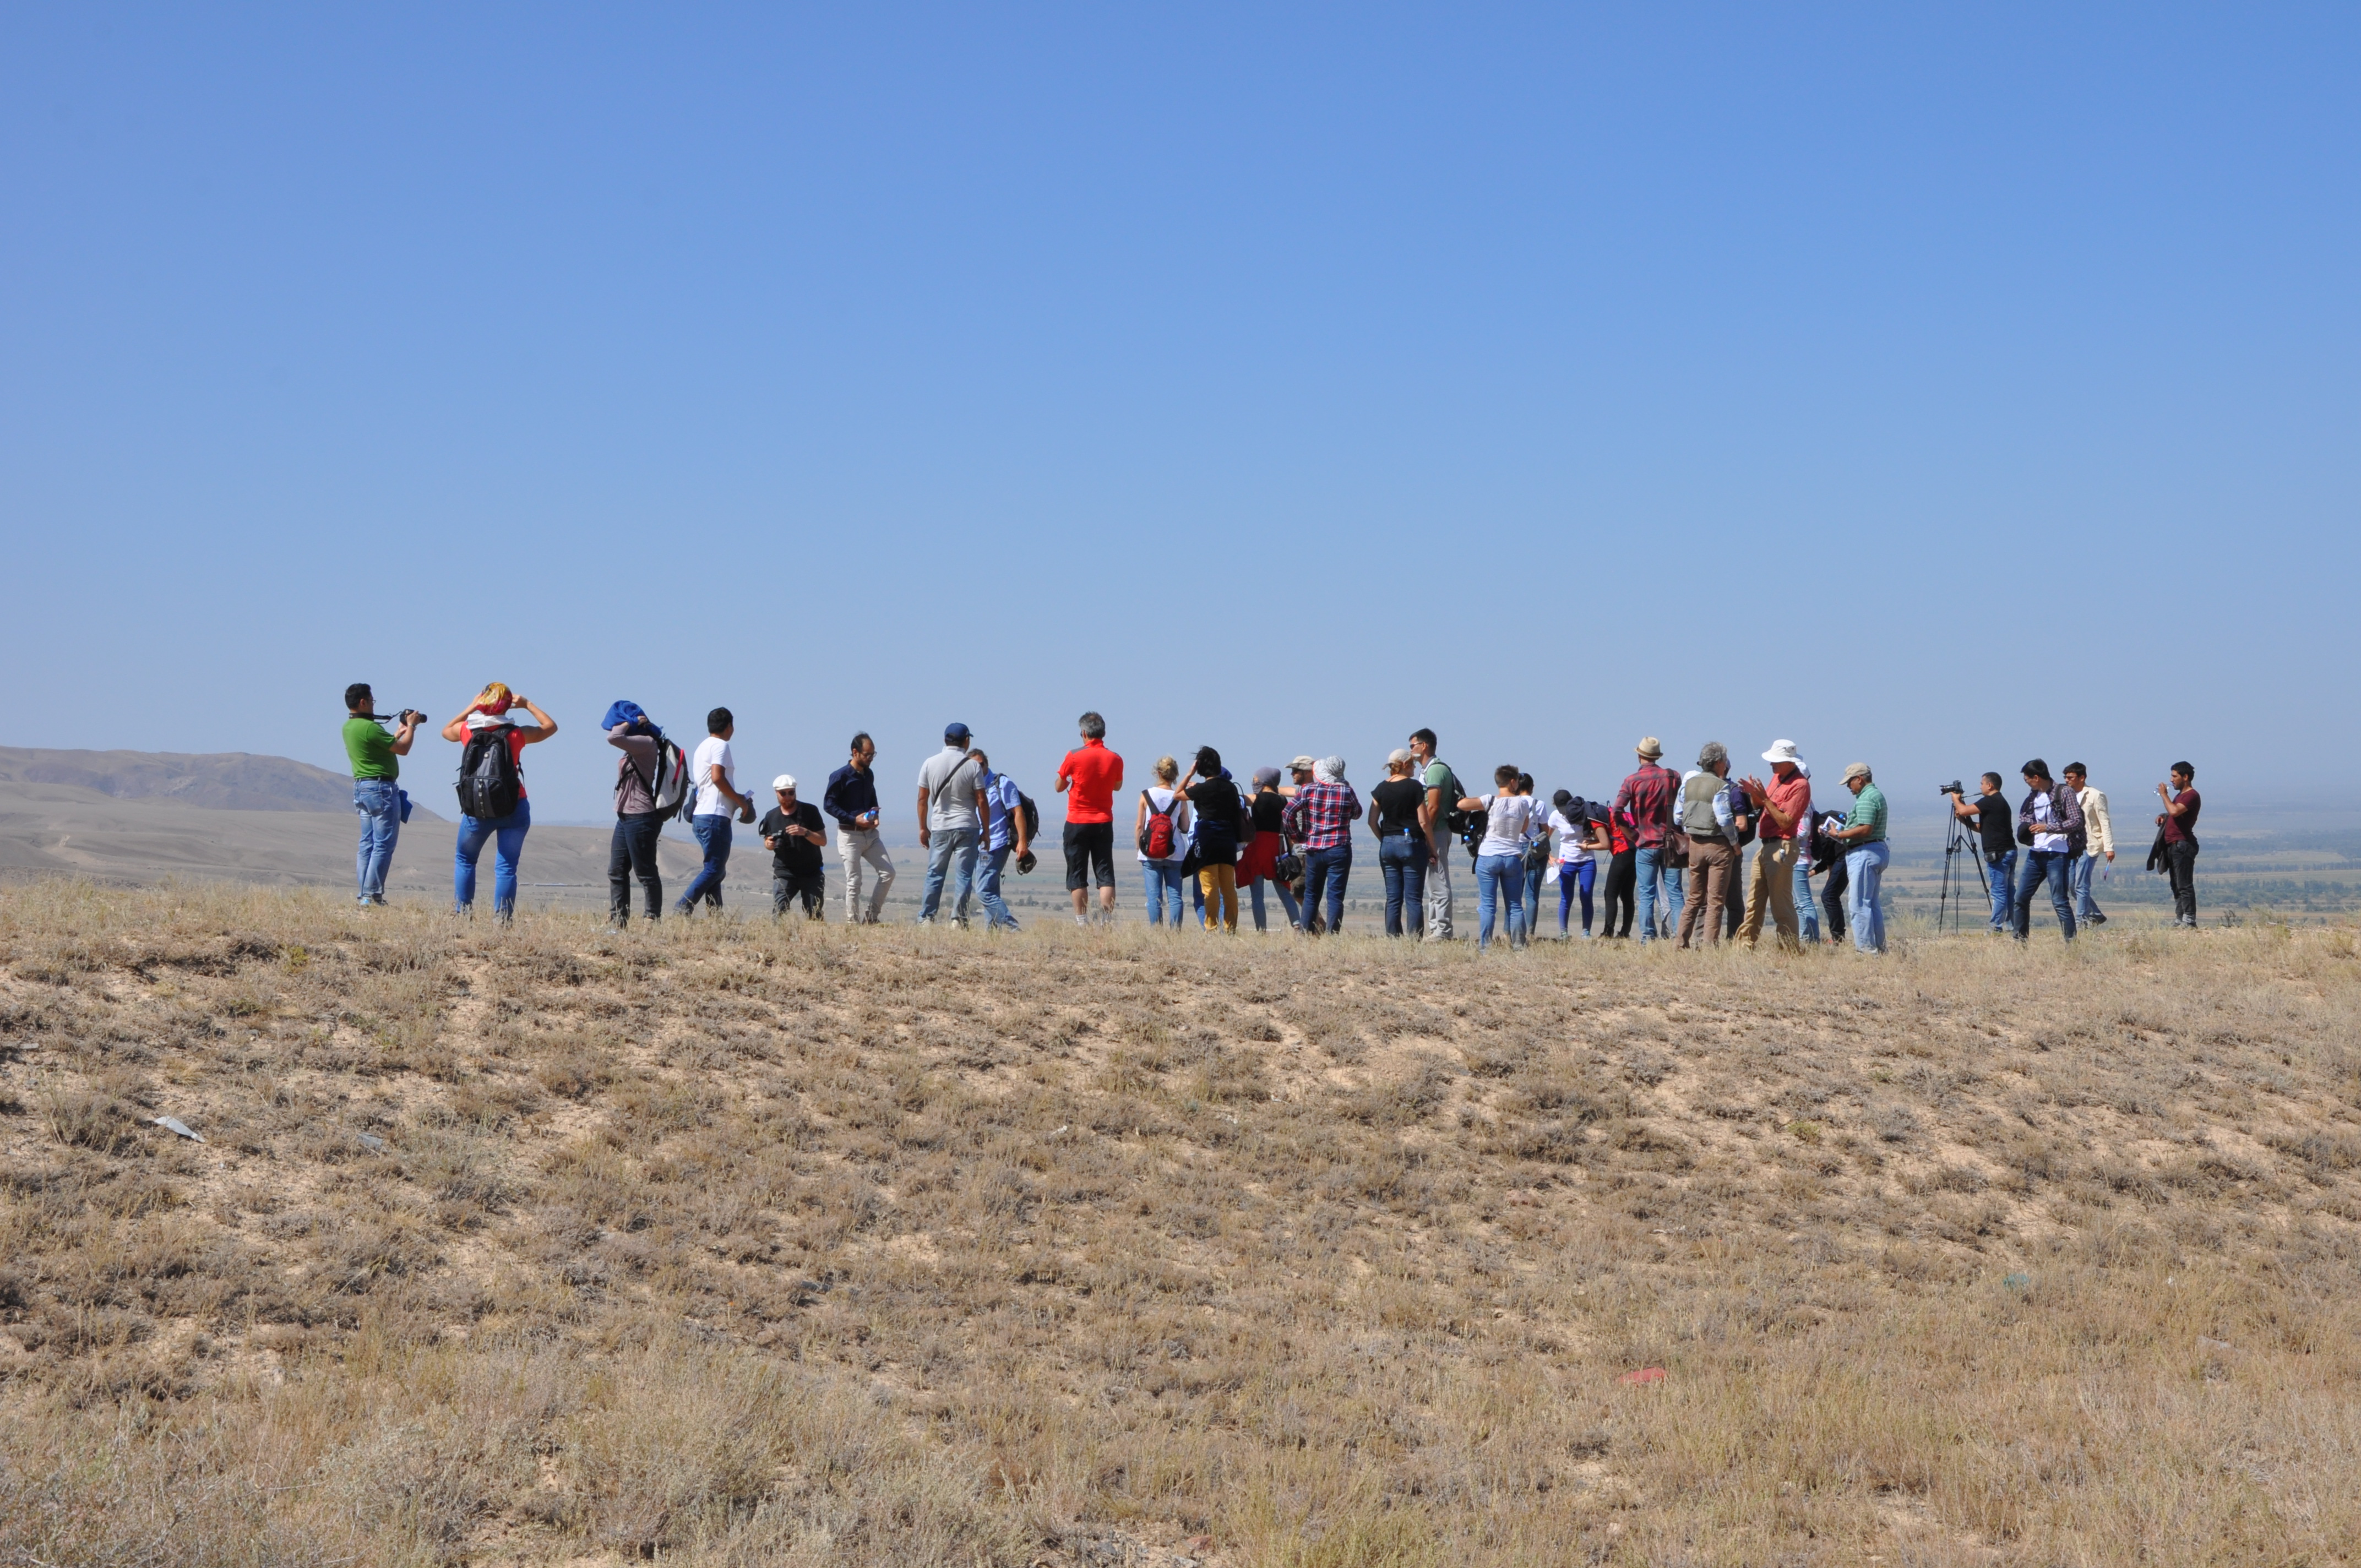
The field trip was also open to Kazakhs students.

“Can you see the fault over there?”
In 2014 an EwF team investigated active faults in southeast Kazakhstan. We focussed on the area around the Ili Basin because we already knew that active tectonics were forming the landscape there and we wanted to find out which of the many faults are the most active ones. This would allow us to better understand the tectonic processes in this continental setting and to help assessing the seismic hazard. We mapped a large number of fault scarps on satellite images before we went to the field. In the field, we used DGPS and our heli-kite to measure the offsets. In one case we opened a palaeoseismological trench across the Toraigyr Fault to find out about the age of the last strong earthquake. Actually, we found evidence for not only one but two surface-rupturing earthquakes in the past ~40,000 years. The offsets of sediment layers and the length of the surface rupture allowed us to estimate the earthquake magnitudes. Radiocarbon and IRSL samples were used to date those sediments.
We were surprised that only the most recent earthquake that happened around 3,200 years ago had an expression at the surface. The effects of the penultimate event could not be seen at all above the ground. In this semi-arid to arid setting fault scarps can be preserved for thousands of years, but erosional and sedimentary processes had obviously obliterated the fault scarp in between the two earthquakes.
This discovery has two important implications:
This study illustrates that fault mapping from satellite images alone might be incomplete and that field studies are essential to see the entire picture.
Excavating the trench.
The Toraigyr mountains.
David trying to unravel the deformation history.
Richard trying to estimate the amount of offset.
Measuring the Gamma dose of the sediments.
Emily and David measuring DGPS profiles across the fault scarp.

A guest during field work.
The Chilik-Chon Kemin Fault in Kazakhstan caused one of the largest continental earthquakes ever recorded. In 1889, an earthquake with an estimated magnitude of ~M8.3 occurred on this left-lateral strike-slip fault zone and produced more than 100 km of surface ruptures (Abdrakhmatov et al., 2016). However, not the entire fault ruptured during this event and we know little about its slip rate, a potential segmentation, and past earthquakes. We are interested in this fault for two reasons. First, it is one of the longest faults in this region and detailed knowledge on its behaviour is necessary to understand its role in the tectonic regime. Second, this fault is a threat for Almaty and other cities in the surroundings, including the densely populated area around Lake Issyk Kul. Studying the earthquake history of this fault will help to better understand the seismic hazard it poses.
An EwF team did field work on this fault for two weeks in July and August, supported by a travel grant from COMET. Christoph Grützner (Cambridge), Angela Landgraf (Potsdam), and Aidyn Mukambaev (Almaty) wanted to find out more details about the tectonic geomorphology of this fault zone and studied the slip rate and earthquake recurrence intervals.
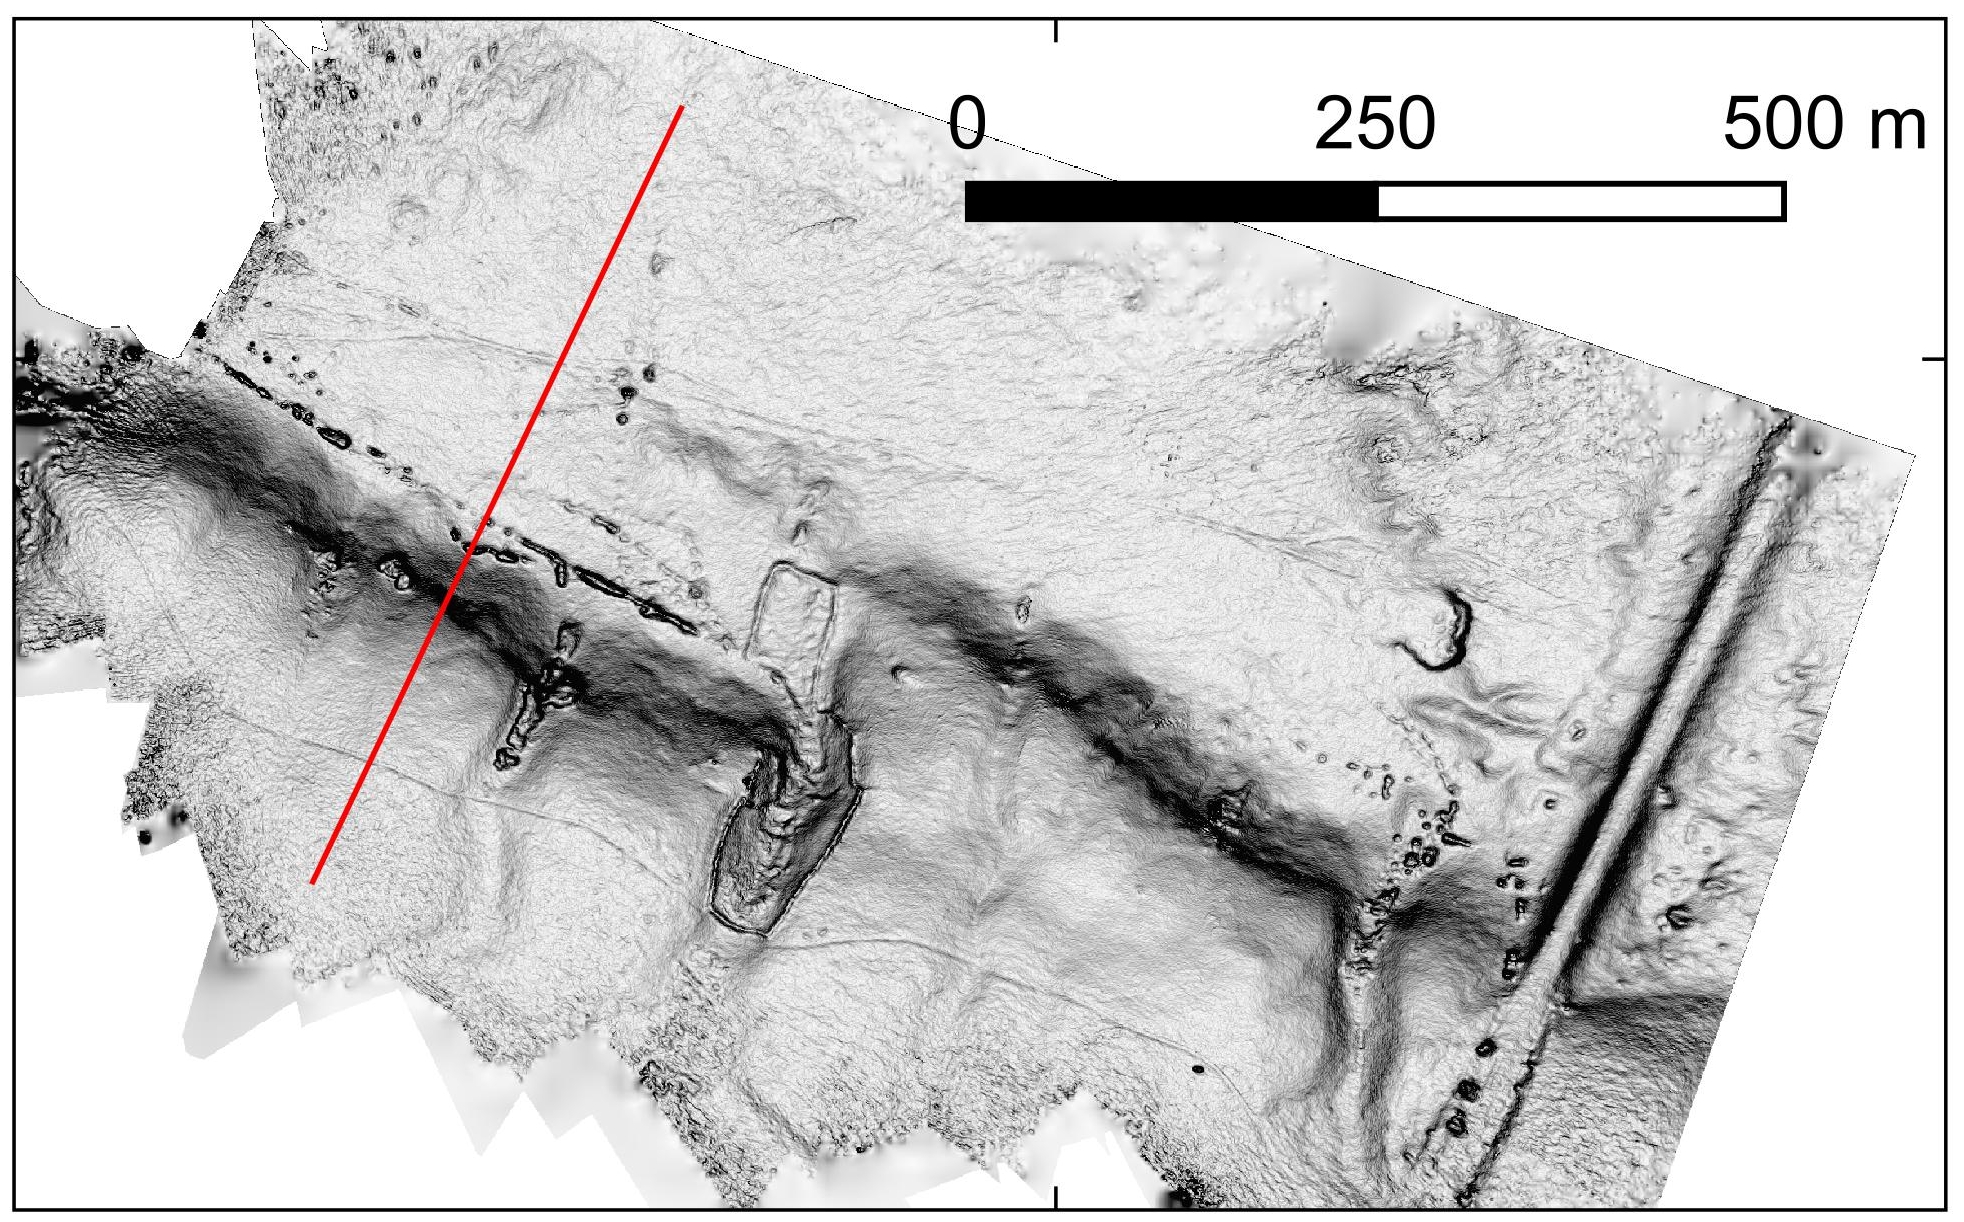
The fault offsets morphological markers on a large scale. SRTM1 data.
The fault has a very prominent morphological expression. Offset valleys and ridges can be seen on satellite imagery. For measuring the offset precisely we needed a better dataset, though. We bought stereo Pléiades imagery to compute a high-resolution digital elevation model (DEM) for this purpose.
We used stereo Pléiades imagery to produce a good DEM. The data reveal traces of active faulting in the landscape.
This DEM allows us to identify even faint hints of faulting in the landscape. In the field we used aerial photos that we took with our drone to produce even higher-resolution datasets of the sites we were most interested in.
A high-resolution DEM from drone imagery.
We discovered offset channels and windgaps that testify to a vertical component of motion on the Chilik-Chon Kemin Fault. In some areas we found scarps that offset relatively young surfaces. This tells us that a surface-rupturing earthquake happened in the past few thousands of years.
The fault offsets ridges horizontally and vertically. Its vertical component of motion caused the mountains on the left to be uplifted.
The fault trace with offset ridges.

A windgap – a former river valley which was uplifted by tectonic activity and consequently abandoned by the river.
The faults are quite obvious in the landscape.
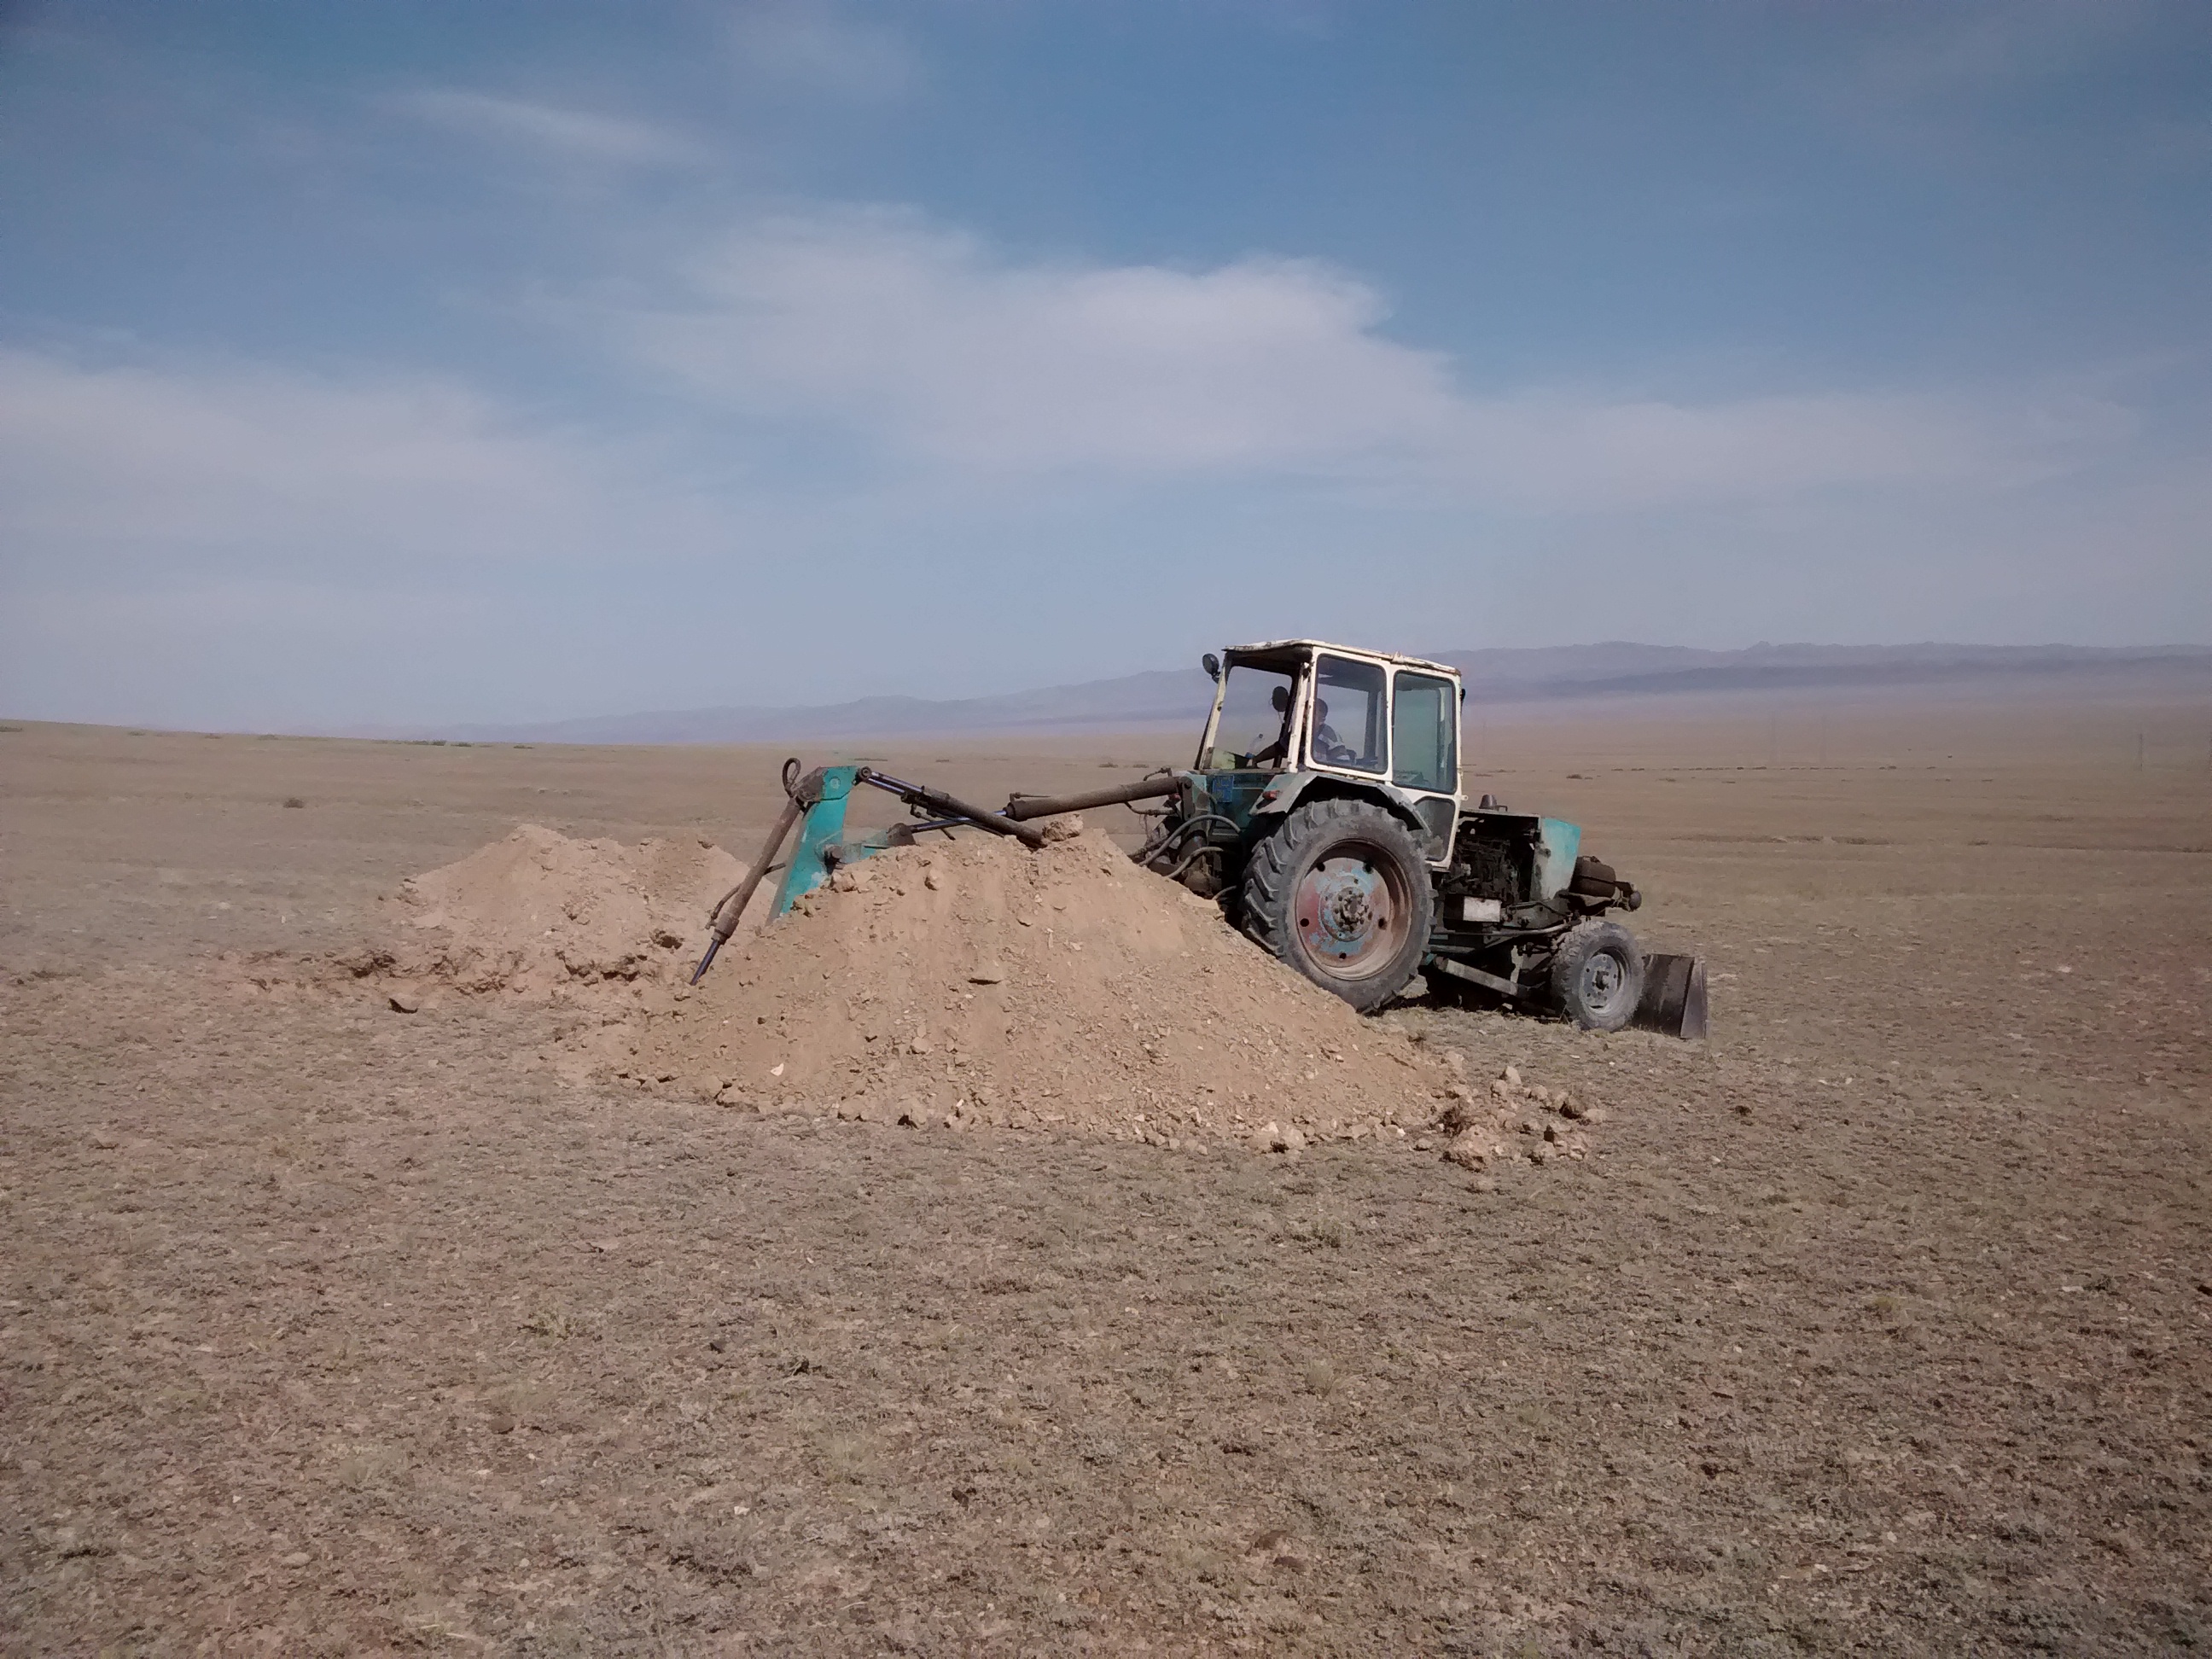
We dug trenches across these scarps in order to find offset sediments that we can date. In the trenches we found old soils that can be dated with radiocarbon. We also collected OSL (optically stimulated luminescence) samples which can be used to find out for how long the sediment has been buried – this is turn allows us to determine the age of alluvial fans and other material.
Angela excavates a trench across a small scarp.

OSL sampling.
Measuring offsets in a trench.
At present we are analysing the DEMs that we collected and we are waiting for our samples to be shipped to the UK. Hopefully we will get some good dates from them very soon.
Apart from the scientific importance of the Chilik-Chon Kemin Fault we were also stunned by the beautiful landscape and by the hospitality of the locals who helped us. Our study sites were very remote with the next market 3 hours away, so we were happy to stock up our supplies with fresh milk, cheese, cream, and lamb.
Everyone was interested in our work.
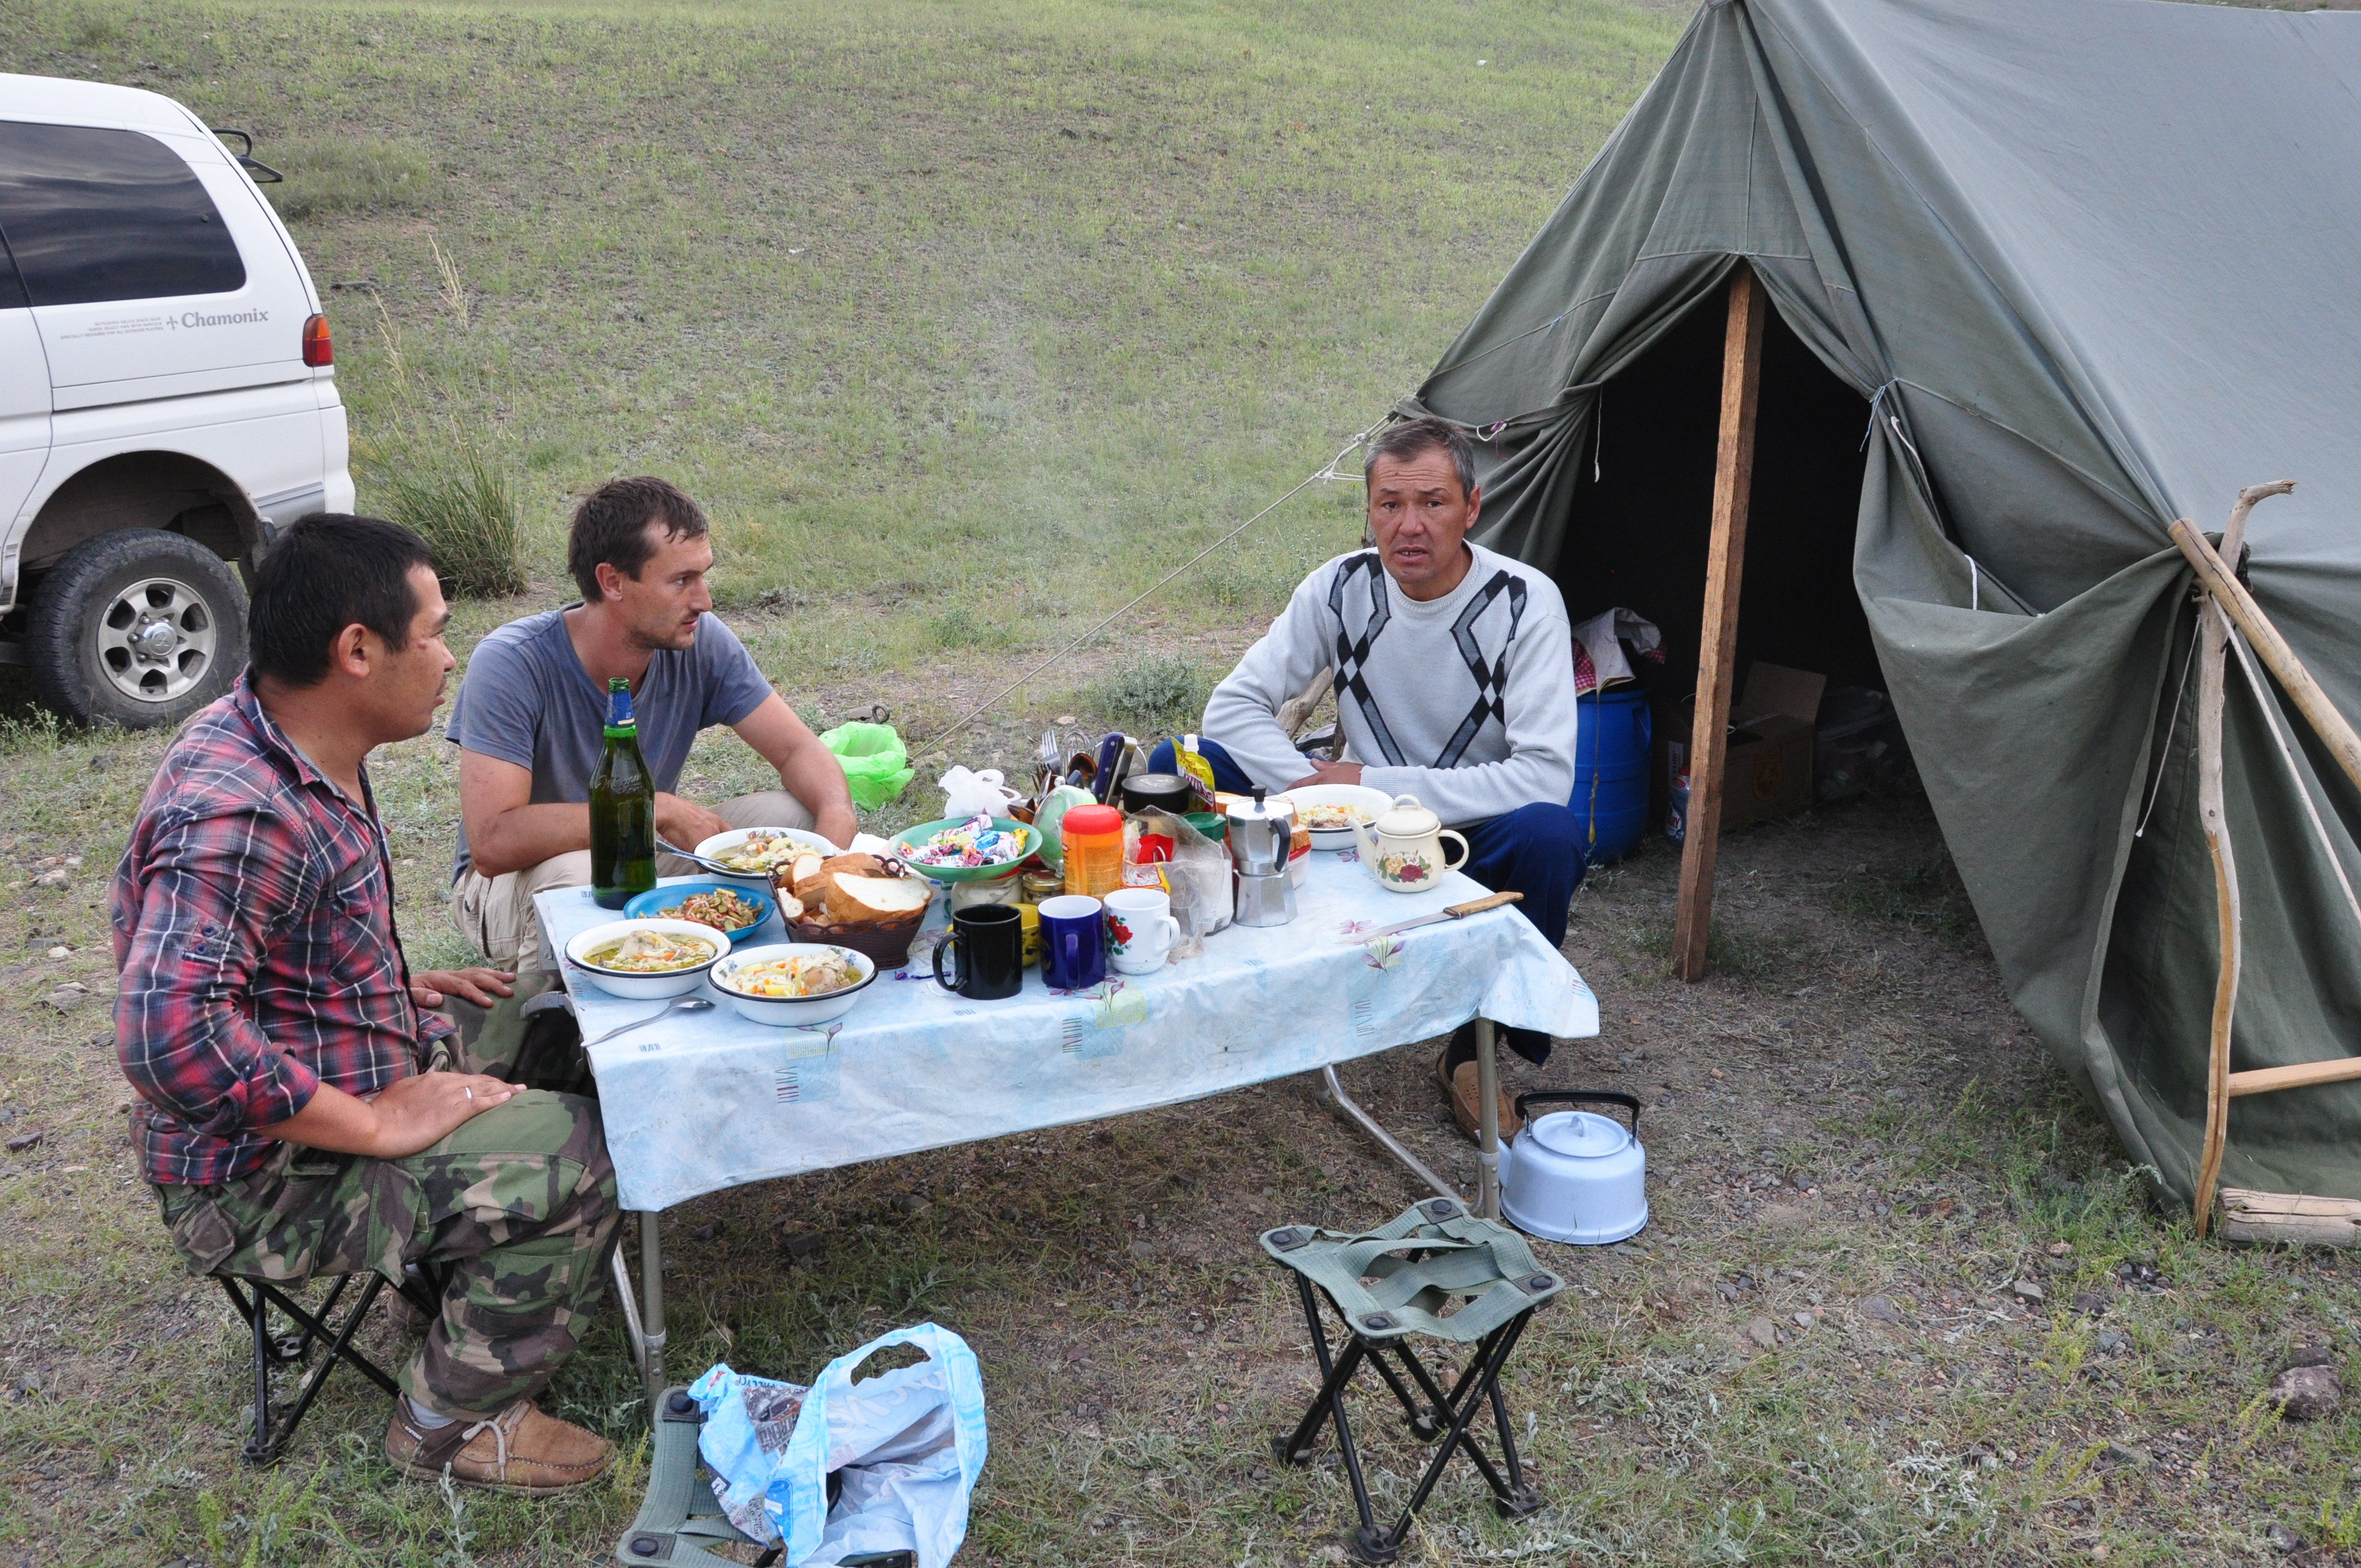
A hearty dinner after a long day.
A big thank you to our driver and cook who made this field work a pleasure! Our colleague Kanatbek Abdrakhmatov from Bishkek organised the logistics and taught us a lot about the geology of the Tien Shan.
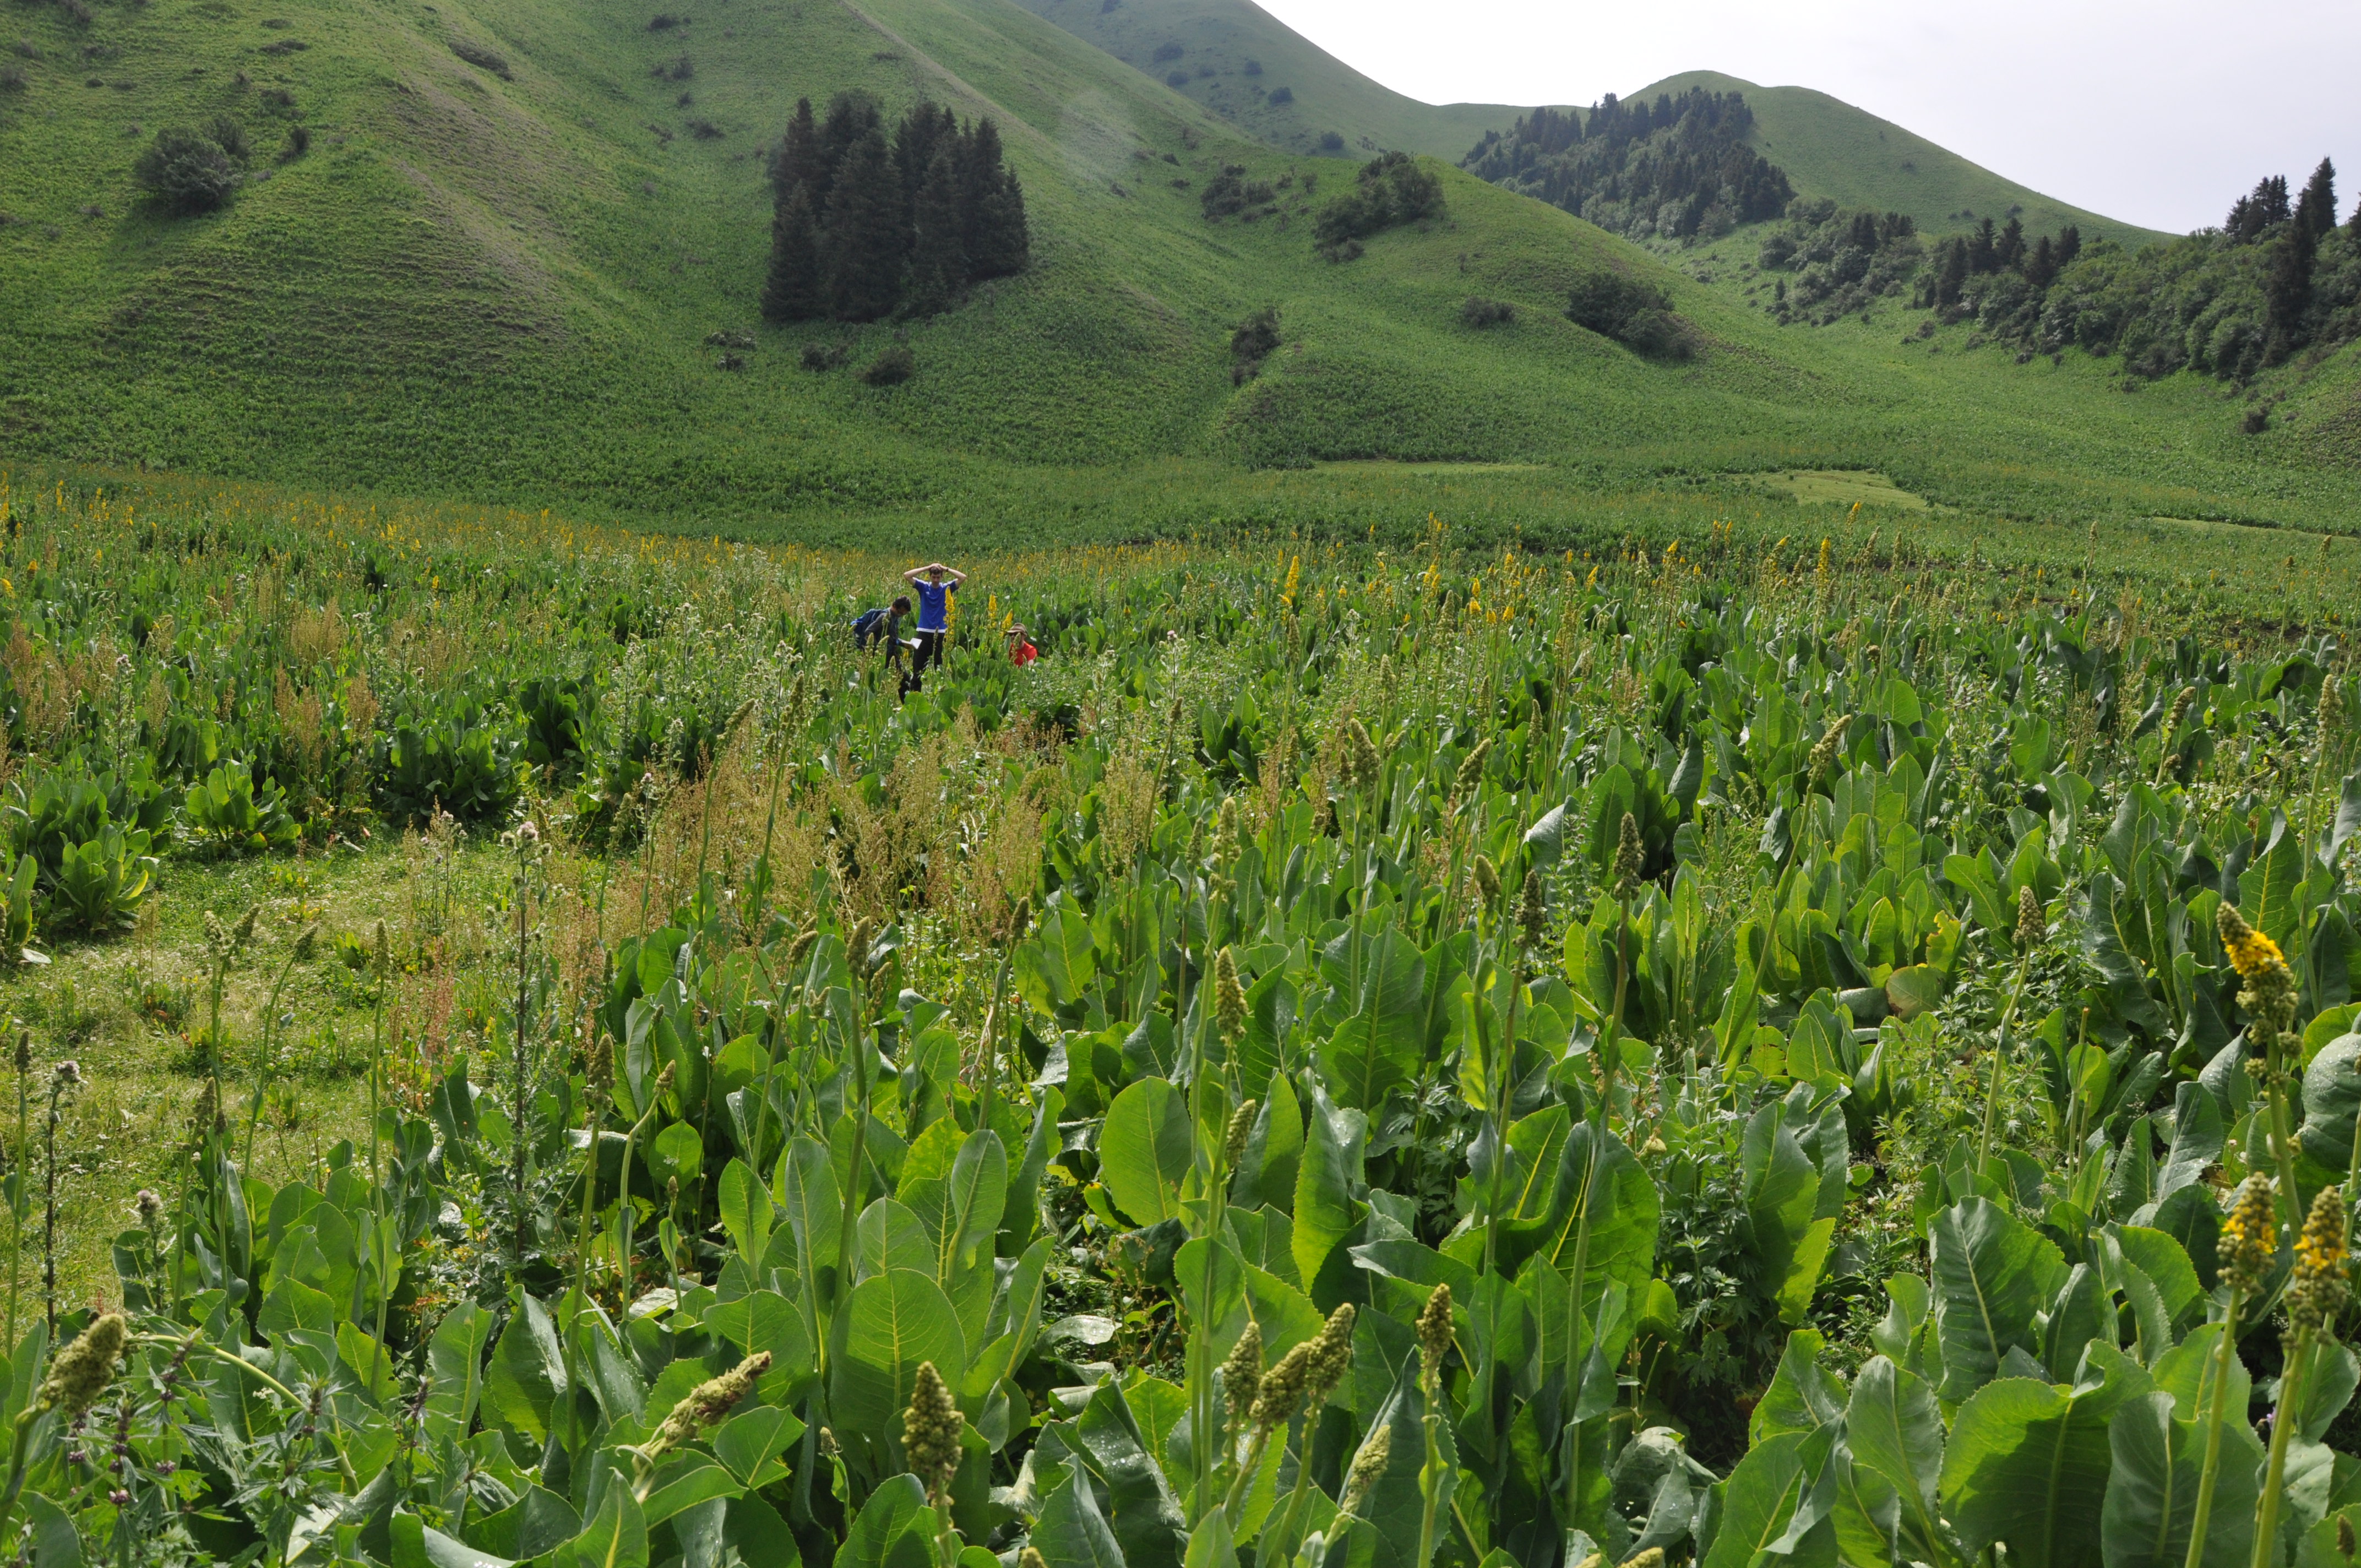
One focus of EwF is to investigate the active faults in the Tien Shan. We map them from satellite data and in the field, we measure their slip rates, and we reconstruct their earthquake history. These studies help us to understand how the continents deform. The data we gather can also be used to better assess the seismic hazard in Kyrgyzstan and Kazakhstan.
The uphill-facing step in slope marks teh active fault here.

Meeting the locals in Suusamyr.
This year’s first field campaign on faults in the Tien Shan led us to the Suusamyr valley in Kyrgyzstan. Here, Eleanor Ainscoe (Univ. Oxford) and me, Christoph Grützner (Univ. Cambridge), used drones to map the effects of the 1992 M7.2 earthquake that caused primary surface ruptures and lots of secondary effects. We also investigated other active faults and folds in the basin. From the aerial imagery we will calculate high-resolution elevation models, and several pits and trenches will allow for the dating of offset geological markers.

Digging a trench across a fault to find out when the last earthquake happened.
After one week we left Kyrgyzstan and moved on to Kazakhstan where we met the rest of the team in Almaty. We split into two parties: Eleanor, Austin Elliott (Univ. Oxford), Ramon Arrowsmith (Arizona State Univ.) investigated the surface ruptures of two strong historical earthquakes that hit the region in 1889 and 1911. They were led by Aidyn Mukambaev (Kazakhstan National Data Centre) and supported by Azad Moldobaev. Their investigations led them into the high mountains north of Lake Issyk Kul. This area is remote, at high elevation and characterised by very steep slopes. Fortunetaly, the local rangers supported them and Aidyn managed to organise a couple of horses.
The mountain front east of Almaty.
The other team (Richard Walker and Barry Parsons from Oxford, John Elliott from Leeds, and me) meanwhile concentrated on the Almaty range front. East of Almaty we found some interesting sites with fault scarps that we surveyed with drones and DGPS. We sampled uplifted terraces for radiocarbon dating and we hope to get a slip rate for the main range front fault. West of Almaty we also looked at fault scarps that would allow us to measure slip rates. Plus, we prepared an excursion that will take place in the course of an EwF meeting to be held in Almaty later this year.

Digging pits to sample and date the alluvial fans.
Now we are back in UK with loads of data, but the field work season has just started. Tomorrow I will leave for another field trip to Kazakhstan with my colleague Angela Landgraf from Univ. Potsdam. There are so many faults out there and there’s so much to do!
Richard and John fly the drone.
We can compute high-resolution digital elevation models from our drone imagery using the Structure-from-Motion technique.
Background: one of our priorities in the Earthquakes without Frontiers project has been to understand how earthquake science is used in disaster risk reduction (DRR) efforts across the partnership countries. To what extent are DRR activities informed by, or underpinned by, scientific knowledge of earthquake hazard? What parts of that existing hazard knowledge are being used, by whom, and in what ways? What parts are not being used, and why have they not been taken up? What new scientific knowledge would be most useful, and are there applications or end users for that knowledge that are already identified?
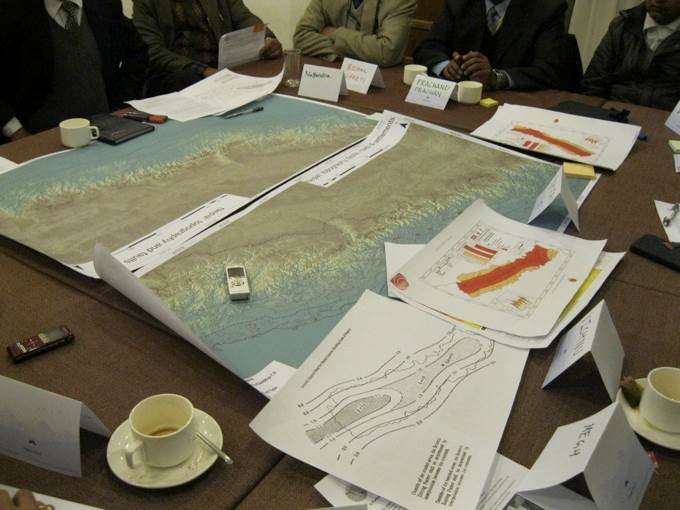
To begin to address these questions in Nepal, one of our case-study countries, members of the EwF team convened a series of focus groups in Kathmandu in early 2014. The groups included Nepali Earth scientists, as primary creators of earthquake hazard knowledge, as well as representatives of the major primary users of that knowledge: NGOs, major donor organisations, UN agencies, and engineers. The outcomes of this study have now been published as a working paper by the Overseas Development Institute. Below, we reproduce the executive summary of the working paper. The full text is available at https://www.odi.org/publications/10450-earthquake-science-drr-policy-and-practice-nepal.
This working paper summarises current and potential uses of earthquake science in disaster risk reduction (DRR) and resilience-building activities in Nepal. It is written for anyone with an interest in earthquake DRR in Nepal, in particular scientists who generate earthquake science and practitioners and policymakers who could use it. The study has been undertaken as part of the Earthquakes without Frontiers (EwF) project, funded by the UK Natural Environment Research Council and the Economic and Social Research Council. The project aims to support governments, non-governmental organisations and communities to build resilience to earthquakes and secondary hazards along the Alpine-Himalayan belt. It is focused on four case study countries: Nepal, the neighbouring Indian state of Bihar, Kazakhstan and China.
Nepal is a geologically active country with a long history of destructive earthquakes – most recently in the 2015 Gorkha earthquake sequence. There have been substantial advances in the scientific understanding of earthquake hazard in Nepal, but it is not clear how that understanding has informed, or could inform, national and international investment in earthquake DRR activities, and to what effect. The aim of this paper is to understand the role that earthquake science plays in DRR policy and practice in Nepal by seeking answers to the following questions:
In January 2014, we conducted a set of interviews and focus group discussions with local scientists, engineers, urban planners and representatives of major donor and practitioner organisations that are involved in DRR activities in Nepal. We found that earthquake science is widely used by those responsible for DRR in Nepal. Much of this science, however, is very general, and for most users it is used to inform broad opinions or choices rather than specific plans. This under-utilisation happens in part because potential science users don’t know what science can say (and therefore what questions to ask), and because scientists don’t know what those potential users need. Many of the questions that are directly addressed by earthquake science are far removed from the questions of those involved in DRR. Where earthquake science does provide knowledge of direct relevance to DRR, the wider context around the DRR activity has at least as much influence on what can be done as the science itself.
We found that there is appreciable earthquake science capacity in Nepal, with expertise on both primary and secondary earthquake hazards. Local scientists are often less connected to DRR organisations (e.g. donors and NGOs) than are international scientists, leading to frustration and disengagement with the DRR process.
We argue that science could be used both more often and more instrumentally within resilience work to guide and advance disaster preparedness and management, and to support DRR policy priorities and activities. These potential uses can be distinguished in terms of the primary end users:
Specific recommendations
We recommend the creation of a sustainable, government-led science advisory group, composed of national and international earthquake scientists, which could be called upon by potential users from the DRR community for advice at every stage of the disaster cycle in Nepal. This group could help to condense and assess available scientific information on earthquake hazards.
To ensure that end users can draw on expertise from this group, and from earthquake science more generally, we recommend that the model of the Nepal Risk Reduction Consortium – an existing partnership between the Government of Nepal and the humanitarian and development community, tasked with coordinating DRR activities in the country – be developed and extended as a way of ensuring explicit cooperation between government, donors and NGOs. This model provides a potential gateway for science to enter into DRR activities because it connects the relevant users and provides clear focus areas for engagement around a particular aspect of DRR, acting both as a conduit and as a point of contact for science and scientists.
We also recommend that scenarios be used more widely for contingency and logistics planning, as a specific mechanism for allowing earthquake science to be taken up and utilised by a range of end users. These scenarios can allow exploration of different possibilities – for example, the effects of earthquake occurrence during day-time or night-time hours on casualties, or the impacts of structural retrofitting efforts that are focused on particular districts or particular building types. They also have the potential to identify possible impacts that are currently not considered, such as the effects of earthquake-triggered landslides, or earthquake impacts in rural districts as well as urban areas. The scenarios would be most effective if they were consensus products from a science advisory group (as recommended above), including government representatives, that could provide a collective and authoritative voice, backed up by peer-reviewed earthquake science.
Observations
The 2015 Gorkha earthquakes triggered more than 22,500 landslides, focused along the major river valleys in the hill and mountain districts of central and western Nepal, and were equivalent to several hundred years of ‘normal’ monsoon-triggered landslide activity in these districts. The 2015 monsoon caused numerous additional landslides, focused in the areas that were hardest-hit during the earthquake, and at rates that were still 10-20 times greater than a normal monsoon. The 2015 monsoon also reactivated many of the landslides that were triggered by the earthquake, generating highly mobile debris flows (mixtures of sediment and water) that have travelled long distances downslope during intense rainstorms.
The 2015 monsoon strength was widely considered weaker than normal. As expected, during the dry season (October 2015 – June 2016), few landslides have changed. The 2016 monsoon is forecast to be normal, and so more intense than 2015, and so landsliding is expected to be as, if not more, severe in 2016. Furthermore, areas with the greatest degree of landslide activity in the earthquake and the 2015 monsoon will be at greatest risk of further landsliding, including debris flows, during the 2016 monsoon.
Landslides – both those triggered by the earthquake, and by subsequent rainfall – pose two forms of hazard to people and infrastructure (Fig 1):
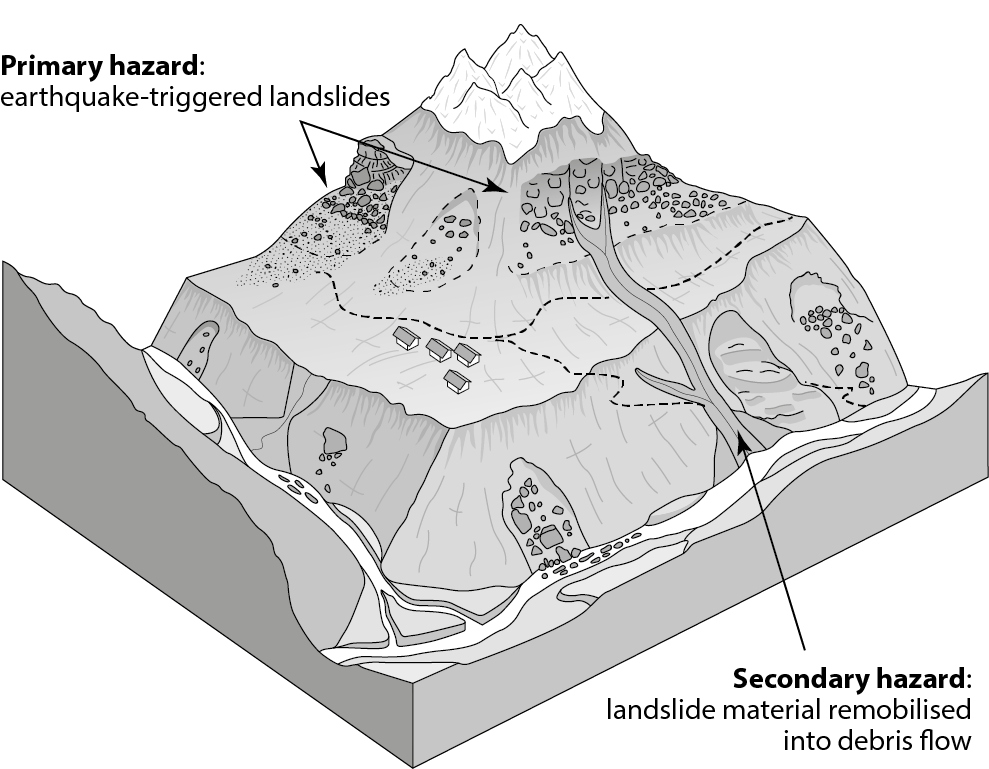
Fig 1. Schematic view of landslide hazards in earthquake-affected mountain districts of Nepal after the 2015 Gorkha earthquake. Landslides triggered by the earthquake (primary hazard) are focused high on hillslopes (typically above most settlements) and along valley floors. Landslide material is then remobilised into debris flows (secondary hazard) that travel down along existing channels or gullies and affect valley floors.
These different types of hazards have very different impacts and require different mitigation measures. Both forms of hazard, however, increasingly have major impacts on the densely populated, valley bottom settlements, adjacent to major transport corridors. Whilst it is effectively impossible to predict the exact locations of the primary hazard, simple rules of thumb can be used to identify the most risky locations:
Observations from the earthquake affected districts, along with direct comparative experiences from the 1999 Chi-Chi, 2005 Kashmir, and 2008 Wenchuan earthquakes, shows that landslides and debris flows will occur at higher-than-normal rates in the earthquake-affected area for the next years to decades. The districts shaken by the earthquake still have many areas of cracked ground (Fig 2), which may develop into landslides during the monsoon, as seen during the 2015 monsoon from the analysis of repeat satellite images (Fig 3 – 4). Monitoring of these districts and analysis of how landslides are changing since the earthquake is, to date, inconclusive about the future risk. It is not currently possible to be more precise about the duration of this enhanced landslide activity, and it is likely to vary with both location and monsoon strength.
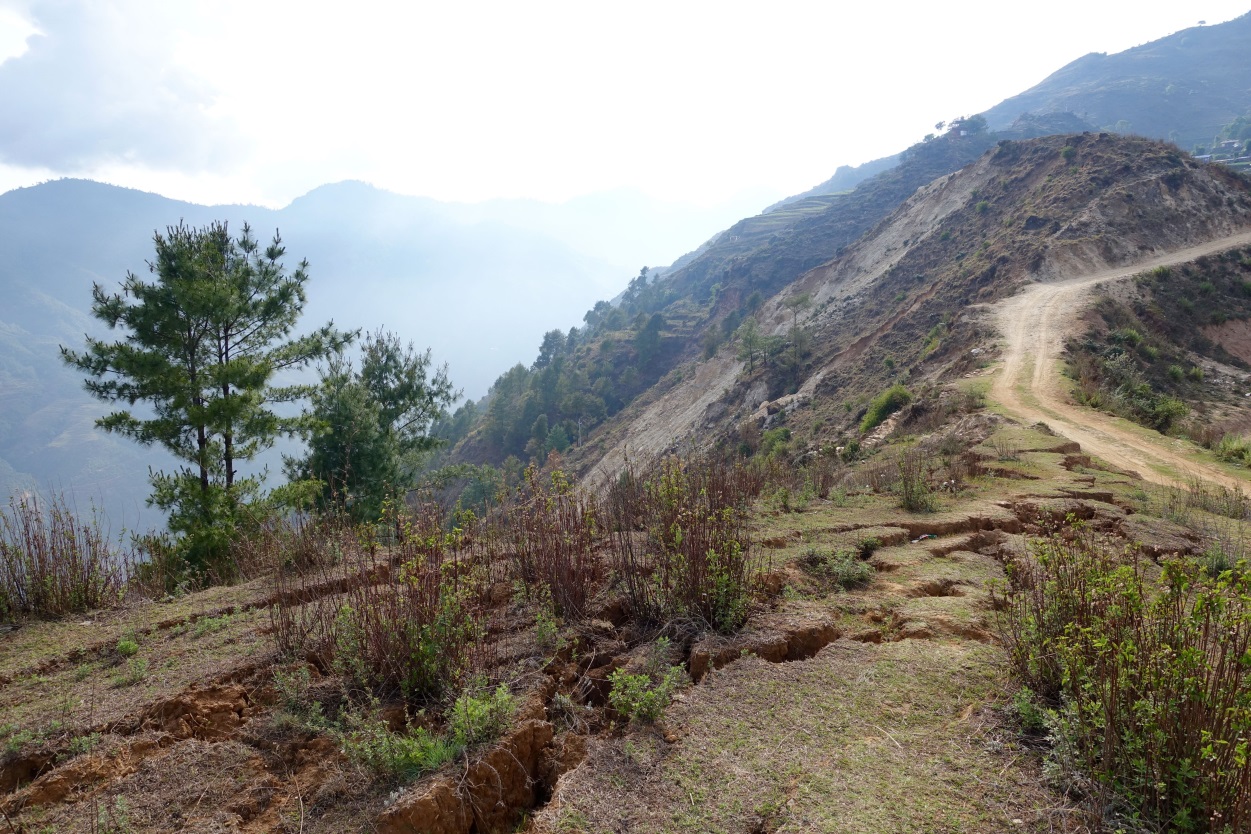
Fig 2. Extensive ground cracking in Listi VDC, Sindupalchok.
Importantly, it should not be assumed that the hazards described above are ‘finished’ and are no longer an issue in 2016 or later. Indeed, areas which have previously experienced a landslide are highly likely to experience further landslides. Quiescence during the dry season is not an indication of future stability during the monsoon. The nature of landslide hazard will evolve, and there is no precedent for how this will play out, so monitoring how this evolves is important to assess risk.
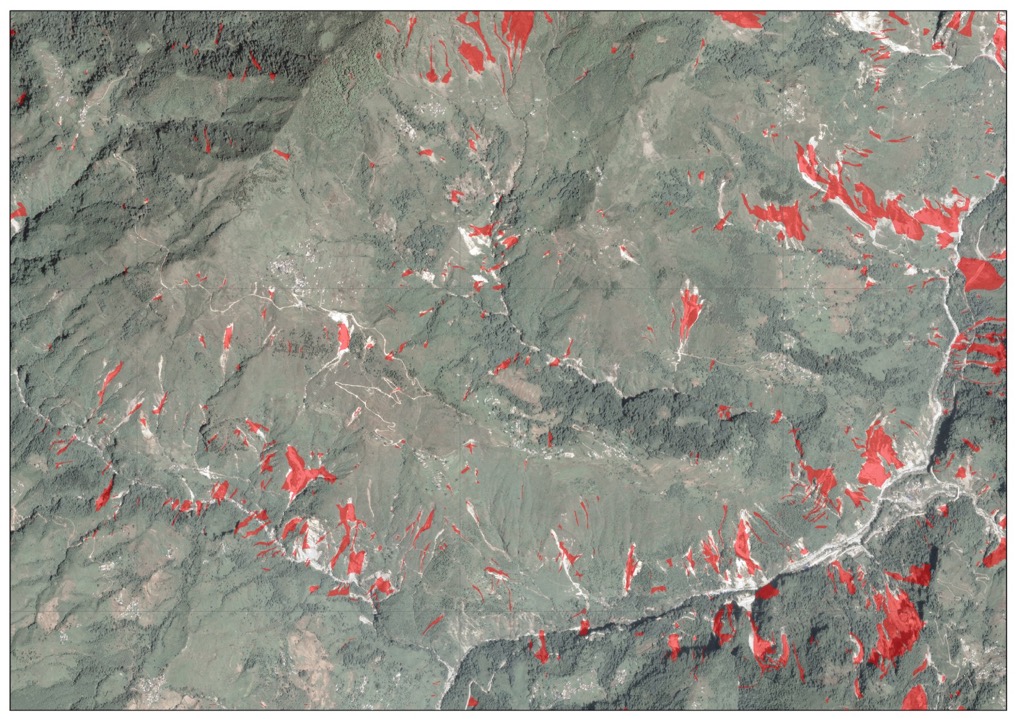
Fig 3. The extent of landsliding triggered by the 2015 earthquakes, shown by red polygons. Area shown is Listi VDC, Sindupalchok. Image width is c. 6 km.
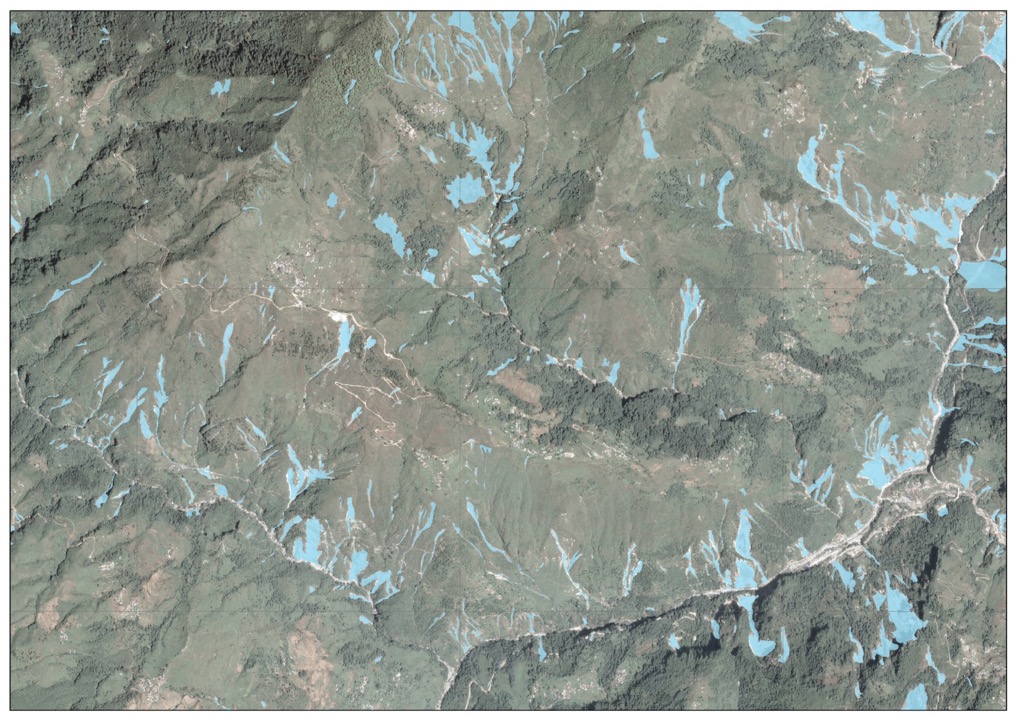
Fig 4. The extent of landslides after the 2015 monsoon, showing an increased occurrence of landsliding reaching the valley bottoms. Area shown is Listi VDC, Sindupalchok. Image width is c. 6 km.
2016 South Asian Summer Monsoon
The World Meteorological Organisation publishes the consensus outlook for the South Asian Summer Monsoon in April[1]. In summary, El Niño conditions have weakened, and are predicted to continue to weaken over the summer, with La Niña conditions developing later in the season. Comparison with historical records suggests that such conditions are coincident with normal and above-normal rainfall over the South Asia region. In Nepal, it is predicted that the 2016 monsoon will generate near-normal rainfall over the majority of the country, including the earthquake-affected districts, with above normal in the far south west and below normal in the east. If La Niña conditions to develop later in the season, increased levels of rainfall may be expected.
From the perspective of landslide risk, this forecast suggests a stronger monsoon than 2015, and so a heightened risk from rainfall-triggered landslides in 2016. Landslide risk relates to both: (i) a long-term build-up of moisture in the ground through the monsoon period, and (ii) extreme intensity short-duration rainfall. Both conditions can generate hazardous landsliding. The monsoon onset in Nepal is normally expected on 10th June with the cessation on 23rd September. Whilst intense pre-monsoon rainfall in early May has already triggered several fatal landslides in Nepal (e.g. Kotwada VDC, Kalikot, 20th May) and led to some road blockages (e.g. the Arniko Highway on 20 and 24 May), the 2016 monsoon onset is widely regarded to be delayed.
Key messages: Reducing risk to landslides
Whilst it is effectively impossible to negate the risk posed by landslides in Nepal, simple measures can reduce exposure:
Nick Rosser, Alexander Densmore and Katie Oven, Durham University
June 2016
[1] http://ane4bf-datap1.s3-eu-west-1.amazonaws.com/wmocms/s3fs-public/consensus_statement_sascof8-1.pdf?CUSH5v4GMJHw9E7BJYTp1I7OpfHnbVSL
One of the focus areas of the EwF project is the Tien Shan, especially the northern part of the mountain range in Kyrgyzstan and Kazakhstan. Here we can study how the continents deform as a far-field effect of the convergence between India and Eurasia. We investigate how the shortening is accommodated across the Tien Shan mountains and their forelands – Is the convergence widely distributed or rather localised on a few major structures? Which faults play a role in the regional tectonics and what can we say about their earthquake activity? What is the seismic hazard? What is the role of strike-slip faulting vs. thrust faulting? What do our observations tell us about the structure of the lithosphere?
The northern Tien Shan has experienced a series of severe earthquakes about one century ago. The two strongest ones were the 1889 Chilik Earthquake and the 1911 Chon Kemin event. We investigated the source area of the Chilik Earthquake in our past field campaigns, we mapped the surface ruptures remotely and on the ground, and we excavated the fresh fault scarp to find out about past earthquakes. Our results were now published in JGR – Solid Earth:
Austin Elliott stands on the scarp of the 1889 earthquake near Saty.
Our colleagues from Kazakhstan, Kyrgyzstan, Germany, and Arizona also published some great new studies on the tectonics of that region:
We are looking forward to some exciting joint field campaigns this summer!
Oxford University kindly hosted the COMET Topography Workshop from 31 March to 1 April, 2016. The workshop was all about high-resolution topography data derived from stereo satellite imagery and Structure-from-Motion. Aim was to provide practical training with the ERDAS Imagine and Agisoft Photoscan softwares, to discuss best practice and to talk about strategies and problem solving. The event was mainly organized by Austin Elliott, lectures were given by Austin, Yu Zhou, David Mackenzie, John Elliott (all from Oxford), and by Ramon Arrowsmith from Arizona State University.
 High-resolution topography data are extremely useful for many earth science disciplines including volcanology, sedimentology, hydrogeology, and earthquake geology. In the EwF project we regularly use stereo satellite data to produce digital elevation models (DEM) of rather large areas (>100 km²). These DEMs enable us for example to detect fault scarps, to measure offsets of geological features, to analyse tectonic morphology, and to reveal drainage response to tectonic deformation. In most cases we make use of Pléiades or SPOT imagery, but there are even more satellites that collect stereo images such as WorldView or GeoEye. In case of Pléiades, the DEMs can have up to 1 m resolution. Our target areas include Iran, Kyrgyzstan, and Kazakhstan.
Example of a high-resolution DEM of a fault scarp in Kazakhstan.
For smaller areas and even higher resolution DEMs we use helium balloons/helikites and drones. Typical targets are fault scarps and earthquake surface ruptures, river terraces, small-scale folding and small outcrops. For EwF we applied these methods to Kyrgyzstan and Kazakhstan.
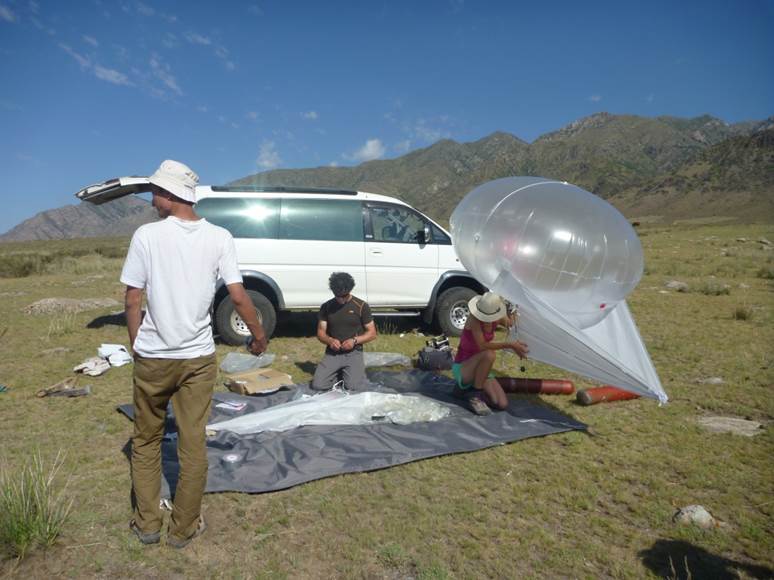
Our helikites usually operate around 50-80 m above ground and are dragged by a fishing line. The attached compact camera takes hundreds or thousands of aerial images which are then used to produce DEMs from Structure-from-Motion photogrammetry.
A great source for high-resolution topography data is OpenTopography, a website hosted by Ramon Arrowsmith and his team (funded by the NSF). Here you can currently find a huge collection of LiDAR data, but they will add stereo satellite DEMs and Strcuture-from-Motion data in the future. OpenTopography also hosts the SRTM3 and SRTM1 data.
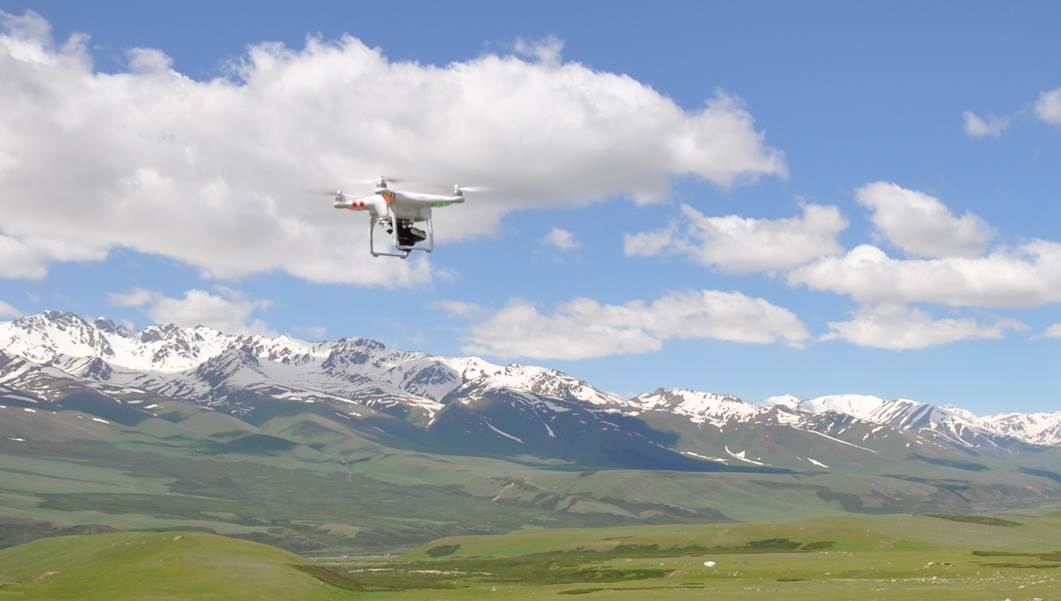
A small, battery-powered drone with an attached compact camera on its flight across a fault scarp in Kyrgyzstan.
The Tien Shan in Central Asia is one of the largest mountain belts on Earth, stretching for more than 1500 km. Its ongoing deformation is driven by the collision of India with Eurasia. Some of the strongest intracontinental earthquakes that we know about have hit the region around one hundred years ago and large thrust faults take up much of the active shortening.
Several major strike-slip faults are known in the Tien Shan as well. Among them is the Dzhungarian Fault, a NW-SE striking right-lateral structure that forms one side of the famous Dzhungarian Gate. The fault reaches from Eastern Kazakhstan into China and has a length of several hundreds of kilometres. There are no reports of historical earthquakes on this fault, although there is some debate whether or not the Chinese part ruptured in an earthquake in 1944. Recently, Campbell et al. (2013) studied the Dzhungarian Fault, measured a Late Quaternary slip rate, and found clear morphological hints for Holocene movement. Now an EwF team conducted further field work to continue the investigations on the earthquake history and the slip rate of this impressive feature.
A series of great earthquakes struck the northern Tien Shan around one century ago. In 1887, an earthquake (M>7) flattened the city of Verny, today’s Almaty. One of the strongest continental quakes that we know about hit two years later. With a magnitude of ~M8.3 the 1889 Chilik earthquake occurred in between Lake Issyk Kul and the Ili Basin. Finally, in 1911 the Chon-Kemin Earthquake struck north of Issyk Kul. This event is also estimated to have exceeded M8.
A few months ago, an EwF team conducted field work in the epicentral area of the 1889 Chilik earthquake. We aimed to investigate potential surface ruptures associated with this event and to measure the slip rate of the causative fault.
In June 2015 an EwF team of UK and Kyrgyz scientists went to Kyrgyzstan to conduct field work in the Suusamyr valley. An earthquake of magnitude MS7.3 happened there in 1992, leaving more than 70 people dead. Several aftershocks exceeded magnitude 6. This thrust earthquake is interesting because it produced intense and widespread secondary earthquake environmental effects (landslides, rockfalls, secondary ruptures, mud eruptions, etc.), but remarkably short primary surface ruptures only. Little is known about the causative fault and other active faults in the area, which is why we decided to have a closer look. (more…)
Please note: this is an updated landslide density map that includes, for the first time, landslides triggered by both the 25 April 2015 Gorkha earthquake and the 12 May 2015 Dolakha earthquake. It should be read in conjunction with previous posts on the effects of the 25 April Gorkha earthquake.
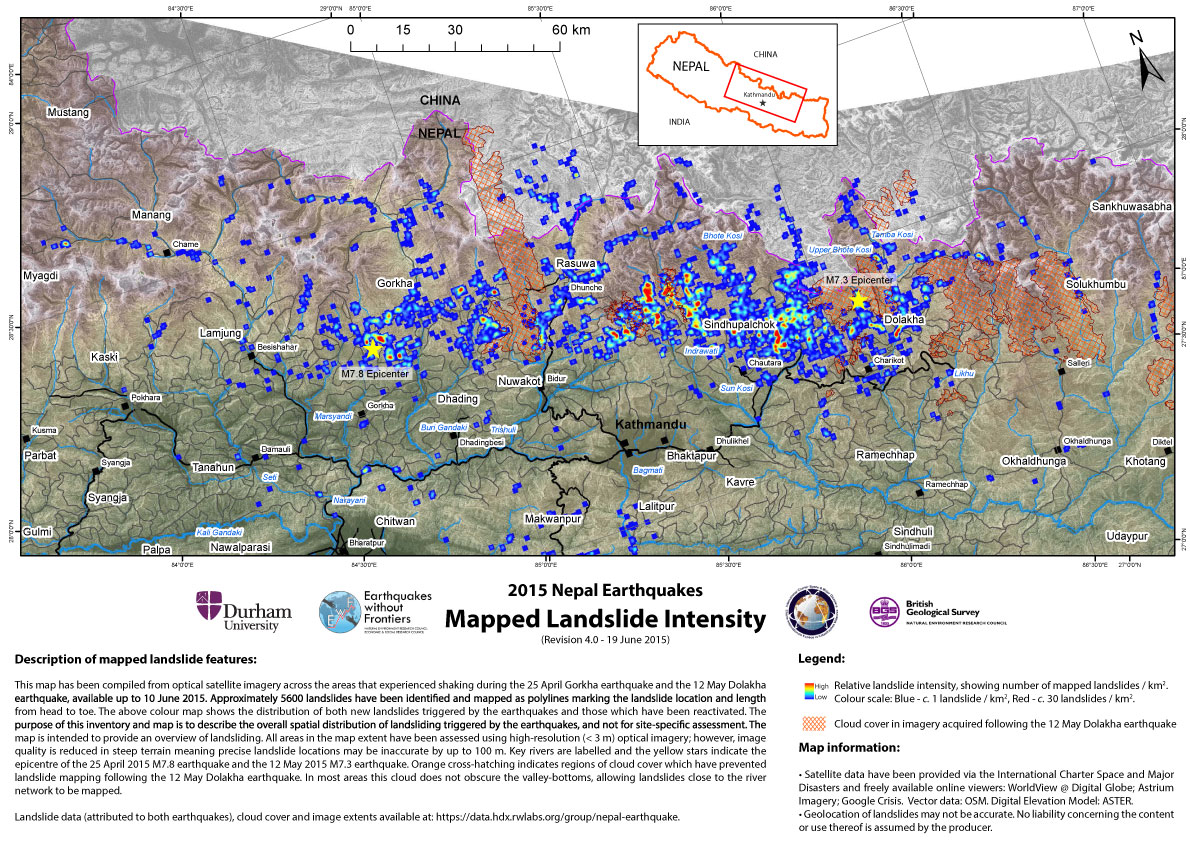
Key messages (all observations based on available cloud-free satellite imagery):
Background and methodology
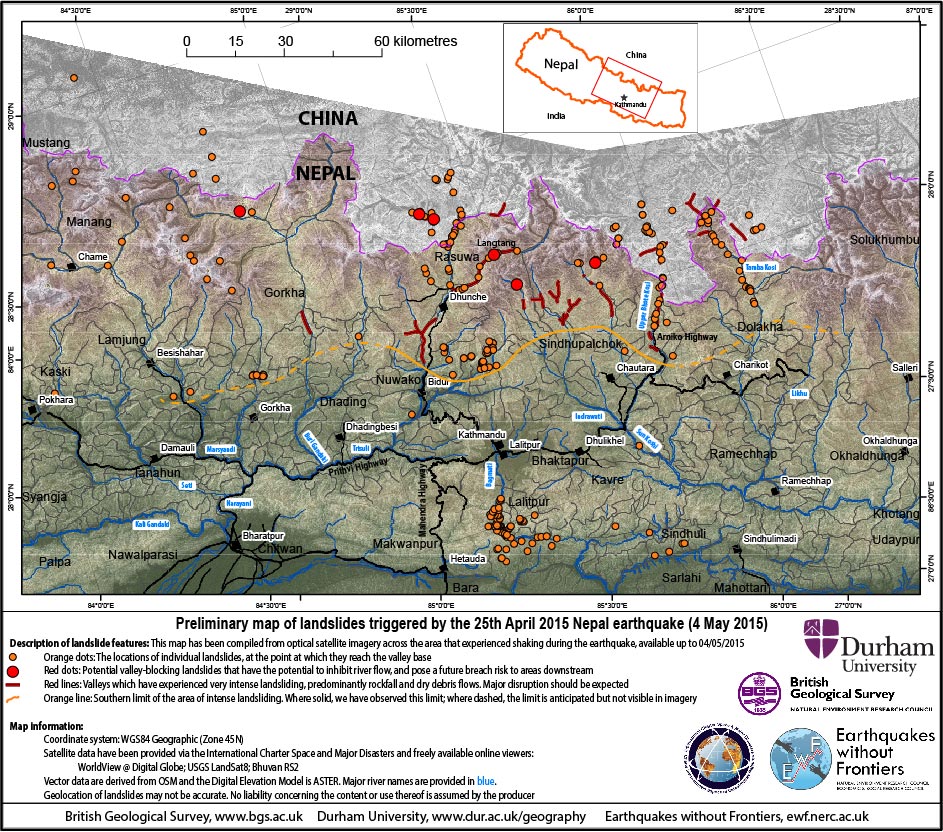
The purpose of this inventory and map is to describe the overall spatial distribution of landsliding triggered by the Gorkha earthquake sequence in April-May 2015, not for site-specific assessment. The image quality is low in steep terrain, meaning that precise landslide locations may be inaccurate by up to 100 m. The landslides have been identified and mapped using optical satellite imagery across the area that experienced shaking during the entire earthquake sequence, up to and including 19 June 2015, in addition to some reports from the ground where available. All landslides have been mapped as lines that start at the landslide head or upslope margin, and trace the landslide path to its toe. The colour on the map shows the number of mapped landslides per km2, ranging from 1 to a maximum of 29, to illustrate regional landslide intensity. Key rivers, valleys and roads are labelled, and the yellow stars indicate the epicentres of the Gorkha (Mw 7.8) and Dolakha (Mw 7.3) earthquakes.
All landslide data can be freely downloaded from ftp://topdog.dur.ac.uk/njr/nepal_eq/UPDATE_20150622/. Both high-resolution and low-resolution maps (in colour and B&W) available as PDF files. We have also posted the following shapefiles for use in ArcGIS:
(1) ‘Possible_Monsoon2014’ shows landslides which are considered likely to have been caused by either the Gorkha or Dolakha earthquakes, but where pre-EQ imagery is only available prior to the 2014 monsoon
(2) ‘Nepal_EQ_Landslides’ shows all mapped landslides which occurred as a result of the 2015 Nepal earthquake sequence.
(3) ‘150618_ImagePolygons’ shows the image extents used in mapping landslides following the 12 May Dolakha earthquake
(4) ‘150618_DolakhaCloud’ shows areas which remain obscured by cloud and unmapped since before 12 May, but were mapped between 27 April and 12 May
(5) ‘150618_TotalCloud’ shows areas which remain obscured by cloud and unmapped since before 27 April 2015
Details of each file are also available in the shapefile metadata.
.
Satellite data have been provided via the International Charter Space and Major Disasters and freely available online viewers: WorldView @ Digital Globe; USGS LandSat8; Bhuvan RS2; Astrium Imagery; Google Crisis. Vector data: OSM. Digital Elevation Model: ASTER.
Regional update:
Siwalik and Lesser Himalayan regions
High Himalayan region
Entire earthquake affected region
Recommendations
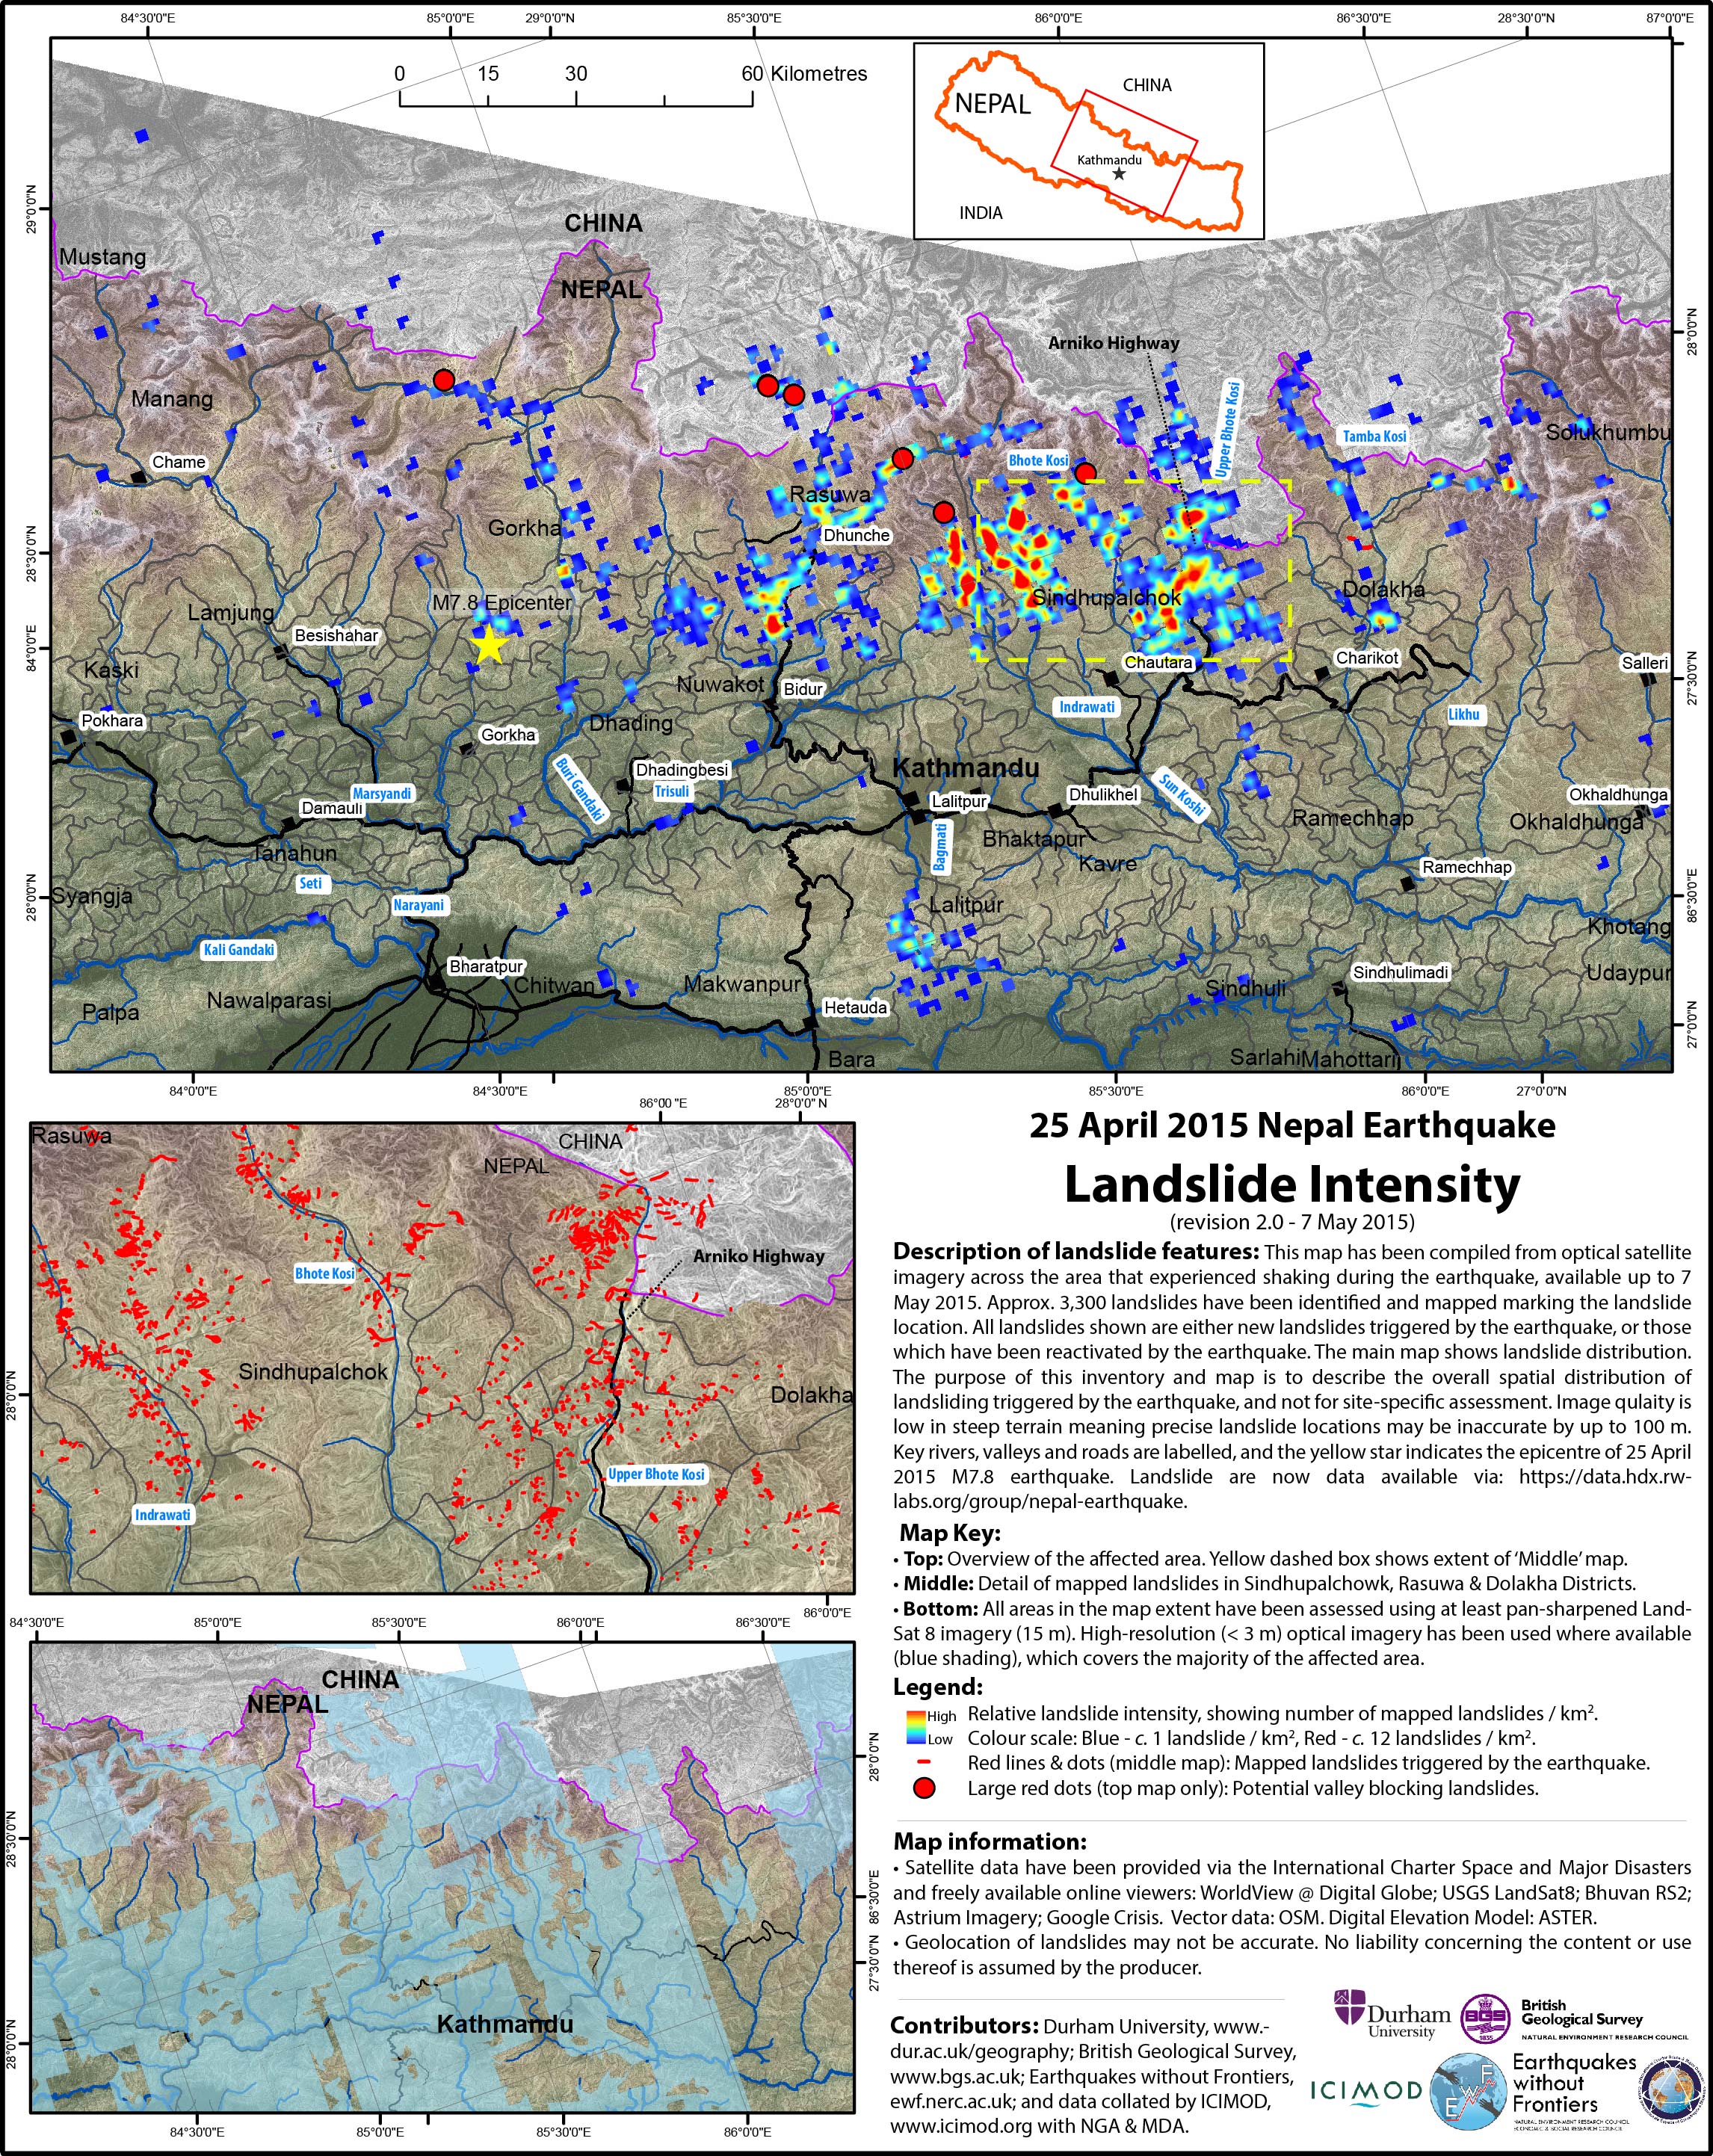
Please note: This is an updated landslide density map following the 25 April earthquake in Nepal. The inventory does not yet include failures triggered or reactivated by the 12 May 2015 earthquake.

Key messages (all observations based on available cloud free satellite imagery):
Background and methodology
The purpose of this inventory and map is to describe the overall spatial distribution of landsliding triggered by the earthquake, not for site-specific assessment. The image quality is low in steep terrain meaning precise landslide locations may be inaccurate by up to 100 m. The landslides have been identified and mapped using optical satellite imagery across the area that experienced shaking during the 25 April Gorkha earthquake, available up to and including 21 May 2015, in addition to some reports from the ground where available. All landslides have been mapped as lines that start at the crest and trace the landslide path to its toe. The colour on the map shows the frequency of mapped landslides per km2, ranging from 1 to a maximum of 29, to illustrate the region wide landslide intensity. Key rivers, valleys and roads are labelled, and the yellow star indicates epicentre of 25 April 2015 M7.8 earthquake.
Landslide data can be downloaded from: https://data.hdx.rwlabs.org/group/nepal-earthquake.
Satellite data have been provided via the International Charter Space and Major Disasters and freely available online viewers: WorldView @ Digital Globe; USGS LandSat8; Bhuvan RS2; Astrium Imagery; Google Crisis. Vector data: OSM. Digital Elevation Model: ASTER.
District level landslide maps
The individual landslide features mapped are also provided on District level maps for:
All maps, and the current landslide shapefile (23.05.15), are available to download from the following website: ftp://topdog.dur.ac.uk/njr/nepal_eq/UPDATE_20150522/
Regional update:
Siwalik and Lesser Himalayan regions
High Himalayan region
Entire earthquake affected region
Landslides and major roads
Recommendations
British Geological Survey and Durham University
11:20 BST Tuesday 12 May 2015
Key messages (all observations based on available cloud free satellite imagery)
Status
Until satellite imagery become available, we are using social media to monitor reporting of landsliding in the wake of this morning’s large aftershocks (M 7.3, M 5.6, and M 6.3) to the 25 April Gorkha earthquake. The 12 May aftershocks occurred at the eastern edge of the ‘patch’ that slipped on 25 April, directly beneath the area that was most affected by landslides triggered in the 25 April earthquake. The epicentre of the largest earthquake today (M 7.3) earthquake is located at Bigu (27.84°N 86.08°E), some 18 km SE of Kodari.

Figure 1. Location of epicentres and landslide distribution (until 11 May 2015).
The region affected by elevated Peak Ground Acceleration (PGA) is much smaller than that of the Gorkha earthquake, with a focus on mid-elevation slopes (between 2000 and 4000 m altitude) in Sindupalchowk, Dolakha and Ramechhap districts (Figure 2).
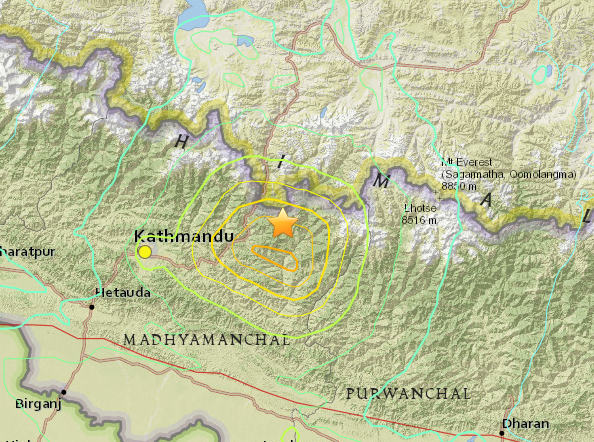
Figure 2. Peak ground acceleration (PGA) map (USGS) from the M 7.3 earthquake on 12 May (source: http://earthquake.usgs.gov/earthquakes/eventpage/us20002ejl#general_map), illustrating where landsliding may be expected
The area of Sindhupalchowk, Dolakha, and Ramechhap districts suffered from widespread rockfalls and debris avalanches. These landlslides were extremely common across parts of the landscape, and ran out long distances from their sources to the valley floors. They had devastating impacts on villages and road networks throughout the area.
Because rock slopes were weakened in the Gorkha earthquake, we expect that the large earthquakes on 12 May will trigger many additional landslides – potentially as many again as were triggered on 25 April. These landslides are likely to be similar in type and size to those in the Gorkha earthquake, and the areas that were most affected by the Gorkha earthquake are again likely to have the largest landslide impacts today.
Additional landslides in this area have already been reported on social media. Until satellite images are available, it must be assumed that the Arniko Highway and other transport corridors (e.g., roads in the Tama Koshi valley, and roads into Bhimeshwor) will be blocked by additional landsliding this morning.
Possible effects on Sun Koshi landslide dam
The large Sun Koshi landslide dam, which formed in 2014, did not appear to be affected by the 25 April earthquake; there were no obvious changes to the dam itself, or to the water level behind the dam. We have recently acquired high-resolution imagery of the dam, taken between 25 April and 12 May, that appears to show some areas of cracking on the hillsides above the dam. This may indicate damage to the rock around the margins of the Sun Koshi landslide, which would increase the risk of further landslides onto the dam. It has not yet be possible to obtain field confirmation of this, however.
The 12 May earthquakes have raised the hazard at the Sun Koshi landslide dam for two reasons:
It is extremely important that the dam and surrounding hillsides are checked for damage as soon as possible, and the Arniko Highway closed to through traffic if additional signs of instability are found. It is also imperative that that the water level in the lake is monitored over the next 7-10 days to check for leakage caused by shaking on 12 May and to watch for signs of catastrophic failure.
Alex Densmore, Tom Dijkstra, Colm Jordan, Vanessa Banks, Nick Rosser, John Rees, Gareth Jenkins and Jack Williams
सीमारहित भूकम्प परियोजना – Earthquake Without Frontiers – 28 April 2015
With thanks to Gopi K. Basyal, NSET-Nepal for translating this post.
गत अप्रिल २५, २०१५ मा गएको भूकम्पले गर्दा ठॉउ ठॉउमा पहिरोका घटना र त्यसको असरहरु प्रष्ट रुपमा देख्न सकिन्छ । भूकम्पजनित पहिरोको फैलावट र असर देखिएपनि प्रभावित समुदायका लागि राहत र प्रतिकार्यका क्रियाकलापहरु पहिलेदेखि नै शुरु भैसकेको छ र केही दिन सम्म रहिरहने छ । यसै सन्दर्भमा राहत र प्रतिकार्यमा तल्लीन आपतकालीन योजनाकार लगायत अन्य संघ–संस्थाहरुलाई सहयोग पु¥याउने उद्धेश्यले यो निर्देशिका तयार गरिएको छ । उपलब्ध भू–उपग्रहका नक्साहरु, पहिरोका लागि प्रक्षेपित विभिन्न मोडेलहरु, र सन २००५ मा पकिस्तानमा गएको कश्मीरको भूकम्प साथै सन २००८ मा चीनमा गएको वेनचुनको भूकम्पवाट प्राप्त अनुभवको आधारमा यो निर्देशिका तयार गरिएको छ ।
सामान्य प्रारुप: समग्र भूकम्प प्रभावित क्षेत्रमा हुनसक्ने पहिरोको संवेदनशीलतालाई मध्यनजर गरी पहिरो संवेदनशीलता नक्सा र यससँग सम्वन्धित व्याख्याहरु तलको वेवसाइटमा हेर्न सकिन्छ ।
http://ewf.nerc.ac.uk/2015/04/25/nepal-earthquake-likely-areas-of-landsliding/ / http://blogs.agu.org/landslideblog/2015/04/26/nepal-earthquake-2/
वेवसाइटमा राखिएका मोडेलहरु बृहत रुपमा सामान्यीकृत गरिएका छन,त्यसकारण यसै नक्साको आधारमा स्थान बिशेष घटन सक्ने स–साना पहिरोको घटनाहरुलाई ऑकलन गर्न सकिदैन । तरपनि यो नक्साले नेपालको कुन–कुन क्षेत्रमा पहिरो जान सक्छ भनेर विचारहरु प्रदान गर्दछ ।
मुख्य मुख्य परिणामहरु:
राष्ट्रिय स्तरका विभिन्न साझेदार निकायहरुले पहल गरेका खण्डमा यी मोडेलहरुलाई पुनः परिष्कृत पनि गर्न सकिन्छ अथवा कुनै स्थान बिशेषको लागि भनेर नया मोडेलको पनि विकास गर्न सकिन्छ । तर पनि यी मोडेलहरुको आधारमा कुनै स्थान विशेष घटन सक्ने पहिरोको ऑकलन गर्न सकिदैन । प्रारम्भिक भू–उपग्रह नक्साङकनले मोडेलले प्रस्तुत गरेको पहिरो भन्दा केही कम पहिरोहरु हुन सक्ने देखाउछ । तर यो दिनसम्मको भू–उपग्रह नक्सामा केही विविधता छ । यी नक्साहरुमा केही अस्पष्टता, बादलका धब्बाहरु देखिने र केवल एउटा मात्र पहाडी श्रृंखला देखिन्छ । त्यस क्षेत्रको विस्तृत जानकारी उपलब्ध हुन सकेको छैन , तर पनि नक्साङन गर्ने कार्य भैरहेको छ । वेनचुन चीनको भूकम्प ले के देखाउछ भने भूकम्पले गर्दा पहाडी भिरालो भाग कमजोर हुन जान्छ, त्यसकारण भूकम्पको केही दिन वा महिना दिन सम्म पनि पहिरोको घटनाहरु घटन सक्ने सम्भावना हुन्छ । बिशेषगरी मनसुनमा वा ५ म्याग्निच्यूड भन्दा ठुलो पराकम्पनको बेला पहिलेनै पहिरो गएको स्थानहरुमा बढी मात्रामा पहिरो झर्न सक्ने देखिन्छ । बर्षाले गर्दा भएको पहिरो अत्याधिक तिब्र गतिमा साथै अनिश्चित दिशामा बहने गर्दछ ।
पहिरो बॉध
धेरैजसो पहिरो निर्मित बॉधहरु केही दिनमै भत्किन्छन । अतः यस्ता बॉधहरु कुन–कुन ठॉउमा अवस्थित छन र कुन गतिमा भरिएका छन भनेर सजिलै अनुमान गर्न सकिदैन । यसका लागि पहिरोको बॉध र पानीको सतहको आवधिक रुपमा गरिने मापन सान्दर्भिक हुदैन । उपलब्ध सूचना तथा जानकारीको आधारमा यो परिकल्पना गर्न सकिन्छ कि, पहिरोको बॉधले भूकम्पको केन्द्र र काठमाडौं उपत्यकाको बीच भएर बग्ने नदी तथा सहायक नदीहरुलाई तालको रुपमा परिणत गरिदिएको छ । प्रत्यक्ष अवलोकनको आधारमा यस्ता बॉधहरुले बिशेषगरी ः– पानीको मात्रा र स्वतन्त्र रुपमा बहने पानीको बहावलाई घटाईदिएको हुन्छ अथवा सामान्य रुपमा देखिने पानीको रंगमा समेत परिवर्तन ल्याइदिने गर्दछ । तसर्थ नेपालमा बहने नदीनाला, पानीको मात्रा, यसको गति र हुनसक्ने परिवर्तन नियमित रुपमा अनुगमन गर्नुपर्दछ । -http://hydrology.gov.np_
पहिरोको बॉध भत्किएर हुने असर बॉधको उचाई र यसवाट निर्मित तालमा भर पर्दछ । सामान्य नियम अनुसार जव सम्म बॉधको माथिल्लो भागमा बाढीको सम्भावना देखिदैन तवसम्म बॉधको आधार र नदीको बहावमा परिवर्तन हुदैन । अन्य अस्थायी संरचनाहरु निर्माण गर्दा सके सम्म पानीको सतह देखि माथि र पानीको बहावदेखि टाढा निर्माण गर्नु पर्दछ । अन्य संरचनाहरु निर्माण गर्दा सकेसम्म मुख्य बहावदेखि कम्तीमा १० मि. भन्दा बढीको उचाईमा मात्र निर्माण गर्नुपर्दछ । पहिरोको बॉध निर्माण गरिएको संरचना देखि तल्लो भेगमा अवस्थित जन–समुदायले यादि बॉध फुटेर बाढी आईहालेमा के गर्ने भनेर पहिलेनै स्पष्ट निति नियमहरु बनाई राखेमा जोखिमलाई केही हदसम्म घटाउन सकिन्छ ।
सञ्चालन निर्देशिका
अस्थायी संरचनाहरु जस्तै अस्थायी घरहरु, अस्पताल, यातायात आदि पहिरोले क्षति पु¥याउन नसक्ने क्षेत्र, सम्भावित बाढीबाट क्षति नहुने क्षेत्र साथै मनसुनमा पानीको मात्रामा हुन सक्ने उतारचढाव र पहिरोको कारण नदीको आधारमा थुप्रिन सक्ने भग्नावशेषलाई मध्यनजर गरी निर्माण गर्नुपर्दछ । सामान्य केही निर्देशनहरु यस प्रकार रहेका छन ,
जोखिम
यदि थप पहिरोहरु आउने सम्भावना भएमा, त्यस क्षेत्रमा काम गर्ने कामदारहरुलाई के–के गर्ने भनेर स्पष्ट जानकारी हुनुपर्दछ ।
आगामी कदमहरु
हामी अहिले भूकम्प प्रभावित क्षेत्रमा हुन सक्ने पहिरो र सम्भावित पहिरोको बॉधहरुको बारेमा नक्सांकन गर्न इउतष्अब िर च्बमबच भू–उपग्रह नक्साको संकलन गर्ने कार्य गरिरहेका छौं । ती नक्साहरु उपलब्ध हुने बित्तिकै यो निर्देशिका लाई परिमार्जन गरेर प्रस्तुत गरिनेछ ।
Alex Densmore, David Milledge, David Petley, Nick Rosser, and Katie Oven
British Geological Survey, Durham University, ICIMOD, NASA, and University of Arizona
Please note: A higher-resolution version of the map, and black-and-white versions, are available from: ftp://topdog.dur.ac.uk/njr/nepal_eq/UPDATE_20150508/
Key messages (all observations based on available cloud free satellite imagery)
Background and methodology
The UK mapping team has worked to three objectives that were defined by the UK Department for International Development: identification of large landslides (1) blocking valleys and potentially causing significant secondary hazards; (2) affecting villages, and (3) disrupting other infrastructure, such as roads. The team has undertaken a thorough investigation of available satellite imagery from multiple sources.
Landslide observations have been interpreted from satellite imagery by highly-experienced geoscientists. If additional data have been included (e.g. Tomnod crowd-sourced information on damage) they have been clearly identified on the database and on the maps.
The satellite imagery has been sourced from the International Charter Space and Major Disasters as well as directly from data providers. Pre- and post-earthquake imagery was used to ascertain that landslides were active post-earthquake; i.e. either there was no landslide present on the landscape pre-earthquake or the pre-existing landslide had moved visibly on the imagery since the earthquake.
The coverage, detail and quality of the landslide inventory are primarily determined by the available imagery. The main challenge has been to obtain cloud-free optical imagery and activities are still ongoing to source these data. The imagery has been investigated at 1:5,000 to 1:10,000 scales (with smallest features that can be distinguished ranging from about 5 to 15 m). The image spatial resolution ranged from 2 m to more than 22 m – some images were greyscale (panchromatic) while others were colour (multispectral). At 22 m resolution it is only possible to distinguish major events (larger than ~100 m on the ground) and the detail is not available to ascertain if they are solely associated with the earthquake or are part of the natural landscape processes in the area.
The team has obtained access to satellite imagery covering c.55,000 square kilometres with approximately 25% cloud-free (figure 1). Analysis of imagery from the high Himalayas by the Charter Project Manager’s institution (NRSC-ISRO) has also been evaluated by the UK team.
The imagery was loaded into a Geographic Information System (GIS) and points / lines /polygons digitised on screen, directly onto the imagery. In some cases it was not possible to obtain the satellite imagery but they could be viewed on the supplier’s web portal, in which case the landslide information was traced out on the portal and transferred by eye to the GIS. Maximum uncertainties on landslide locations are ~100 m, but vary across the area depending on the type of imagery used.
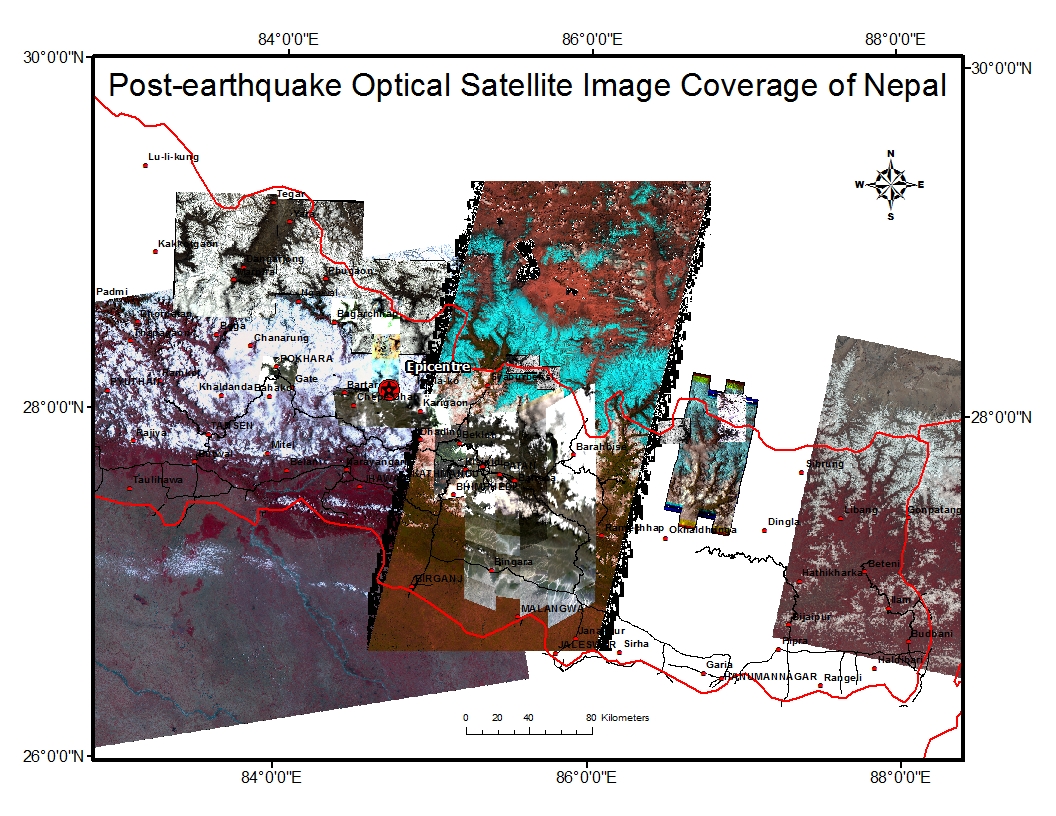
Figure 1. Post-earthquake optical satellite imagery of Nepal (current to: 7 May 2015)
We summarise some preliminary conclusions:
Siwalik and Lesser Himalayan regions
High Himalayan region
Entire earthquake affected region
Landslides and major roads
The Arniko Highway (north to Tibet) is reported to be blocked from near Chaku to the Tibetan border by numerous rockfalls. This area has had chronic landslide problems prior to the earthquake, and the road is regularly impassable during the monsoon. The pre-existing Sun Koshi landslide dam that crossed the Arniko Highway at Jure appears intact.
The Prithvi Highway (the main route from Kathmandu south to India) has also experienced ongoing landslide problems since the earthquake, including large rockfalls onto the road. This road has suffered extensive landsliding in the past. In August 2000 a single landslide blocked the road for 11 days, leading to severe shortage of fuel and other commodities in the metropolitan area.
Recommendations
Vanessa Banks, Alex Densmore, Tom Dijkstra, Colm Jordan, David Milledge, John Rees, Nick Rosser, Jack Williams.
Appendix 1: List of confirmed or potential valley-blocking landslides
Note that the 2014 Sun Koshi landslide which cuts the Arniko Highway just upstream of the Bhote Kosi Hydropower plant, and the rock dam that it created, appear to be intact. The river and lake levels do not appear to have changed during the earthquake.
Appendix 2: List of valleys with relatively intense landsliding (including affected Level 4 Admin / VDCs)
Tama Koshi, north of the Tama Kosi Hydro Power construction site:
Upper Bhote Kosi, north of the townof Barhabise:
Bhote Kosi, north of Jalbire:
Valleys north of Melanchi, feeding into the Indrawati:
Dhunche north to the China border in Rasuwa District:
British Geological Survey, Durham University & University of East Anglia
1200 BST Tuesday 5 May 2015
**PLEASE NOTE: THIS MAP WAS UPDATED ON 8 MAY 2015. THE UPDATED MAP CAN BE ACCESSED HERE: http://ewf.nerc.ac.uk/2015/05/08/nepal-earthquake-update-on-landslide-hazard-2/ **
Please note: High and low-resolution versions of this map in both colour and black & white can be downloaded as PDF files from: ftp:\\topdog.dur.ac.uk\njr\nepal_eq
Key messages (all observations based on available cloud free satellite imagery)
Status
We were working to three objectives: identification of large landslides (1) blocking valleys and potentially causing significant secondary hazards; (2) affecting villages; and (3) disrupting infrastructure, such as roads. The team has undertaken a thorough investigation of available satellite imagery from multiple sources. The imagery has been investigated at 1:5,000 to 1:10,000 scales (with smallest features that can be distinguished ranging from about 5 to 15 m). Image resolution ranged from 2 m to more than 22 m. The team has obtained access to satellite imagery covering c.55,000 km2 with approximately 25% cloud-free. Analysis of imagery from the high Himalayas by the Charter Project Manager’s institution (NRSC-ISRO) has also been evaluated by the UK team.
We summarise some preliminary conclusions:
Siwalik and Lesser Himalayan regions
High Himalayan region
Entire earthquake affected region
Landslides and major roads
The Arniko Highway (north to Tibet) is reported to be blocked from near Larcha to the Tibetan border by numerous rockfalls. This area has had chronic landslide problems prior to the earthquake, and the road is regularly impassable during the monsoon.
The Prithvi Highway (the main route from Kathmandu south to India) has also experienced ongoing landslide problems since the earthquake, including large rockfalls onto the road. This road has suffered extensive landsliding in the past. In August 2000 a single landslide blocked the road for 11 days, leading to severe shortage of fuel and other commodities in the metropolitan area.
Recommendations
Appendix 1: List of confirmed or potential valley-blocking landslides
Note that the 2014 Sun Koshi landslide which cuts the Arniko Highway just upstream of the Bhote Kosi Hydropower plant, and the rock dam that it created, appear to be intact. The river and lake levels do not appear to have changed during the earthquake.
Appendix 2: Maps
High and low-resolution versions of the above map in both colour and black & white can be downloaded as PDF files from: ftp:\\topdog.dur.ac.uk\njr\nepal_eq
Vanessa Banks, Alex Densmore, Tom Dijkstra, Colm Jordan, David Milledge, Dave Petley, John Rees, Nick Rosser, Jack Williams
Katie Oven, Sam Jones, Alex Densmore and Dave Milledge
Just over a week ago, in a remote village in Dhankuta District in eastern Nepal, members of the EwF team were exploring with community members the actions that can be taken to make the community safer from earthquakes and their associated secondary hazards, particularly landslides. One activity involved a review of the community’s local disaster risk management plan, which was developed 18 months ago with support from DFID, CARE and local NGO HUSADEC. The EwF team, which includes our collaborators NSET-Nepal, were exploring how EwF could support the community to turn their plan into some concrete activities.
The area where the team was based was not unusual for Nepal: earthquakes were a low priority in comparison to more frequent, everyday hazards. Landslides and rockfalls were a notable problem in two of the wards, as was the problem of pests and diseases which impact the orange and ginger crops and cause the loss of up to 50% of annual cash crop production. Despite these and other livelihood priorities there was still an awareness of earthquake risk. For example, we were told about a boulder that had fallen during the 2011 Sikkim earthquake, landing just meters from the school. However, there was little sense of how villagers might prepare to minimise the impact of an earthquake.
In exploring with the local government and the community the potential role that science could play in community based disaster risk reduction, we acknowledged that stopping the landslides is not an option, but we could look to co-develop a low-tech approach to monitoring the slope to determine the areas likely to slide next. Mapping the boulder fields near the school and other populated areas could inform future planning, to ensure that key infrastructure is constructed in safer areas. With a relatively new road connecting the village with the nearby market town of Hile, the village now has a market for its cash crops which will bring more wealth to the village and, no doubt, the construction of more modern masonry and concrete buildings. To ensure that these new buildings are able to withstand an earthquake, NSET could, subject to funding, provide training in earthquake-safe construction.
So what?
As we look at the images of Nepal following Saturday’s earthquake, it is tempting to see these kinds of community-based initiatives targeting rural resilience as futile. Indeed, they will do little to help the worst-affected communities, for example, in the hill villages in Gorkha and Lamjung Districts in central Nepal. However, in areas that have been more moderately impacted by Saturday’s earthquake, local disaster risk management planning has the potential to make a significant difference to local level resilience. Example actions include: the stock piling of resources for use in emergency situations (this is common place in Nepal as part of the annual monsoon preparedness activities); first aid and light search and rescue training; raising awareness of the warning signs associated with secondary hazards, such as landslides and landslide dams; and the development of local level communication strategies to raise awareness of impending hazards downslope or downstream, so that appropriate actions can be taken. Regardless of the strength of government (which is weak in Nepal) and its ability to respond after a disaster, local capacity is the key to resilience in isolated mountain communities. By institutionalising the local disaster risk management planning process, Nepal is certainly on the right trajectory. It is essential that the Ministry of Federal Affairs and Local Development continues to embed this approach and invests resources in supporting local capacity building to demonstrate its long-term commitment to building a disaster resilient country.
Alex Densmore, David Milledge, David Petley, Nick Rosser, and Katie Oven
The extent and effects of landsliding triggered by the 25 April 2015 Nepal earthquake remain unclear. However, since relief and response activities have already begun, and will accelerate in the coming days, we have assembled preliminary guidelines for relief and response workers and emergency planners in Nepal. They are informed by initial models of landslide likelihood, some fragmentary mapping of available satellite imagery, and experience in the 2005 Kashmir (Pakistan) and 2008 Wenchuan (China) earthquakes.
General pattern
Landslide susceptibility maps for the entire region have been posted at http://ewf.nerc.ac.uk/2015/04/25/nepal-earthquake-likely-areas-of-landsliding/ and http://blogs.agu.org/landslideblog/2015/04/26/nepal-earthquake-2/, along with some initial interpretations. These models are highly generalized and should not be used as predictions of the occurrence of individual landslides; instead, they give an idea of the areas where landslides are most likely. A brief summary interpretation of the key results:
Landslide dams
Most landslide dams fail within a few days of filling; thus, it is critical to establish where they are located and how rapidly they are filling. Periodic measurements of water level relative to dam crest are invaluable. In the absence of information to the contrary, it should be assumed that landslide dams have formed in all of the major river valleys or tributaries draining the area between the epicentre and Kathmandu. Key observations that a dam has formed upstream include: decreased river flow independent of any changes in rainfall, or changes in colour – especially a muddier-than-usual appearance. Flow gauges in Nepal, if still serviceable, should be monitored for rapid changes in flow on all rivers : http://hydrology.gov.np/
The effects of a landslide dam failure depend on the height of the dam and the volume of the lake behind it. As a general rule, valley floors and river channels should be avoided until it has been confirmed that no possible cause for flooding (via failed landslide or hydroelectric dams) exist upstream. Any temporary infrastructure in the valley floor should be sited as high as possible and as far as possible from the channel; a minimum elevation of AT LEAST 10 m above the active channel is recommended. Risk should also be minimised by positioning a spotter at the landslide dam with a comms link to all VDCs downstream and a clear protocol for communities to move to higher ground if there is a dam failure.
Operational guidance
Temporary infrastructure (temporary housing, hospitals, roads, etc.) should be sited to avoid further landslide hazards, flooding from potential landslide dams, inevitable increased river flow in the monsoon, and (over a period of weeks to months) river bed deposition from landslide sediment. Some general guidelines include:
Exposure
If further landslides occur, it is important that exposed field workers are briefed on what to do:
Next steps
We are currently compiling optical and radar satellite imagery to map large landslides and potential landslide dams across the affected area. We will update these guidelines as those maps become available.
UPDATED 26 April 2015 to reflect new USGS ShakeMap results; this has resulted to some changes in the landslide susceptibility pattern in Tom Robinson’s model
The Mw 7.9 Nepal earthquake on 25 April 2015 appears to have occurred on a shallowly north-dipping thrust fault beneath the Himalayas of central Nepal. The steep topography and high relief in the area of the epicentre, and the high intensity of shaking that was felt, mean that thousands of landslides are likely to have been triggered by the earthquake. Based on past experience of earthquakes in steep mountainous terrain, like the 2005 Kashmir and 2008 Wenchuan earthquakes, some of these landslides will be large enough to create temporary dams across rivers in the area. The lakes created by these dams are particularly hazardous because they can drain without warning, usually within a few days of filling up, due to collapse of the unstable dam material.
Mapping the landslides will require satellite imagery taken after the earthquake. In the meantime, it’s useful to see what areas are likely to have been most affected by landsliding. The images below show the outputs of two different models of landslide susceptibility – that is, the probably that a landslide will have occurred in any particular place. Susceptibility in these models is determined by the intensity of the shaking (derived from the USGS ShakeMap estimates, http://earthquake.usgs.gov/earthquakes/eventpage/us20002926#impact_shakemap), the steepness of the topography, the position of a given location on a hillside (because shaking tends to be greater at the tops of ridges than in neighbouring valleys), and the aspect (the direction in which the hillside faces).
The first map was produced by Dr Tom Robinson of the University of Canterbury, New Zealand (http://www.geol.canterbury.ac.nz/People/students/Tom_Robinson.shtml), using a model that he developed with Dr Theo Kritikos and Prof Tim Davies. More details about the model are available at http://onlinelibrary.wiley.com/doi/10.1002/2014JF003224/abstract.
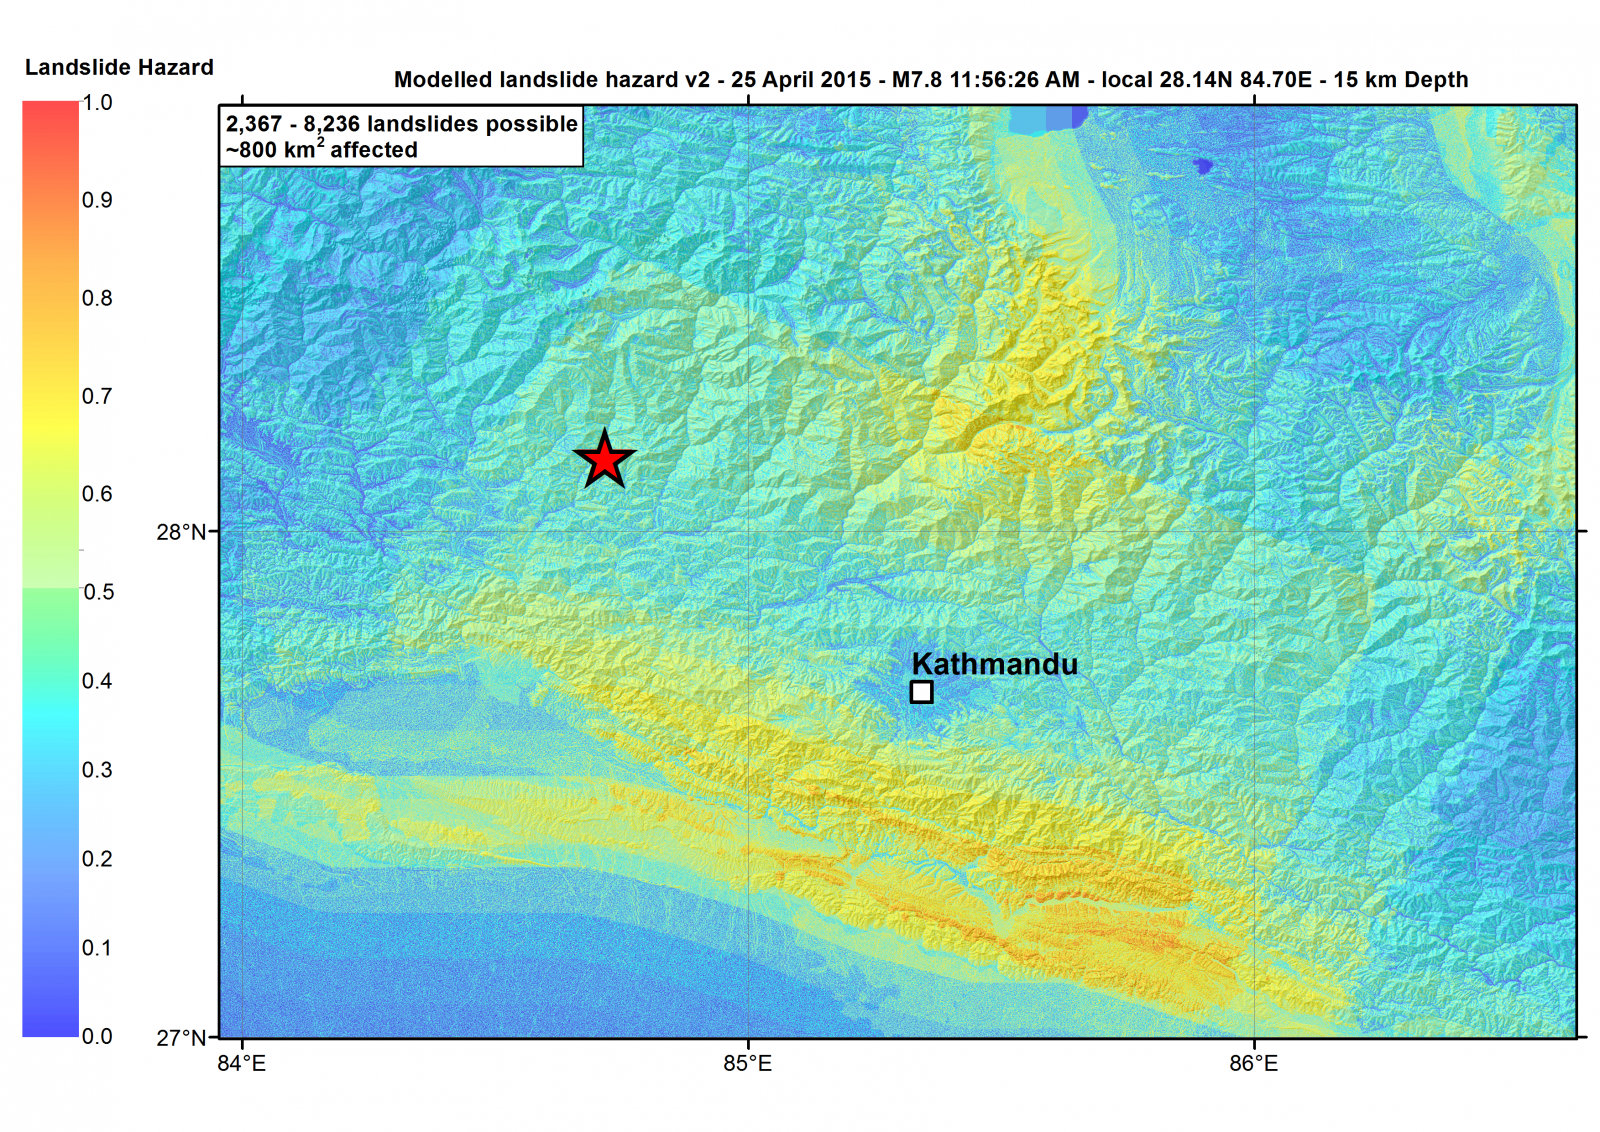 |
| Preliminary landslide susceptibility map created by Dr Tom Robinson (University of Canterbury). Susceptibility ranges from 0 to 1; higher numbers indicate a greater chance of landslides occurring at that point. Inset map shows the estimated earthquake intensities from the USGS ShakeMap. The Modified Mercalli Intensity values are VII in the epicentral area but up to VIII or IX in the Kathmandu Valley. |
The map shows that high landslide susceptibility values – and thus the greatest chance of landsliding – occur in the high Himalayas to the north of the epicentre and Kathmandu. This includes the major river valleys of central Nepal, including the Kali Gandaki, Marsyandi, and Trisuli Rivers, as well as parts of the Sun Kosi River catchment. These areas also have high relief between valley floors and ridge crests, meaning that landslides there are potentially large enough to block the valleys. There are also high values in the foothills south of Kathmandu. While relief in the foothills is somewhat smaller (up to about 1000 m), this area also includes the major roads from India and southern Nepal into the Kathmandu Valley. We have heard from colleagues at NSET that travel between Bharatpur (south of the epicentre) and Kathmandu is still very difficult, which would be consistent with these susceptibility patterns.
The second map was produced by Dr Rob Parker of Cardiff University (http://www.cardiff.ac.uk/earth/research-staff/dr-robert-parker/). It shows estimated landslide probability, where values closer to 1 indicate a greater likelihood that a landslide occurred at that location.
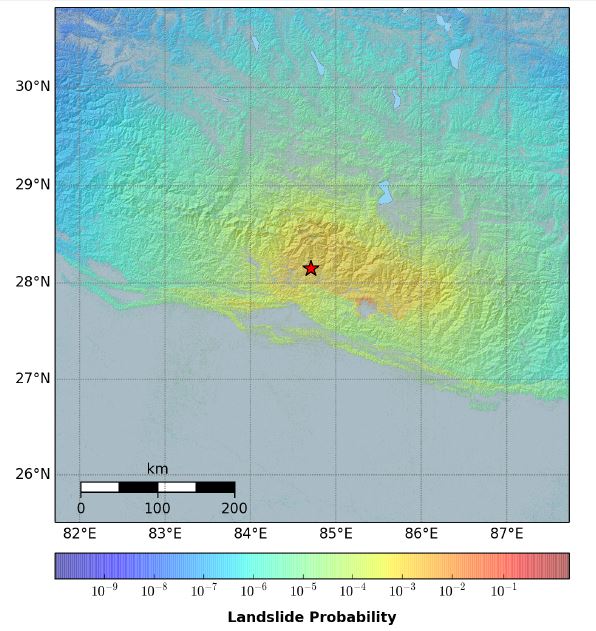 |
| Preliminary landslide susceptibility map created by Dr Rob Parker (Cardiff University). Probability values show the chance of a landslide occurring at that point. Inset map shows the estimated earthquake intensities from the USGS ShakeMap. The Modified Mercalli Intensity values are VII in the epicentral area but up to VIII or IX in the Kathmandu Valley. |
Again, the maps shows that landslides are most likely to have occurred north of the epicentral area and extends from about 84.5°E to 86.5°E. Landslides are also expected in the foothills, particularly north of the Chitwan Dun (the trapezoidal-shaped area of low elevation, to the south of the epicentre). Rob’s model estimates that the total area of landslides in that region is about 30 km2 (for individual failures larger than 1 ha or 10,000 m2). While that seems large, it is much smaller than area of landslides in the Mw 7.9 Wenchuan earthquake in China, which was about 396 km2 as mapped by Gen Li and colleagues (http://onlinelibrary.wiley.com/doi/10.1002/2013GC005067/full). This may be due to the fairly moderate intensity values of VII or less over most of the region between the epicentre and the Kathmandu Valley. Kathmandu itself seems to have experienced much greater intensities of VIII or IX – probably because seismic waves were amplified by the soft sediment fill within the valley. Despite this intense shaking, the risk from landslides within Kathmandu is small except on the edges of the valley itself.
It must be stressed that these are preliminary estimates, and that they are based on very generalised models. In particular, they depend heavily on the intensity estimates from ShakeMap, which are very uncertain, and will be refined over the next few days and weeks. As of this writing, there have been almost no reports of shaking or damage from the epicentral area, so the peak intensities are definitely underestimated by ShakeMap at the moment. As those increase, so too will the probability of landslides. The susceptibility maps also don’t tell us anything about the likely sizes of the landslides that have occurred, and whether or not they have blocked roads or river valleys. Nevertheless, they provide some ideas about where the hardest-hit areas of Nepal might be, and give us a way of focusing our attention and efforts in understanding the effects of the earthquake.
Three members of the EwF team represented the project at a recent workshop in Chengdu, China, hosted by NERC, ESRC, and the National Natural Science Foundation of China (NSFC). The workshop brought together about 50 researchers from the UK and China, and was aimed at scoping out a possible joint UK-China research programme on geohazards, with a particular focus on earthquakes in China. Lena Dominelli, Barry Parsons, and Alex Densmore presented different aspects of EwF, and put special emphasis on three specific developments: the close links that we are developing with the China Earthquake Administration, Hong Kong Polytechnic University, Gender Development Solutions (GDS), and World Vision; the advances that can be made by getting physical and social scientists together with stakeholders early in the research process; and the importance of viewing both hazard and vulnerability as changing in time, both before and after a large earthquake. It’s clear that the lessons learned so far in EwF, and in the Increasing Resilience to Natural Hazards programme more generally, are being learned from. Our sincere thanks to all the staff at RCUK-China, NERC, ESRC, and NSFC who worked so hard to make the workshop so successful – particularly Lesley Aspinall and Chris Franklin from NERC, Yao Yupeng from NSFC, and Eloise Mellor and Alexa Mills from the ESRC.
After the workshop, we spent a sobering day among the ruins of Beichuan, a small town in the Longmen Shan west of Chengdu that was devastated in the 2008 Wenchuan earthquake. A museum just outside the town preserves a view of the event and some of the stories of those who were caught up in it, while the town itself has been set aside as a memorial for the 8,000 residents who lost their lives. Prof Zhang Peizhen of the China Earthquake Administration was in Beichuan days after the earthquake and gave a valuable perspective on both the human and physical sides of the event.
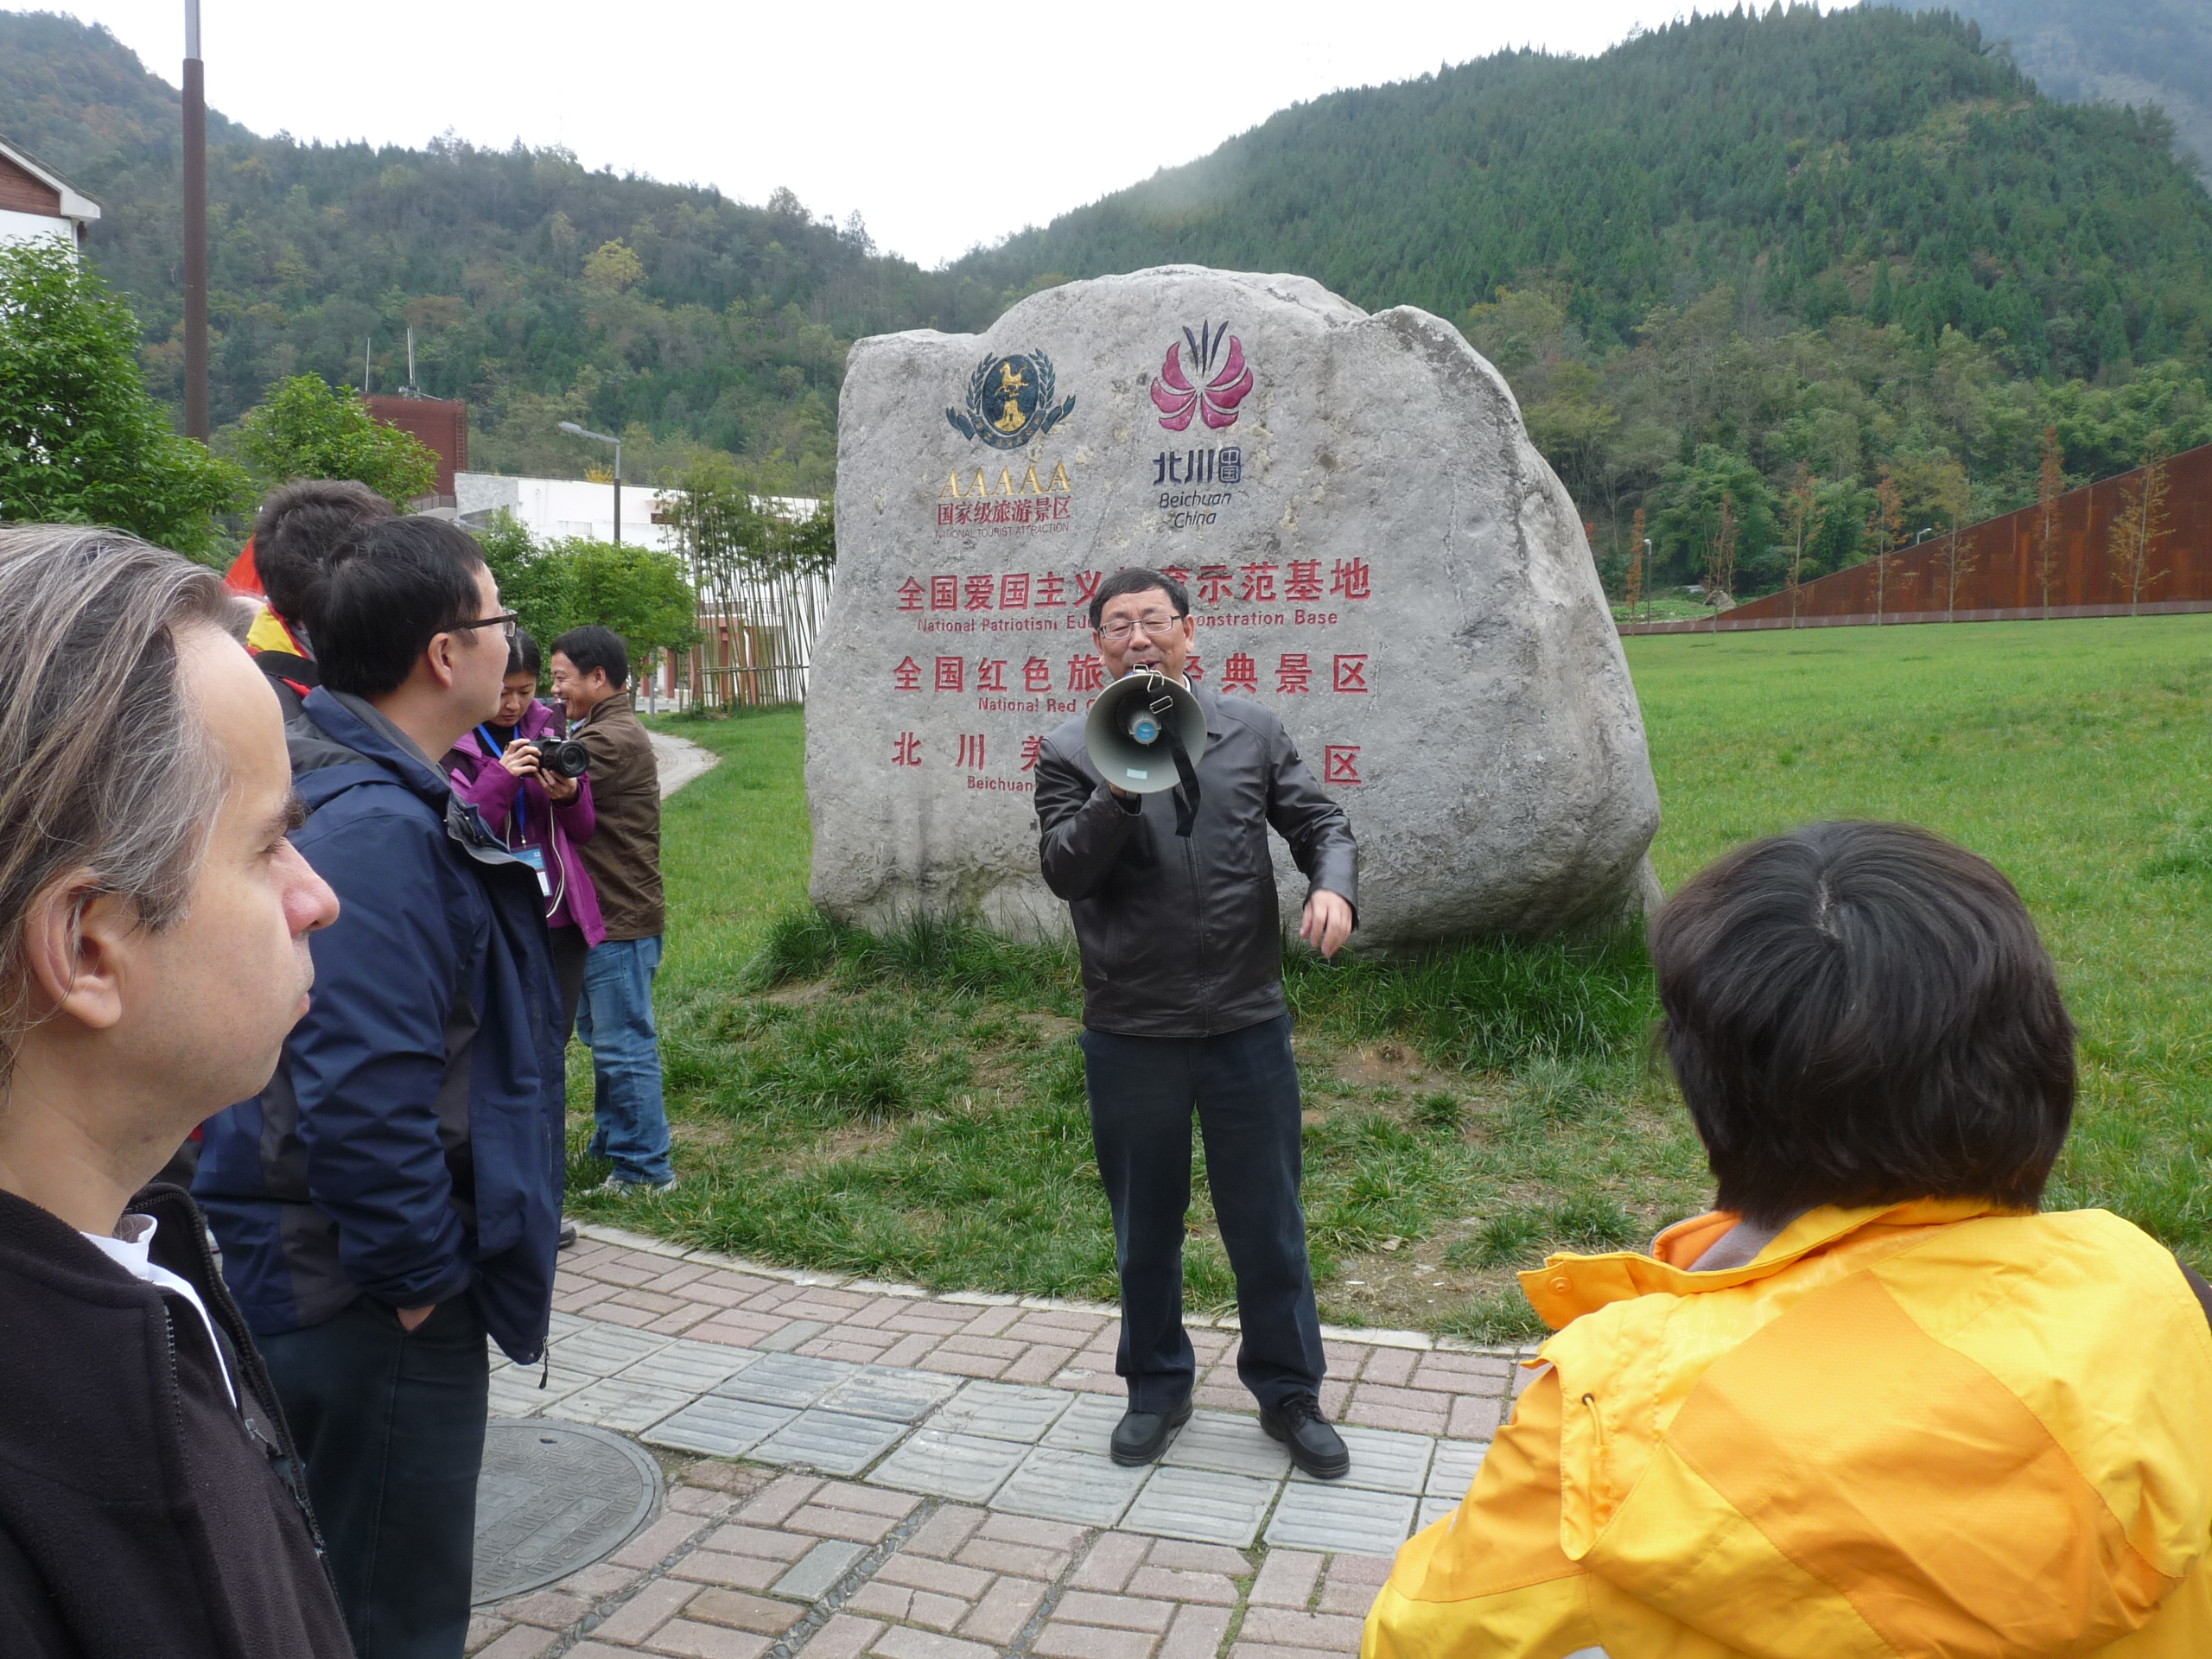
It was particularly striking to see first-hand the effects of the landslides that devastated both the northeastern and southwestern parts of Beichuan, as well as the post-earthquake influx of sediment that has buried parts of the ruined city by more than 20 m:
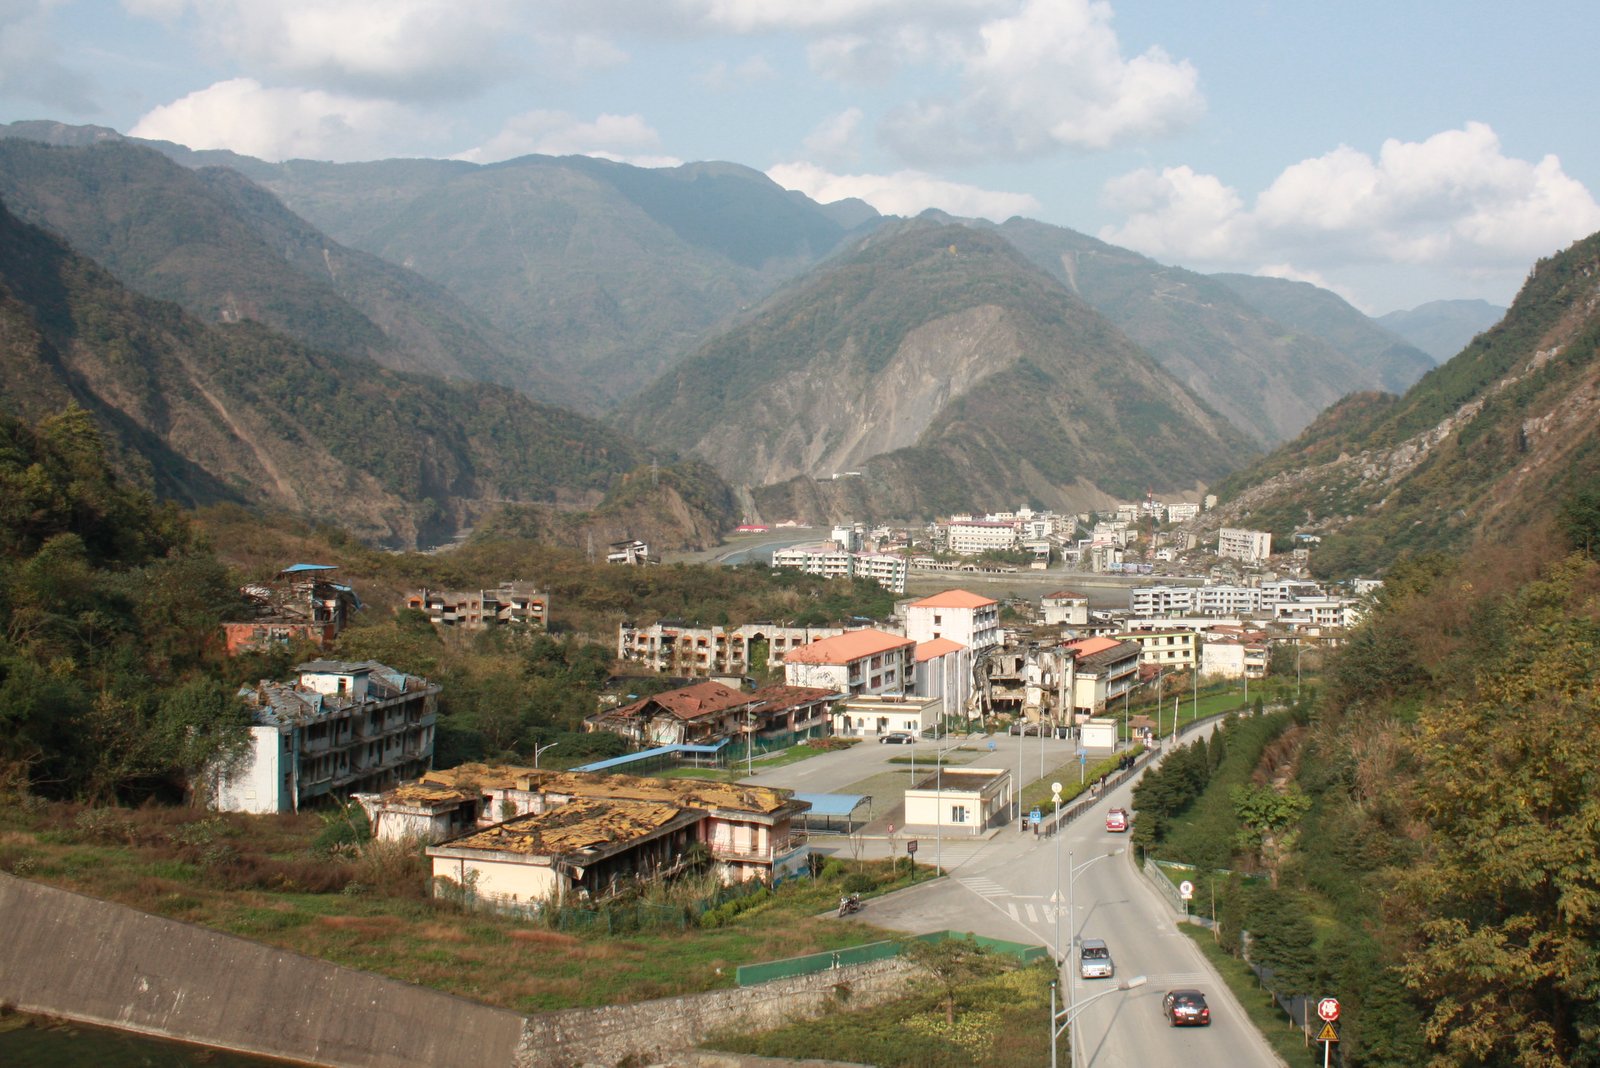
The team was impressed, and heartened, to see that survivable buildings can be, and were, built in Beichuan – not with any special techniques or materials, but with care and attention to building codes. More widespread application of those practices would undoubtedly have prevented at least some of the loss of life. The photo below shows a house that was built immediately adjacent to the largest surface rupture that occurred during the earthquake – more than 10 m of slip. Despite this enormous offset of the ground, and the intense shaking, the house was essentially undamaged:
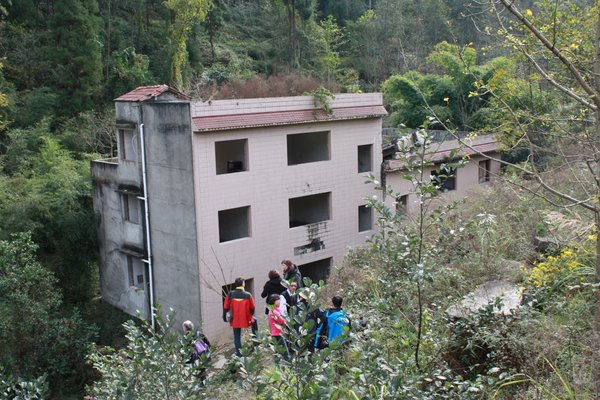
The next day, the EwF team, Zhang Jun of EwF partner organisation GDS, and representatives of NERC and ESRC visited Yingxiu, a town that has taken a very different path than Beichuan after the earthquake. Of the 12,000 residents in Yingxiu before the earthquake, more than 7,000 were killed, and most of the town was flattened.
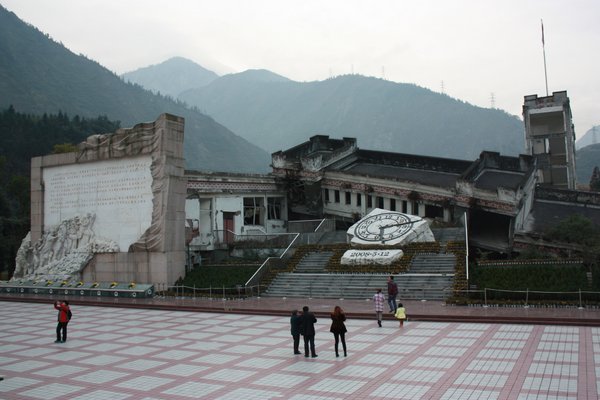
Like Beichuan, Yingxiu has a museum commemorating the earthquake and its victims, including an excellent display, upon we might draw in working in the Weihe Basin, on earthquakes in general, what happened in the Wenchuan earthquake, how buildings can be strengthened against earthquakes and what people, particularly children should do in an earthquake:

Similar displays could be very useful for educating communities in the Weihe Basin on earthquakes and how to prepare for them. Unlike Beichuan, however, Yingxiu was rebuilt in place, using architecture that reflects the Qiang ethnicity in the region. We visited the new Yingxiu Primary School and met the staff of the Sichuan Expanded Mental Health Network, which has been active in rehabilitation and recovery efforts in Yingxiu since shortly after the earthquake. Dr Tim Sim of Hong Kong Polytechnic University, part of the EwF team and other members of his team, had a chance to describe the impressive work that has been undertaken in helping children, parents, and teachers to cope with their losses. The visit culminated in a village guozhang dance and barbecue in Zhangjiaping, where the EwF, NERC and ESRC teams joined in the dancing and singing – to much amusement all around.
After an intense three days of workshop discussions, it was very welcome to spend a few days in some of the communities that had been so badly affected – to see the awful destruction that earthquakes can wreak, to be emboldened by the stories of hope and survival, and to remind ourselves yet again of why we do this work and why resilience is such an important part of the recovery process.
Our field seasons in central Asia have taken us to all kinds of remote and spectacular places, but nowhere really compares to the Alai valley of southern Kyrgyzstan. Here, the Tien Shan and Pamir, two of the greatest mountain ranges on Earth, come together across a narrow valley. The wall of the Pamir stretch as far as the eye can see, and driving towards them it feels as though you have reached the end of the world. In August 2014 I took the opportunity at the end of our fieldwork to travel overland to the Alai to examine the active thrust fault on which the Pamirs are growing.
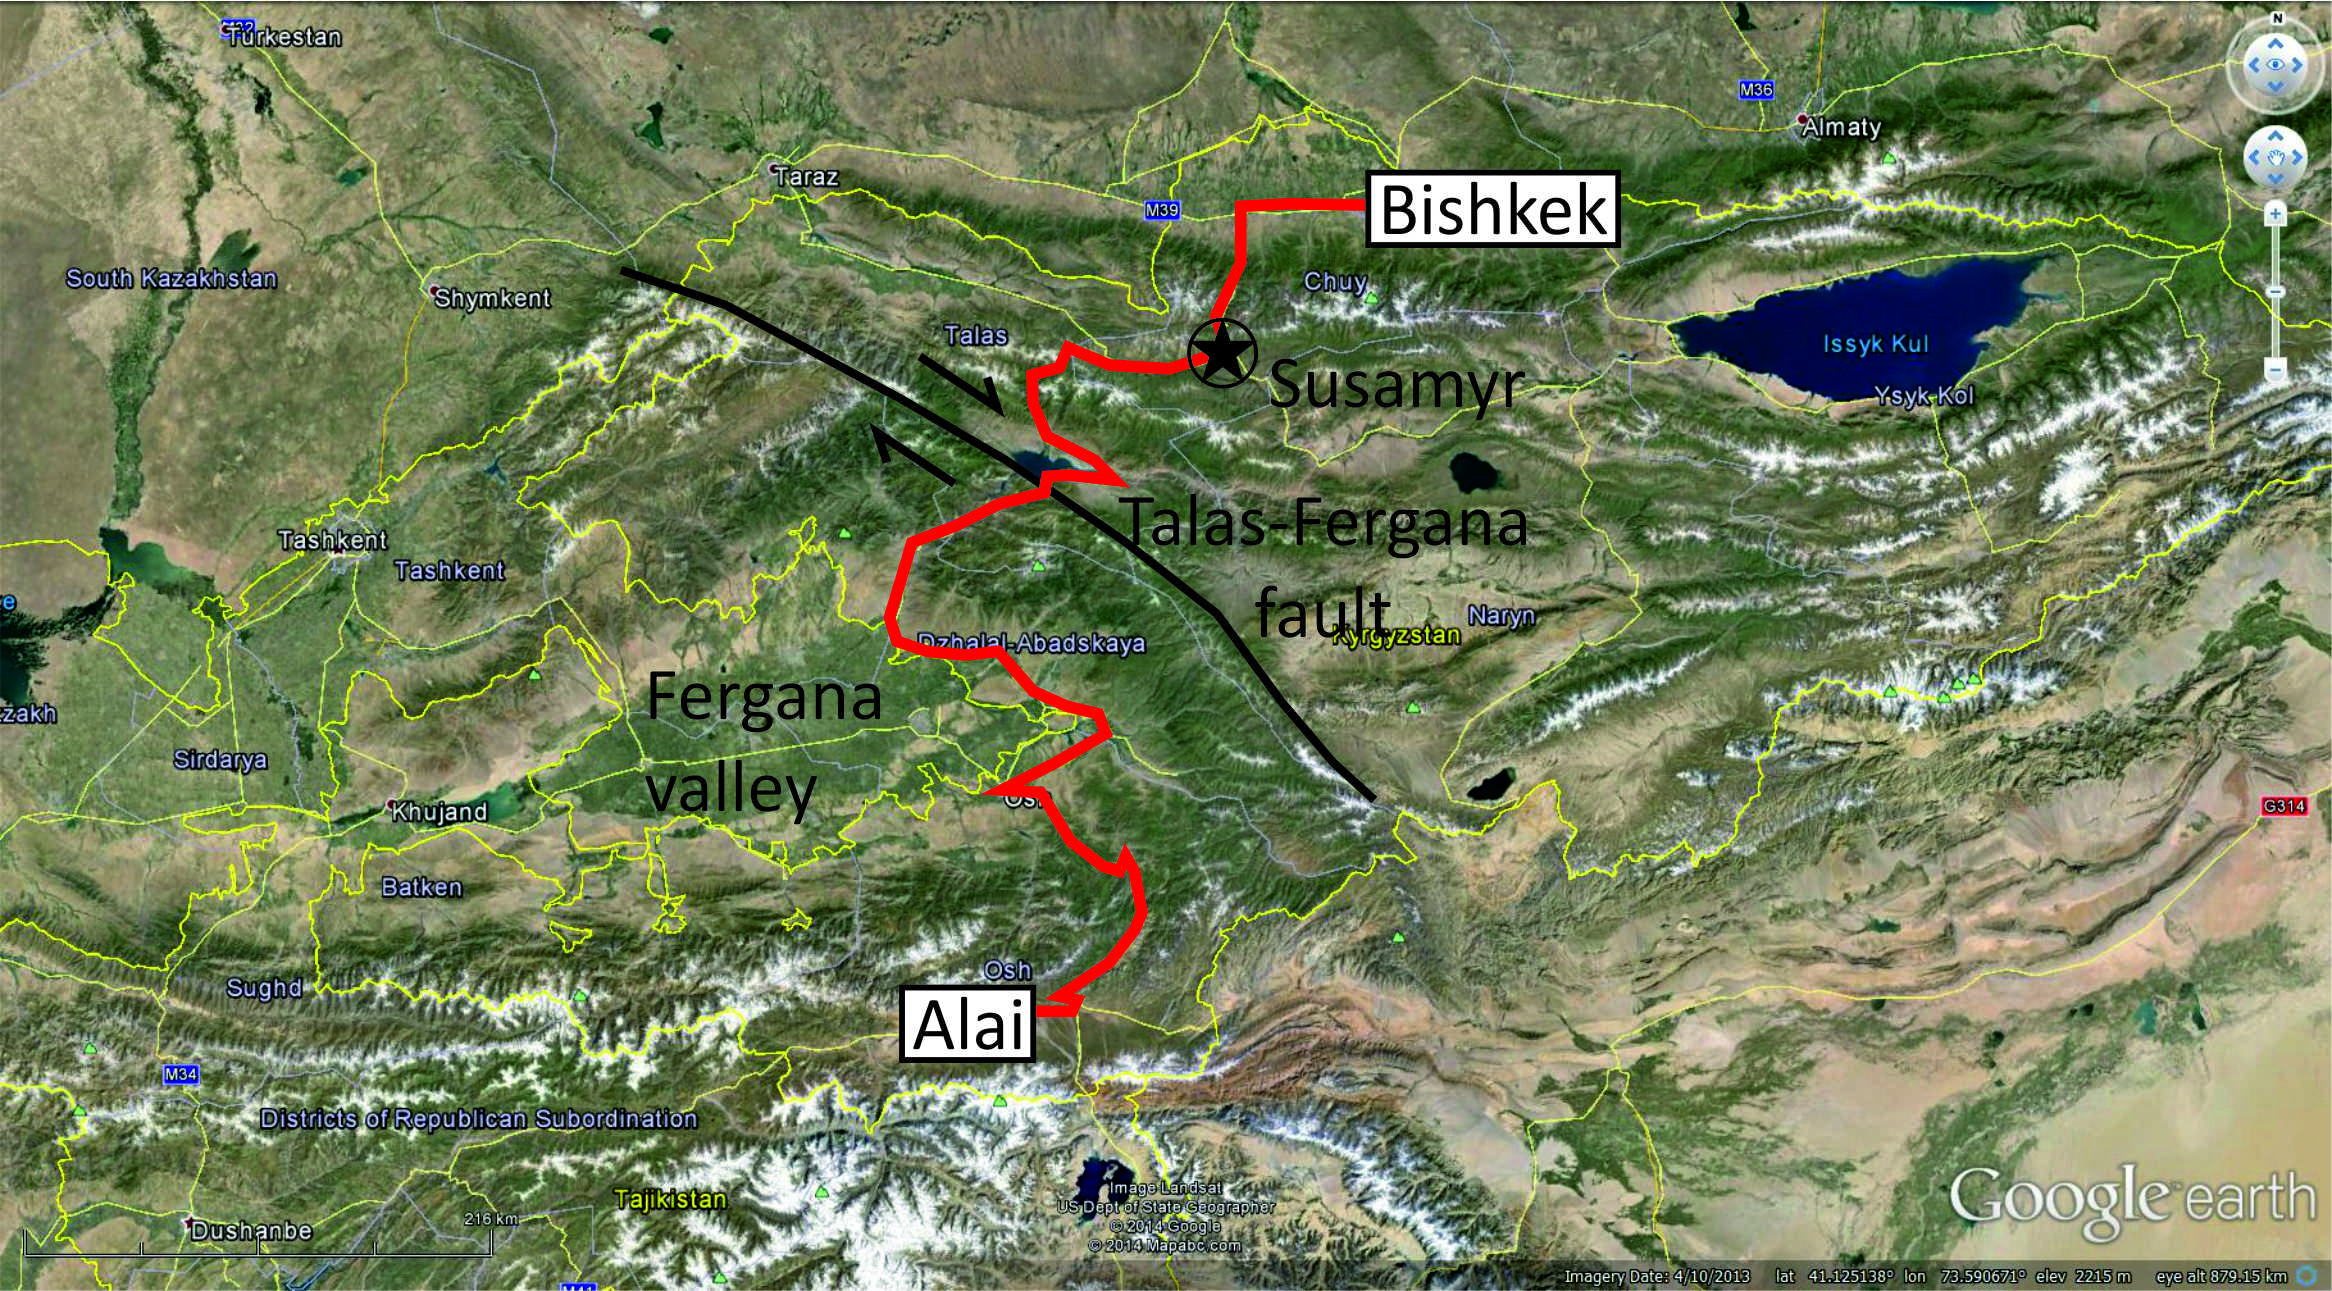
The road from Bishkek to the Alai valley is long, mountainous, and took us past numerous reminders of the region’s natural hazards. Heading west from the city the road passed through the epicentral area of the 1885 Belovod earthquake, which ruptured part of the northern edge of the Kyrgyz Tien Shan range. The road then took us up and over the Kyrgyz range, to drop down into the Susamyr valley, which was the site of the most recent large earthquake in Kyrgyzstan in 1992, and where we stopped to examine the fresh ruptures.
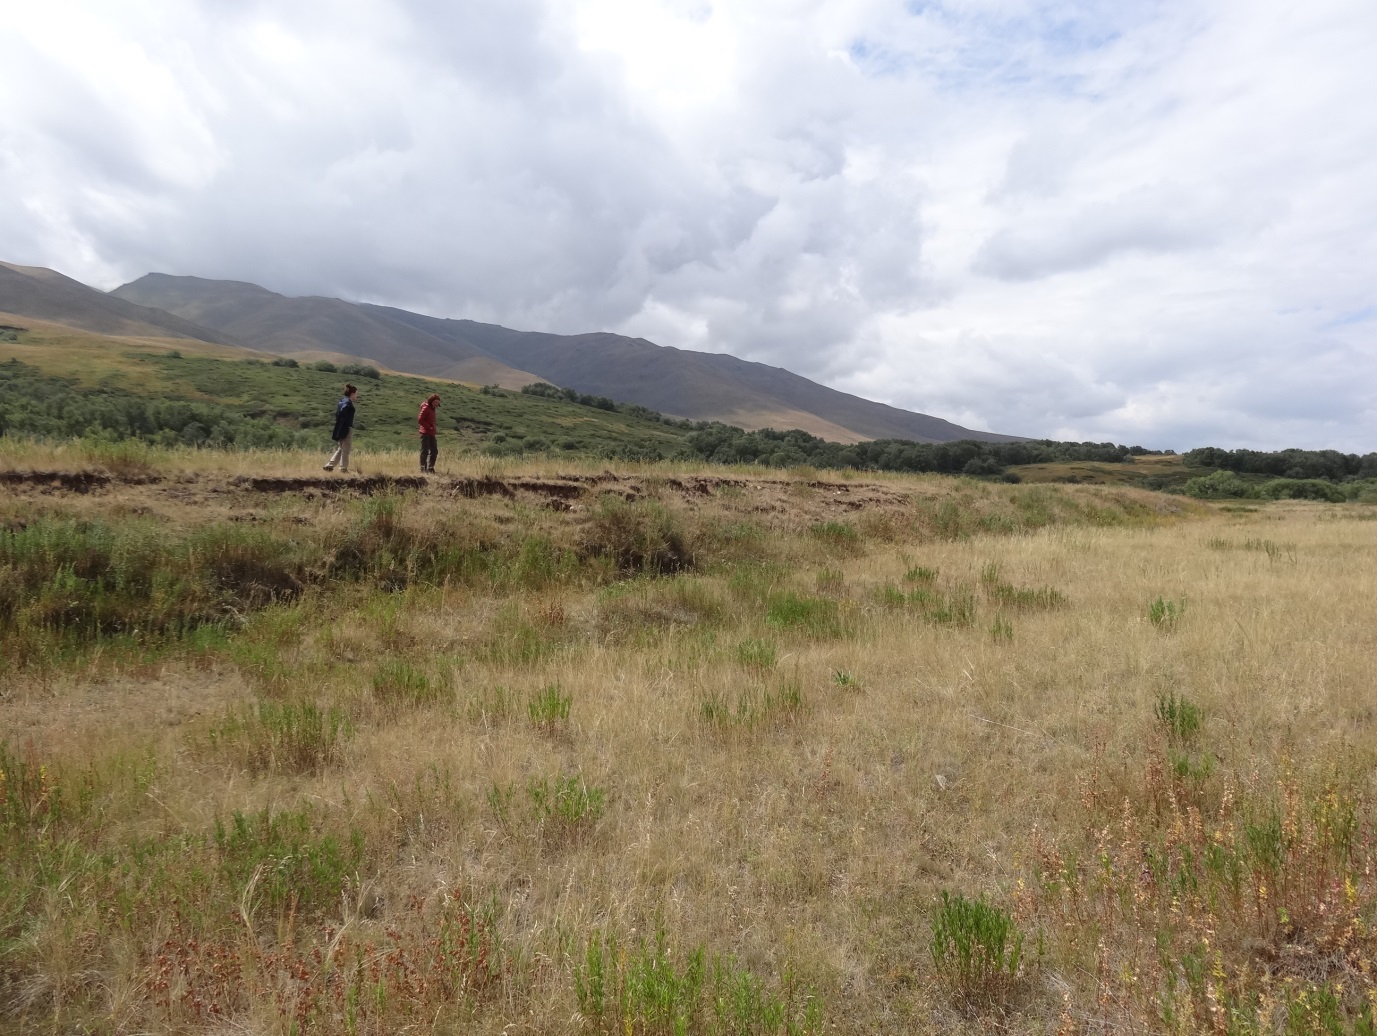
Ruptures of the Susamyr earthquake by the side of the Bishkek-Osh road.
From Susamyr, a long drive took us to the Toktogul reservoir and a crossing through the Fergana range, where we encountered a spectacular roadside section through the Talas-Fergana fault. This fault is one of the longest and most prominent in the geology and geomorphology of the Tien Shan, and yet its slip history and potential for earthquakes is not well known.
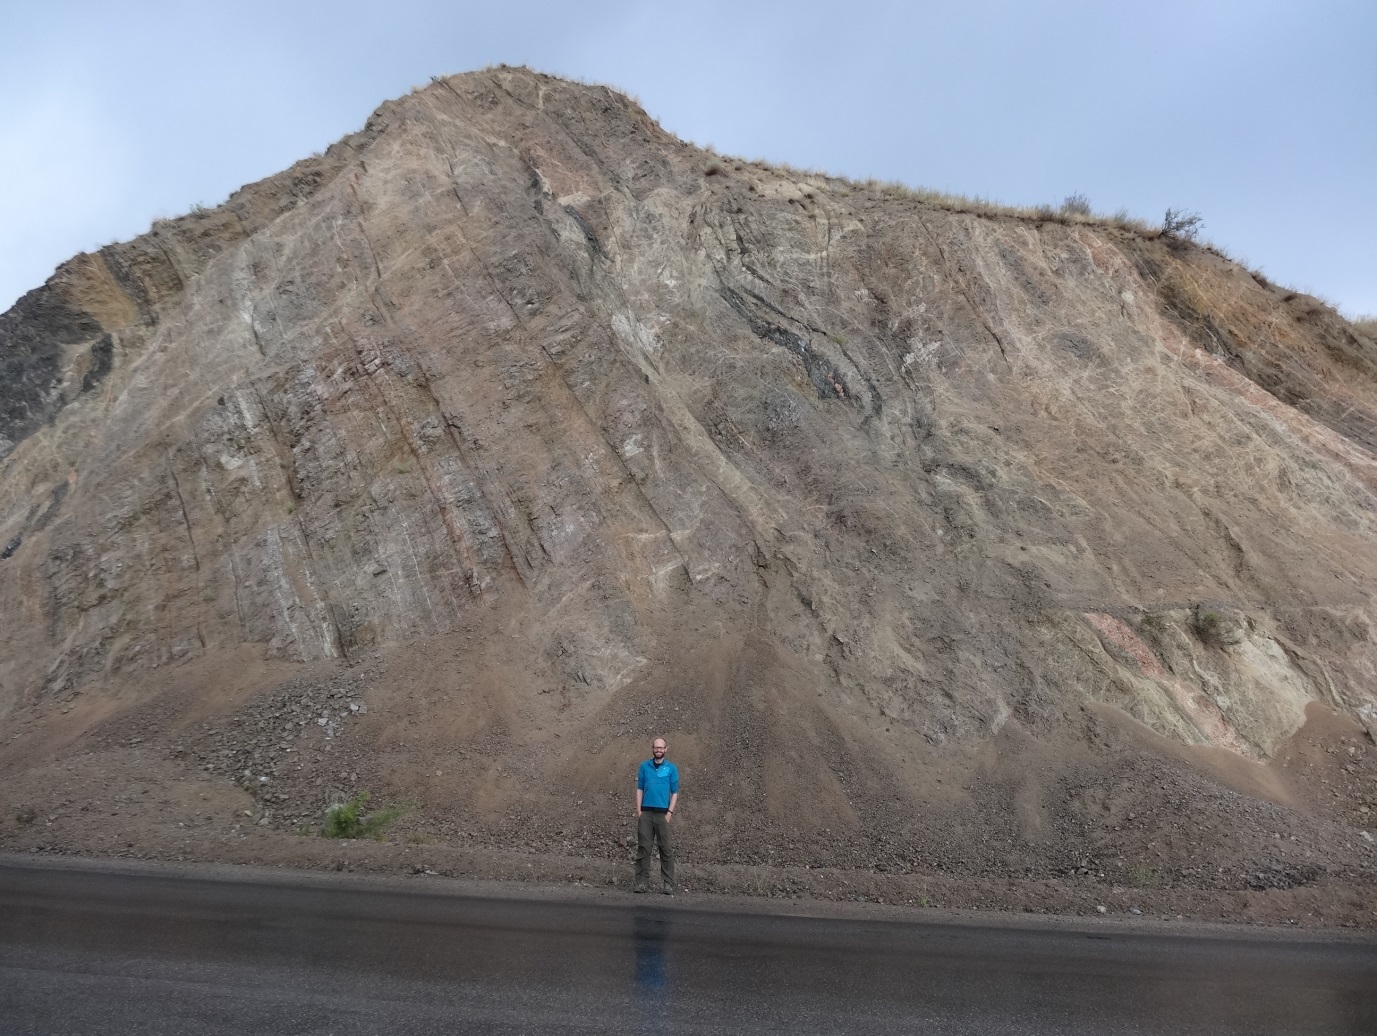
Exposure through the Talas-Fergana fault along the Bishkek-Osh road.
Crossing the Fergana range the temperature rapidly warmed as we dropped down to the cotton fields of the Fergana valley. This almond-shaped depression is surrounded on all but its western edge by high mountains, which provide plentiful water for irrigation, but which are gradually consuming the basin by slip along reverse faults at their margins. We were treated to wonderful roadside sections through multi-coloured basin sediments folded and deformed above the growing faults. Some of the folds have trapped hydrocarbons, which are exploited to the present-day.

Sign at the entrance to Kochkor Ata, oil town in the Fergana valley.
After skirting the Fergana valley, the road headed south, into the high mountains. We passed through narrow gorges of Palaeozoic granite and gneiss, interspersed here and there with thin rainbow smears of tertiary sediment marking the consumed remnants of what were once wide basins, providing roadside snapshots of the deeper history of the Tien Shan. Eventually, the road started towards a wall of limestone peaks, climbing rapidly up a series of tight switchbacks to a pass into the Alai valley at 3,600 m.
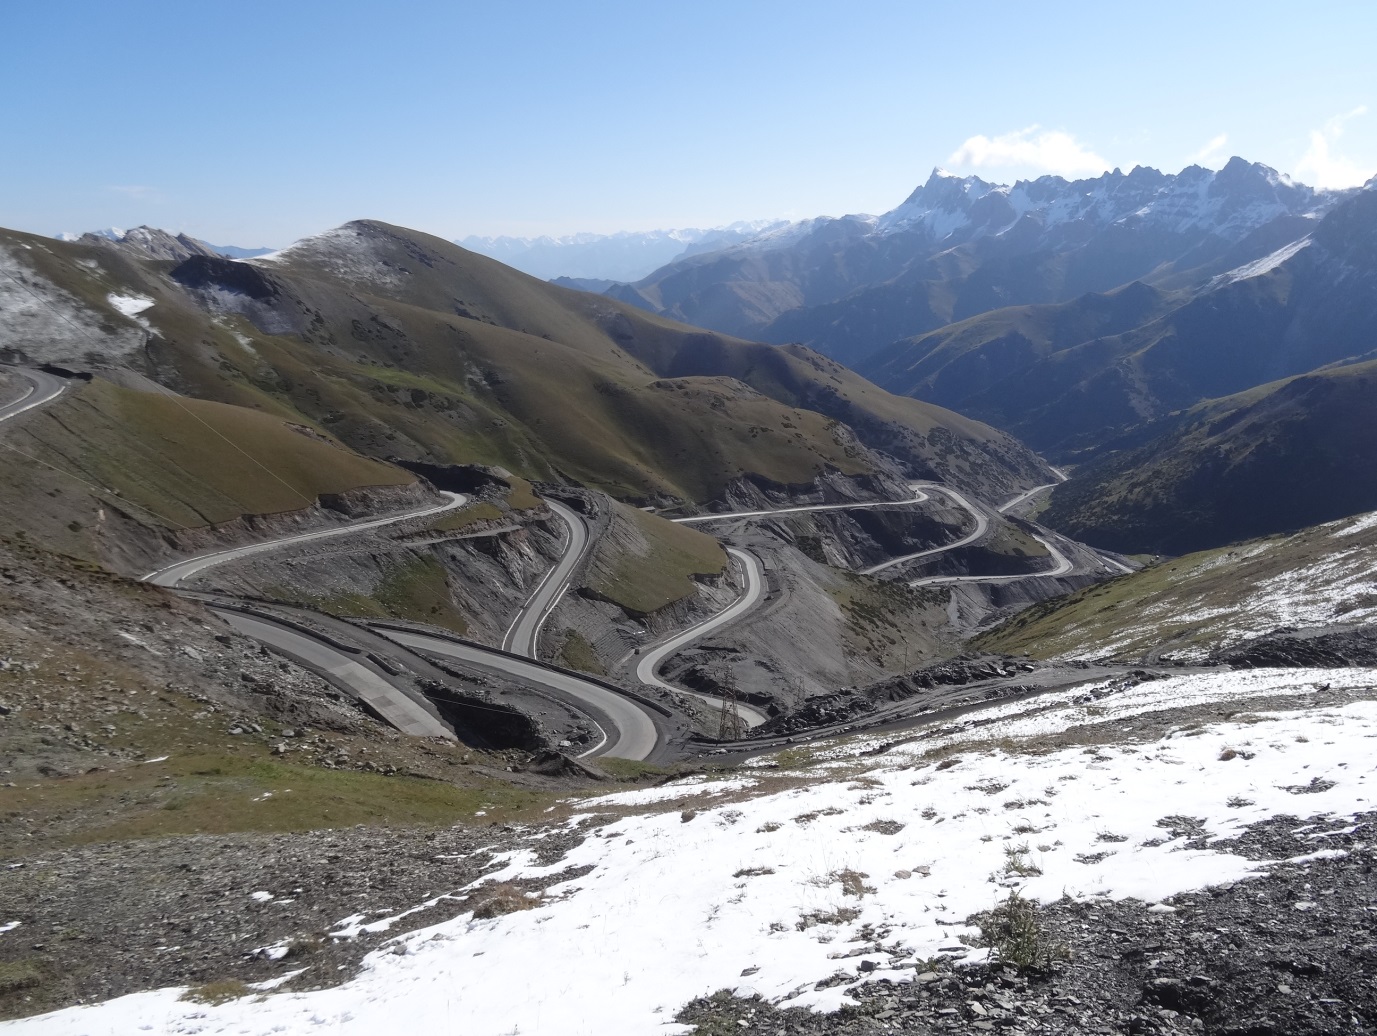
Looking north from the pass into the Alai valley
The present road is pretty new, but sections of the steep mountainside into which it is built are already showing signs of collapse. The road is very important though, as it from the Alai valley its splits, and crosses high passes to connect with both Tajikistan and China. From a distance you are hard pressed to see where the passes to Tajikistan are, as the first view on entering the Alai valley is of a continuous wall of icy mountains as far as the eye can see. This is the north wall of the Pamir, which reaches up to the 7,134 m summit of Peak Lenin.
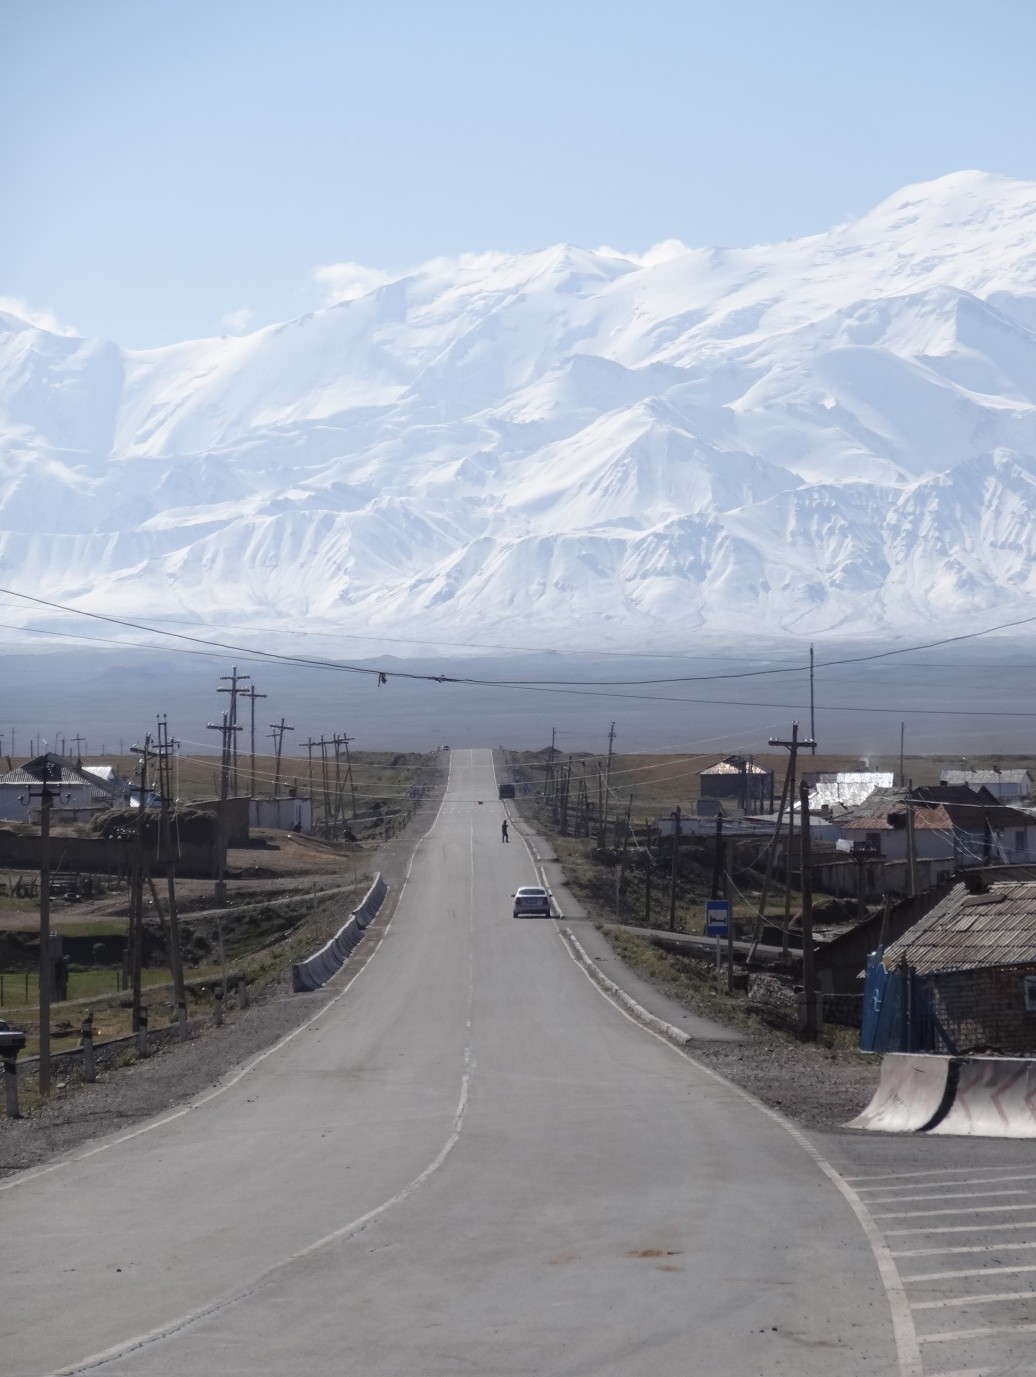
Entering the village of Sary-Tash. Our first view of the Pamir and the road to Tajikistan.
There is about four kilometres of relief between the summit of Lenin Peak and its base in the Alai valley (at 3,000 m elevation). At the southern edge of the valley is the trace of the Main Pamir thrust. This fault accommodates 5-6 mm/yr of shortening between the Pamir and Tien Shan (Arrowsmith and Strecker, 1999) making it one of the major active faults in Asia. We were impressed by the freshness of the fault scarp, and also by how rapidly the landscape has changed over the past few thousand years in this high-elevation environment. The Pamir thrust also contains a lesson for the mapping of earthquake hazard. Although it is amongst the fastest active faults of central Asia, there are few large earthquakes recorded upon it, presumably a function of the short historic record. A full appreciation of active faults and their ability to produce destructive earthquakes thus requires careful mapping of their expression in the landscape, combined with forensic investigation of ancient earthquakes from their expression in recent sediments.
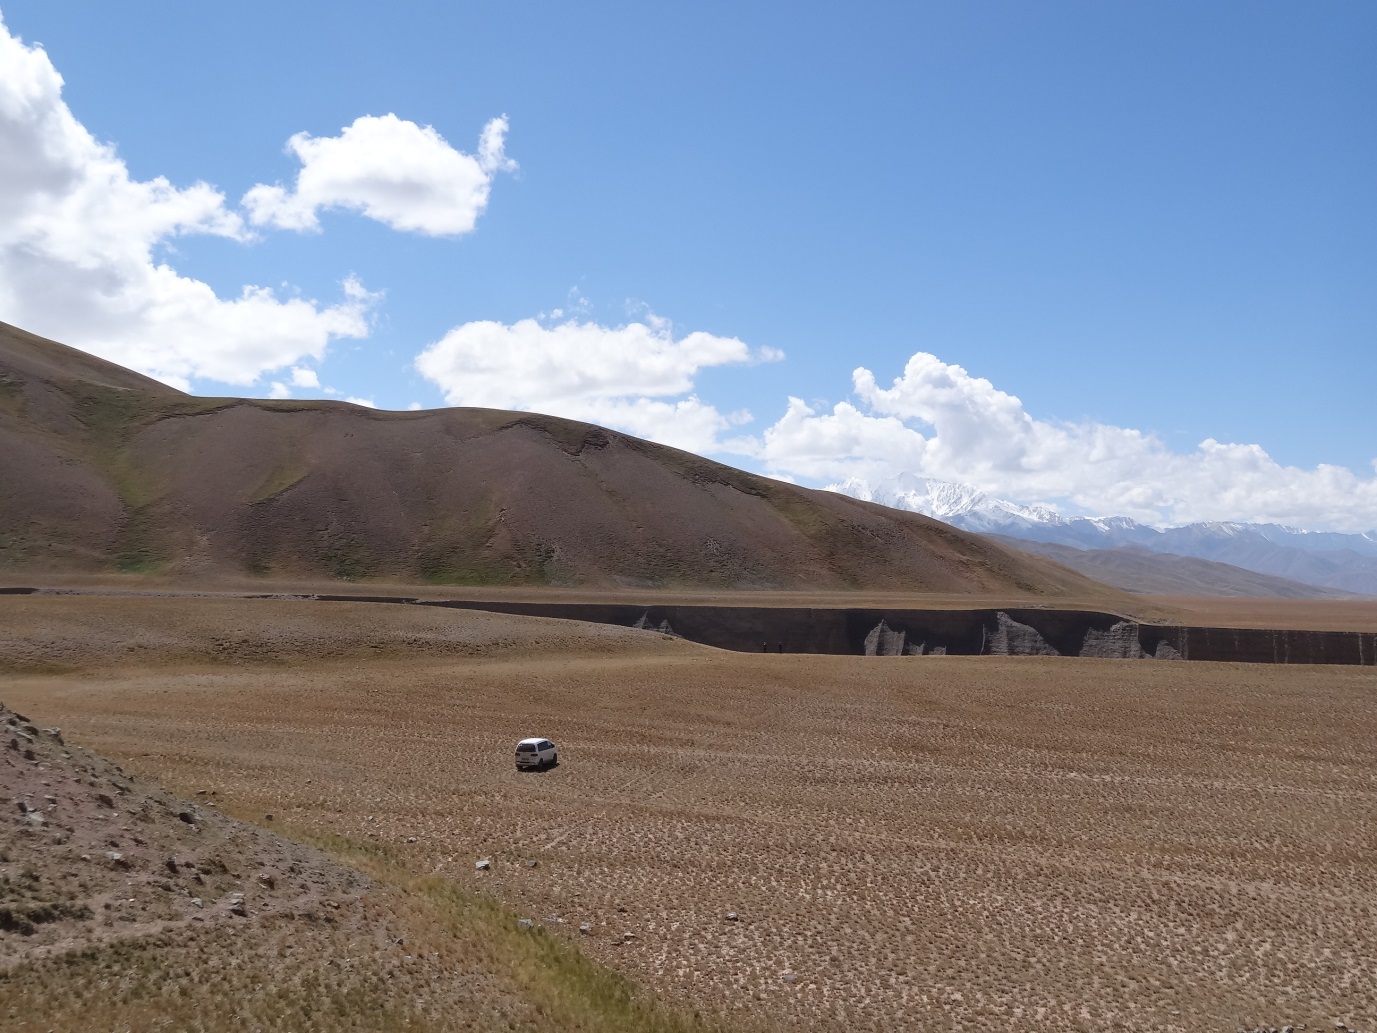
The Main Pamir thrust
Tim Middleton describes some of the fieldwork for his PhD, sampling and mapping fault scarps from the 1739 Yinchuan earthquake in northern China.
The terrain is hard-going. An undulating surface of large boulders stretches for kilometres in every direction; the vans are back by the main road. There is no vegetation and though it is still only March the sun beats down on this barren landscape. In the distance, large, triangular mountains loom out of the haze—the Helanshan are the final frontier before the emptiness of the Alxa desert beyond. Snaking its way across this landscape is a small escarpment. It varies in height but continues for a total distance of about sixteen kilometres, tracking the edge of the Yinchuan basin. It’s this escarpment we’re here to study.
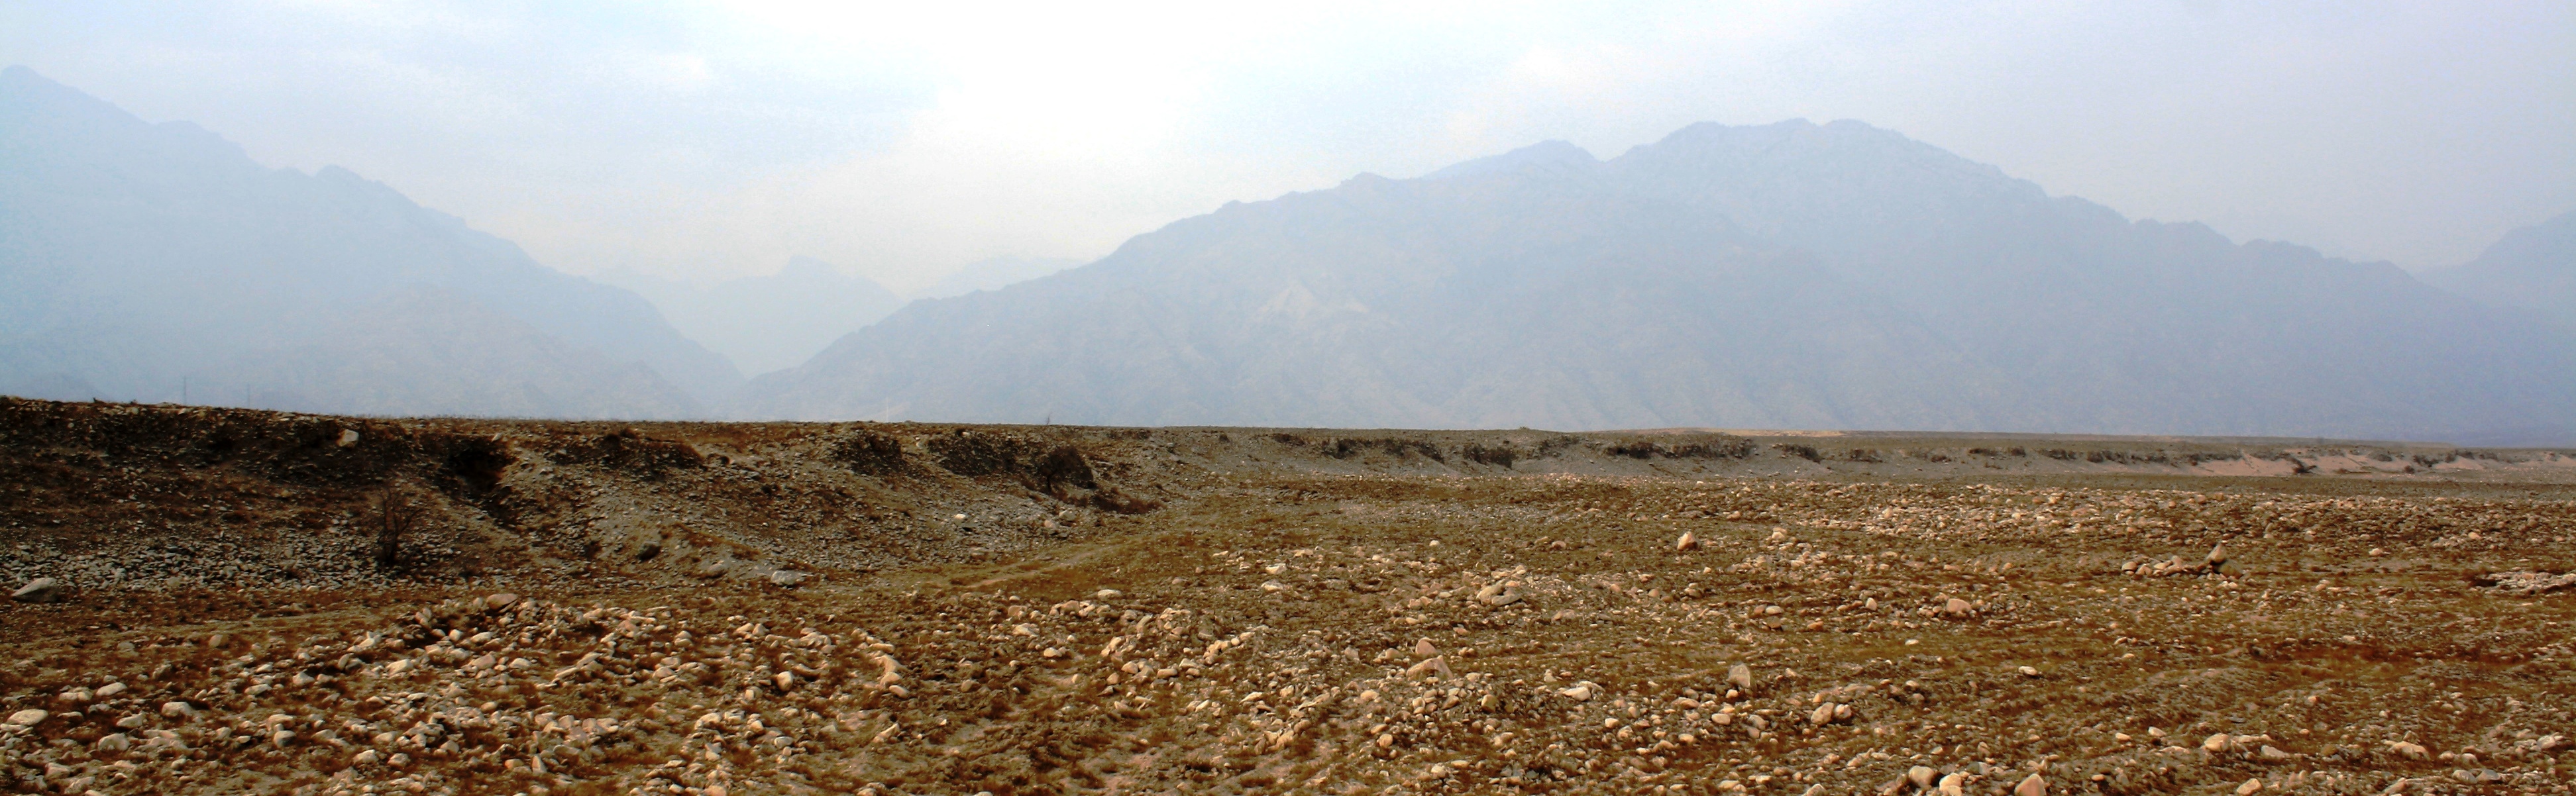
Figure 1: Field photograph of the Suyukou fault scarp. The scarp is around 8 metres high and can be seen cutting across the centre of the picture. In the distance, a few kilometres away to the west, are the Helan Mountains.
On 3rd January 1739, disaster struck; an earthquake with an estimated magnitude of 8.0 shook the entire Yinchuan basin. Temples, pagodas, offices, houses and city walls all collapsed and the major cities of Yinchuan and Pingluo were severely damaged. Eyewitness reports describe cracks in the ground up to 100 metres long. In total, an estimated 50,000 people lost their lives. Subsequent urban development in the towns and cities of the Yinchuan basin has obscured much of the evidence for the 1739 earthquake, but out at the base of the mountains in this arid, desert-like climate evidence of this and older earthquakes remain preserved in the landscape.
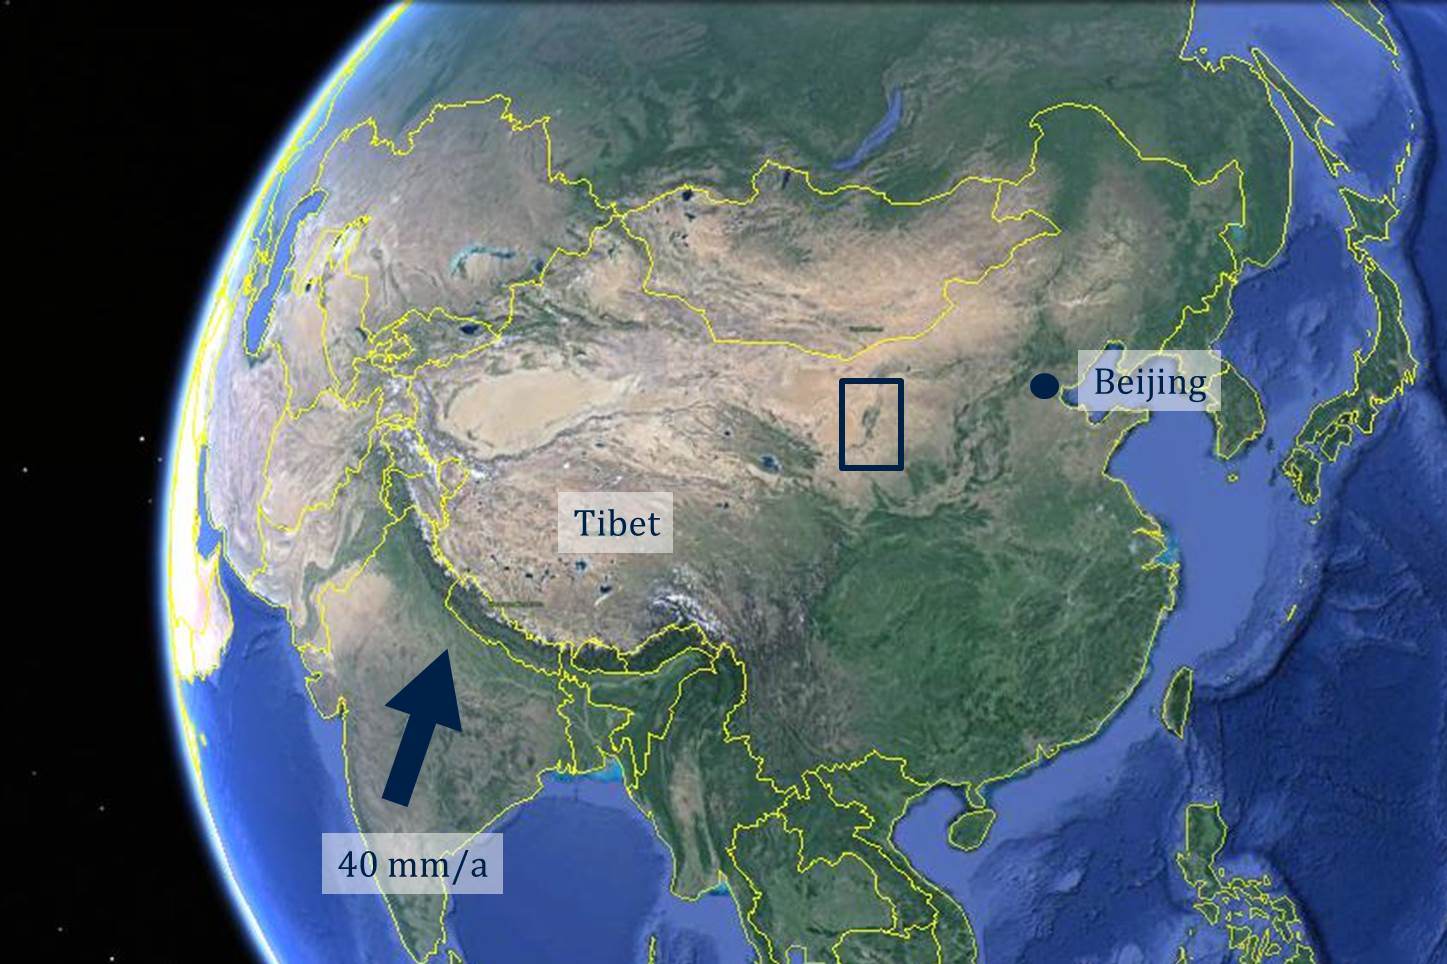
Figure 2: Google Earth image of China. The Yinchuan basin is on the western side of the Ordos Plateau in northern central China. Its location is indicated on the image by a dark blue box.

Figure 3: (Left) Map of the Yinchuan basin. Topographic data is from ASTER GDEM; GPS data is shown by red arrows; and focal mechanisms are from the CMT catalogue. Black lines indicate active faults and are drawn with the aid of topographic data and satellite imagery. The location of the 1739 rupture, along the eastern edge of the Helanshan, is indicated by a bold red line. (Right) Imagery from the Pleiades satellite showing the southern portion of the 1739 rupture. The fault scarp can be seen as a faint white line running from southwest to northeast just above the road.
We want to use the clues in the landscape to try to understand more about what happened in 1739. But time is of the essence if the earthquakes preserved in this landscape are to be recorded. The provincial authorities in the Yinchuan basin are embarking on a major new project. The market for western-style wine in China is ballooning and, as a result, these dry, alluvial fans are to be turned into vineyards. Progress is in its early stages. So far a curious, red-brick road, which meanders across the fault scarp, is the only sign of change. But major earthworks that would destroy these historic and prehistoric fault scarps are clearly in the pipeline.
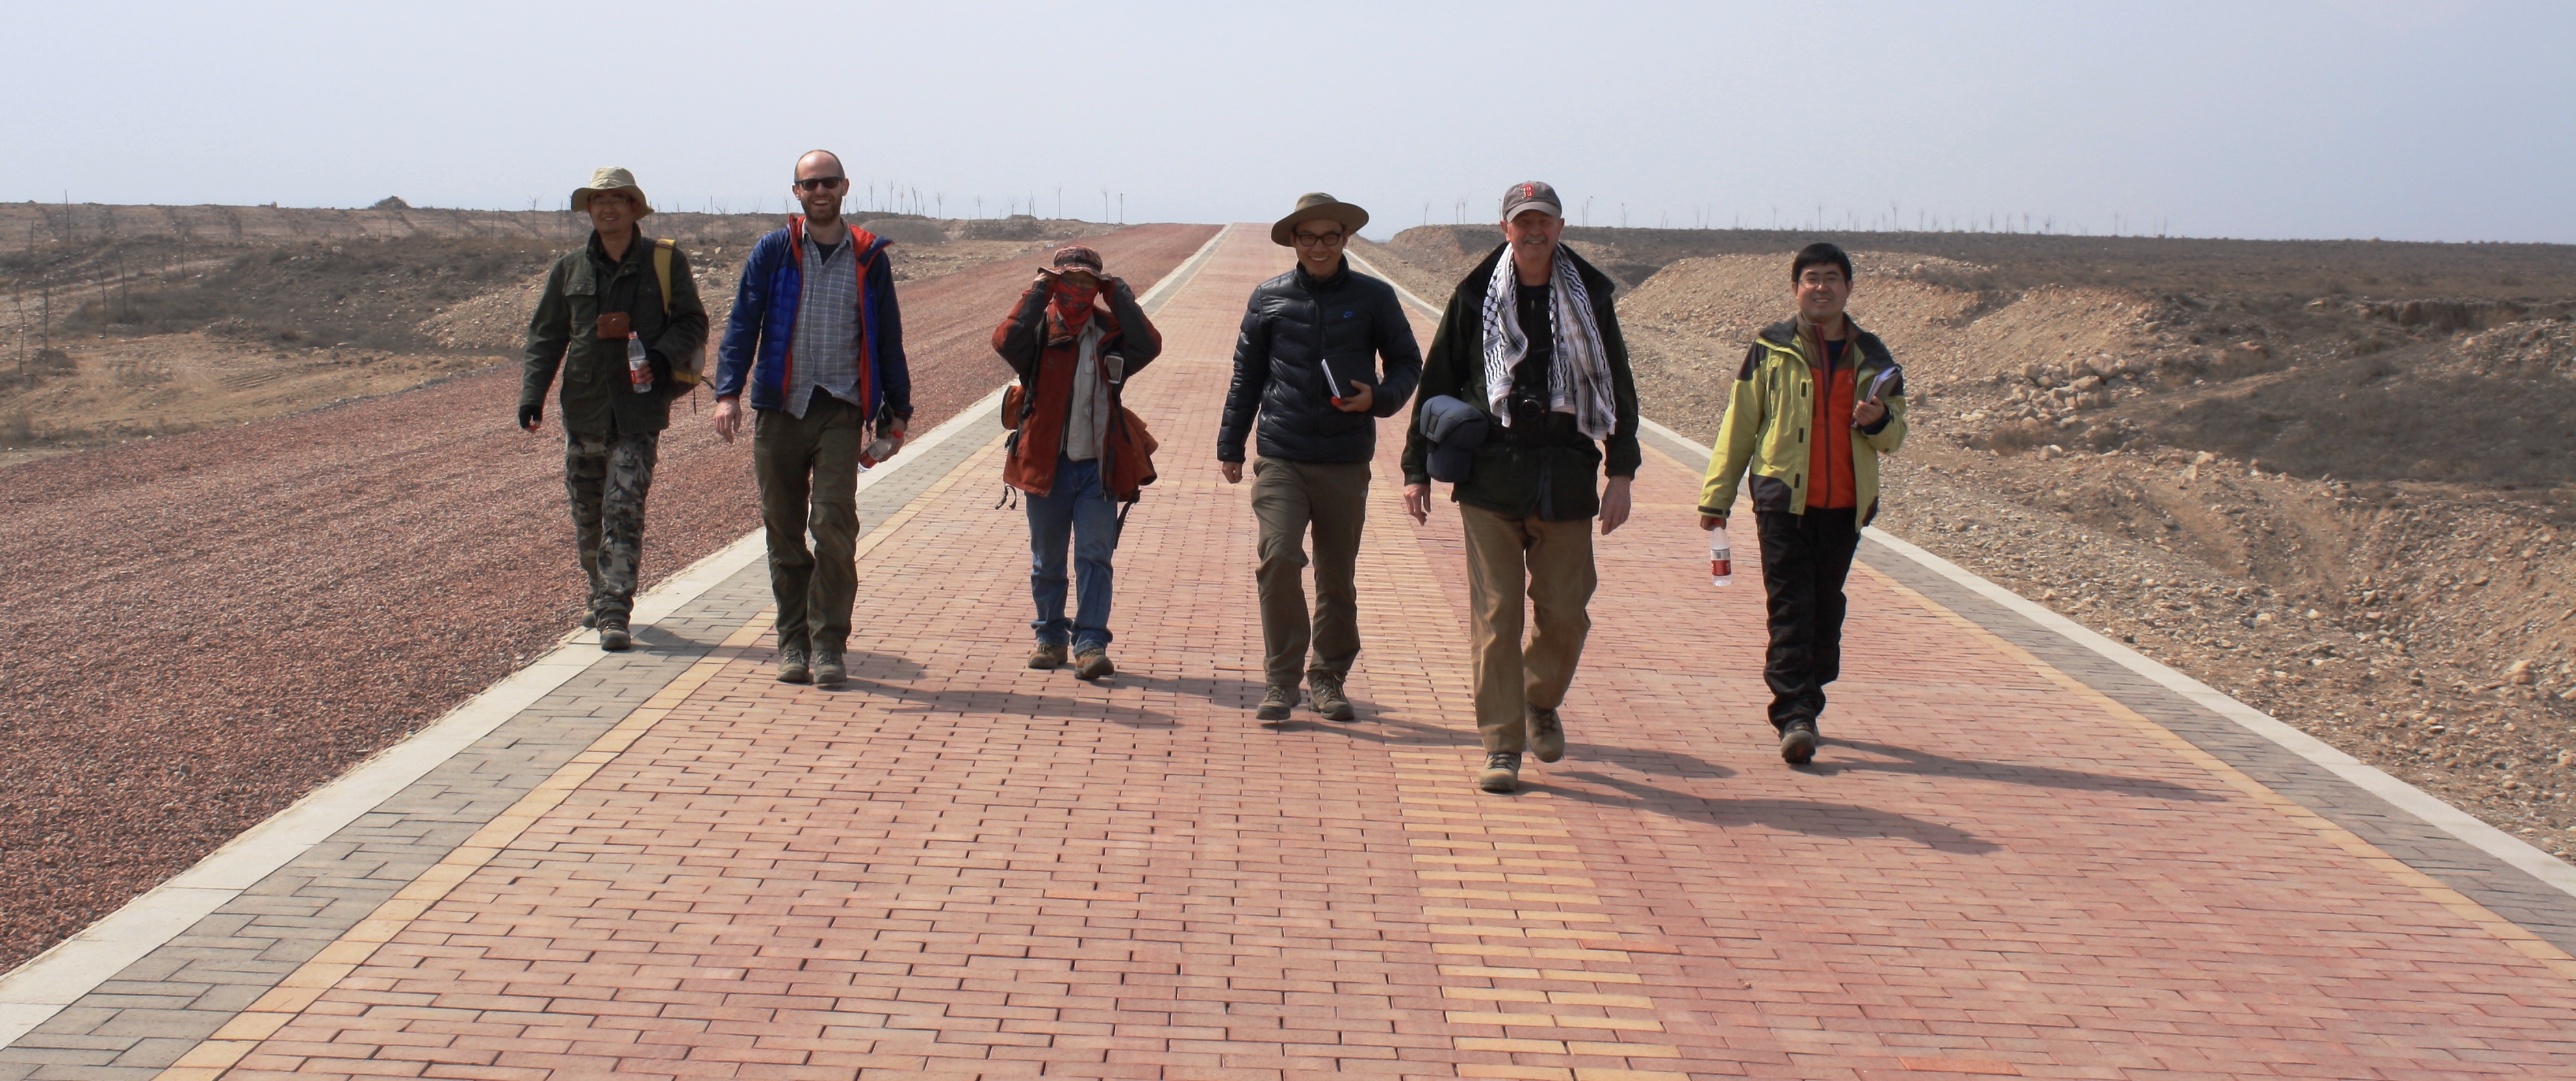
Figure 4: The new red brick road that cuts across the Suyukou escarpment, revealing exposures of the fault that slipped in 1739.
Our approach is twofold. We have acquired high resolution images of the region from the Pleiades satellite, which can be used to map the ruptures. Also, by combining two images taken from different angles we are able to build a three-dimensional model of the topography enabling us to measure offsets at different points along the escarpment. The maximum recorded slip in the 1739 earthquake was 5.3 metres, but much of the escarpment is taller than this; these taller scarps therefore represent previous earthquakes. From our maps of these scarps we are able to distinguish at least three separate events.
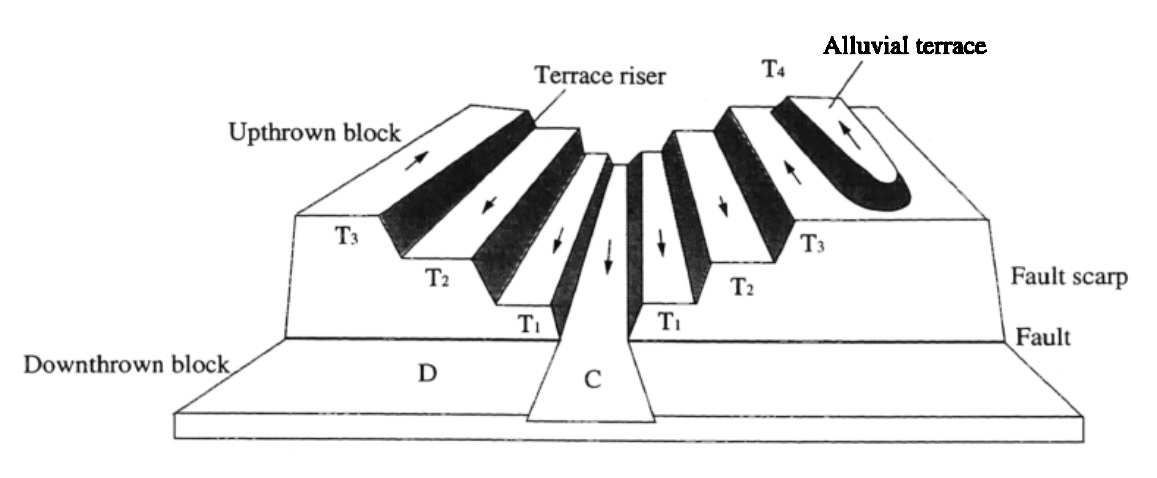
Figure 5: Diagram from Deng & Liao (1996) showing an escarpment of varying heights. According to their model: T1 represents the most recent earthquake (i.e. the 1739 event), T2 represents the cumulative offset in the last two earthquakes, and T3 represents the total offset in the last three earthquakes. This pattern is similar to what we observe along the escarpment at the edge of the Yinchuan basin.
The second step is to investigate the scarps in the field. We visited the Yinchuan basin in March 2014 and collected various samples for dating. These dates will enable us to say when these three earthquakes took place. Radiocarbon samples from soils that have accumulated against the escarpment should post-date the most recent earthquake, whilst sediment samples from within the escarpment itself should be older than the earthquake in question. By building up a chronology for the previous earthquakes on this fault we can suggest roughly how often earthquakes occur and when we might expect the next one to be.
At another field site, 60 kilometres to the north, it appears as though part of the Great Wall of China was destroyed in the 1739 event. This particular section of the wall was built in 1531, during the Ming Dynasty, and is made of adobe bricks. No other major earthquakes have occurred in the Yinchuan basin since 1531 and so it is highly likely that the 1739 event was responsible for the damage.
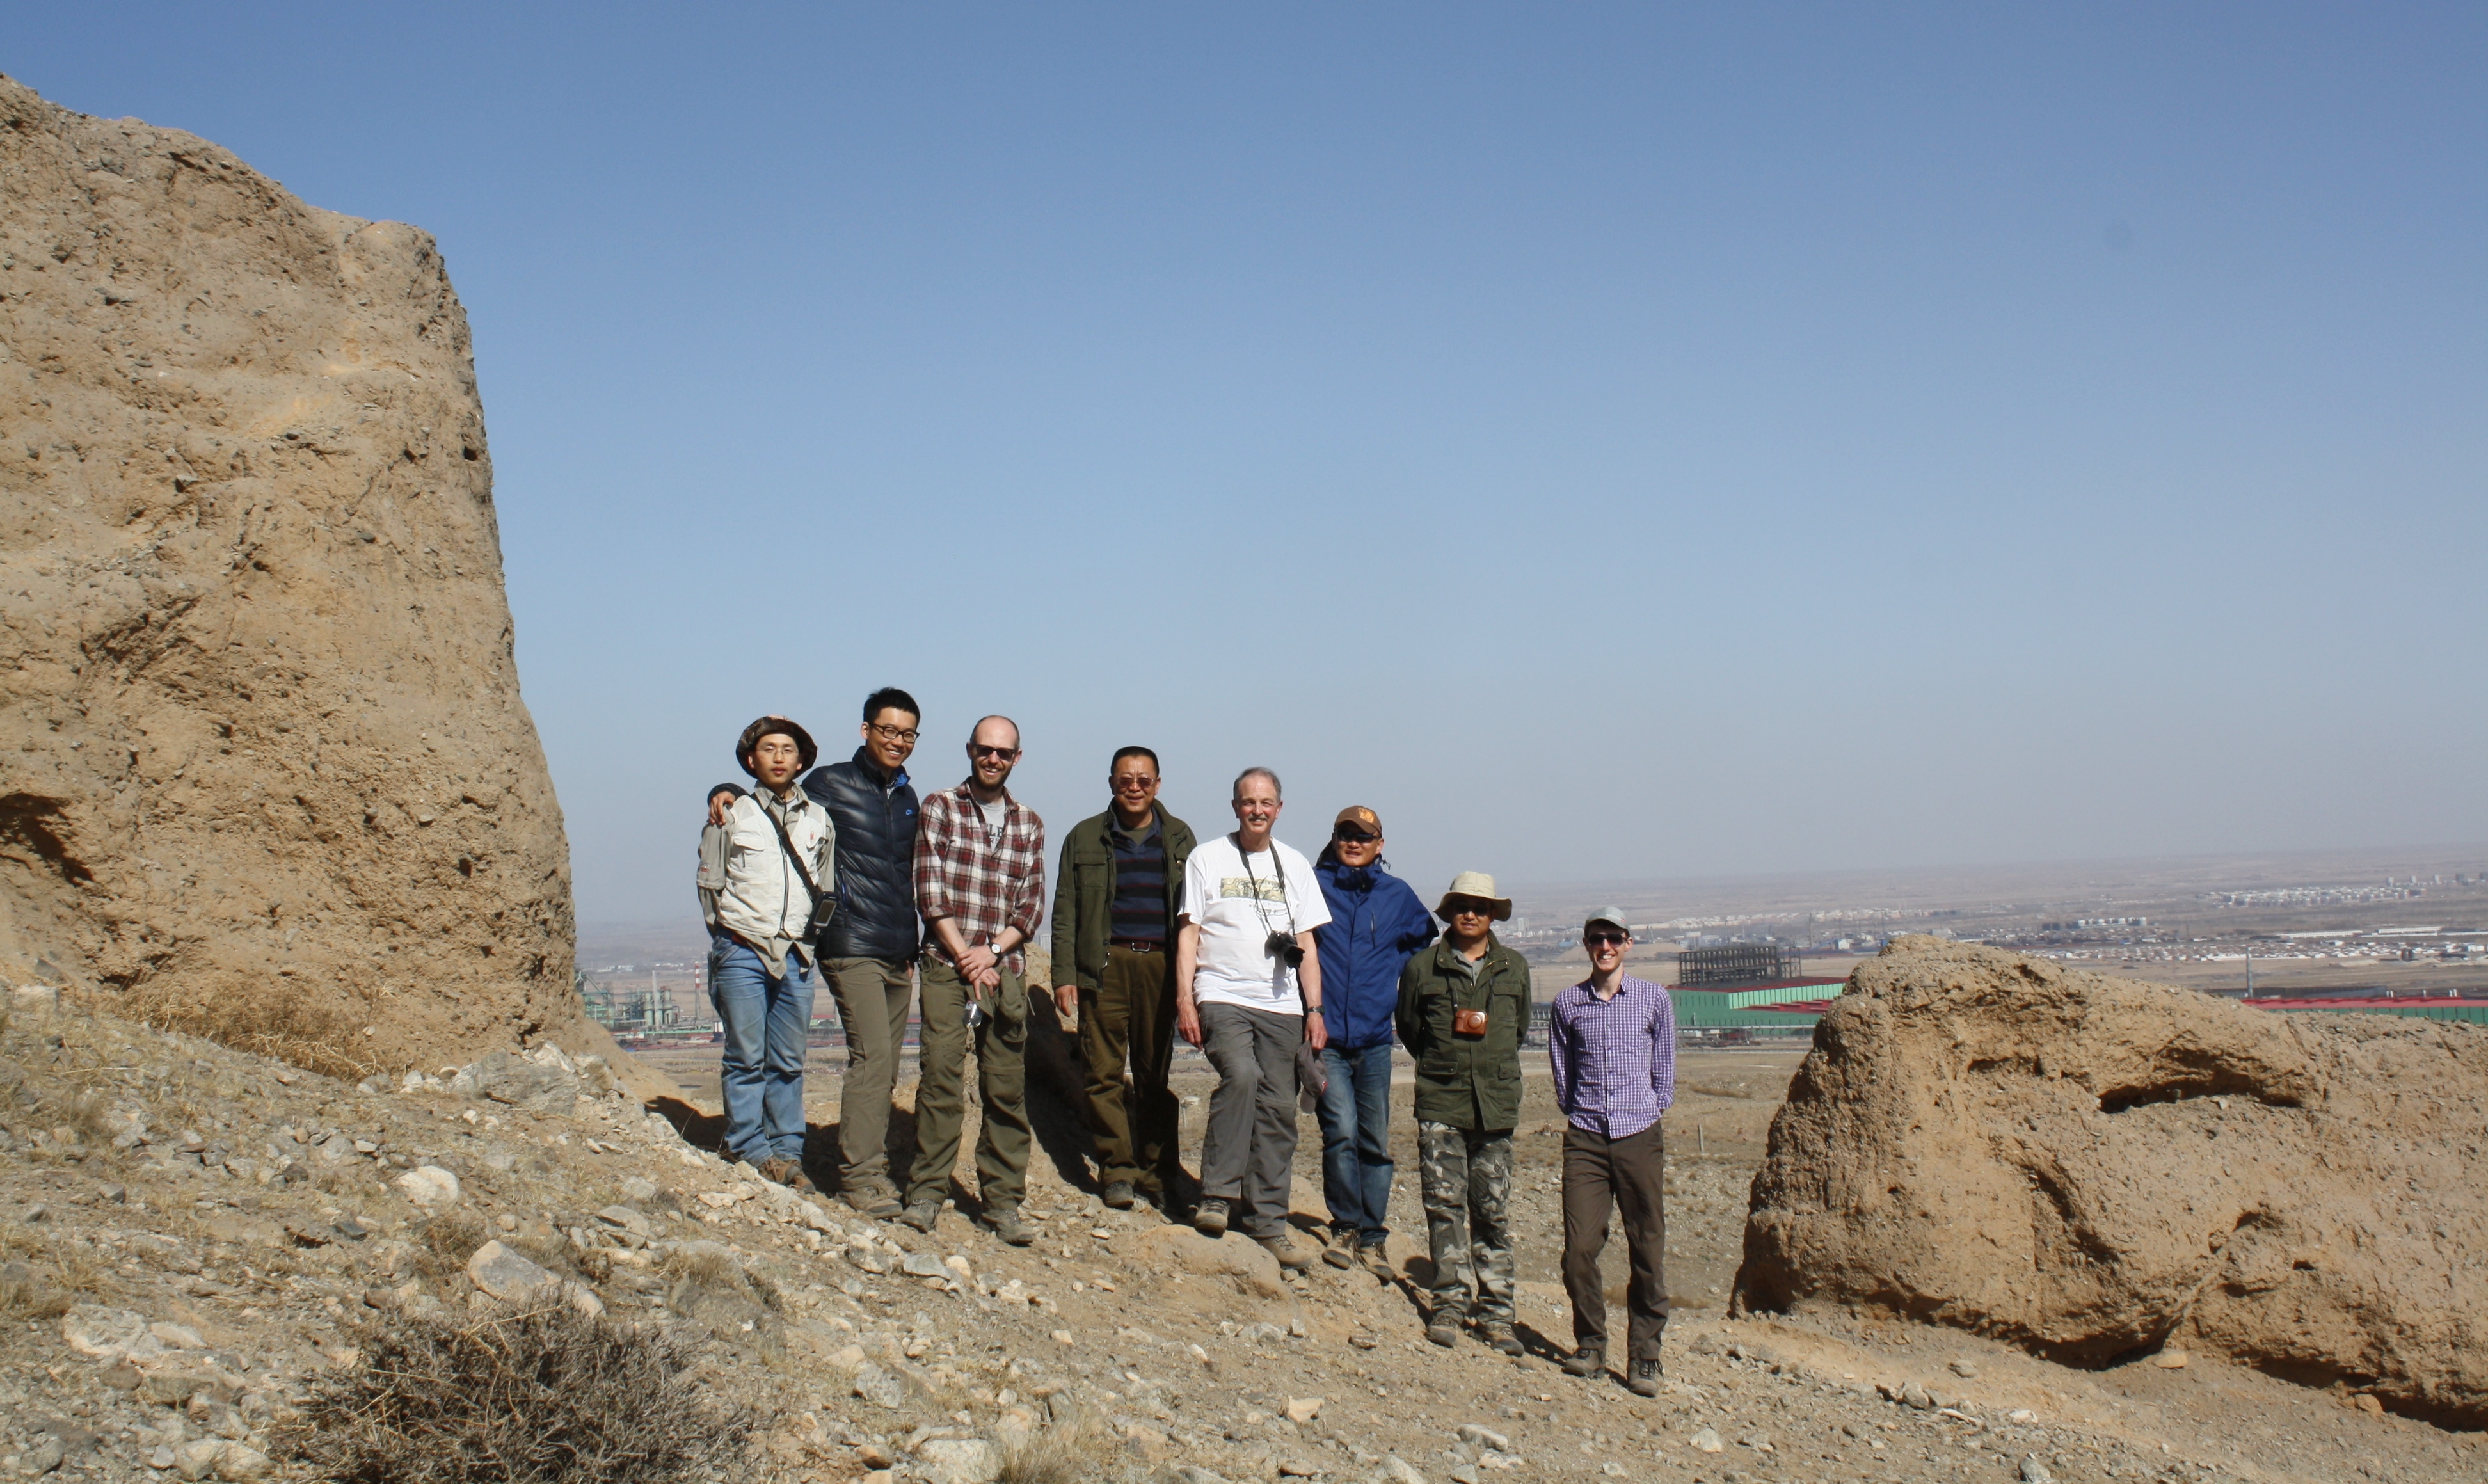
Figure 6: The field team at the site of the break in the Great Wall of China.
Since 1739 the population of the Yinchuan basin has increased dramatically and the area is now home to around three million people. Major infrastructure projects, including the new vineyards, are taking shape at a rapid rate. Understanding the earthquake risk in the region is clearly of vital importance.
With thanks to Qiyun Lei, Zhikun Ren, Xiaogang Song, Wuxiong Cheng, Zhigang Ma and the Institute of Geology at the China Earthquake Administration in Beijing for all of their assistance in the field.
A new Earth-observation satellite called Sentinel-1A has been used for the first time to map the ground movements caused by the magnitude 6 earthquake that shook up California’s wine-producing Napa Valley on 24 August 2014 (European Space Agency). The interferogram of the rupture clearly confirms that part of the West Napa Fault system was responsible for the earthquake (BBC News Article on the satellite interferogram and earthquake). This fault had not been identified as being particularly hazardous prior to the event. The images are being used by scientists (such as such as field teams from the University of California Davis) on the ground to help them map the surface rupture.
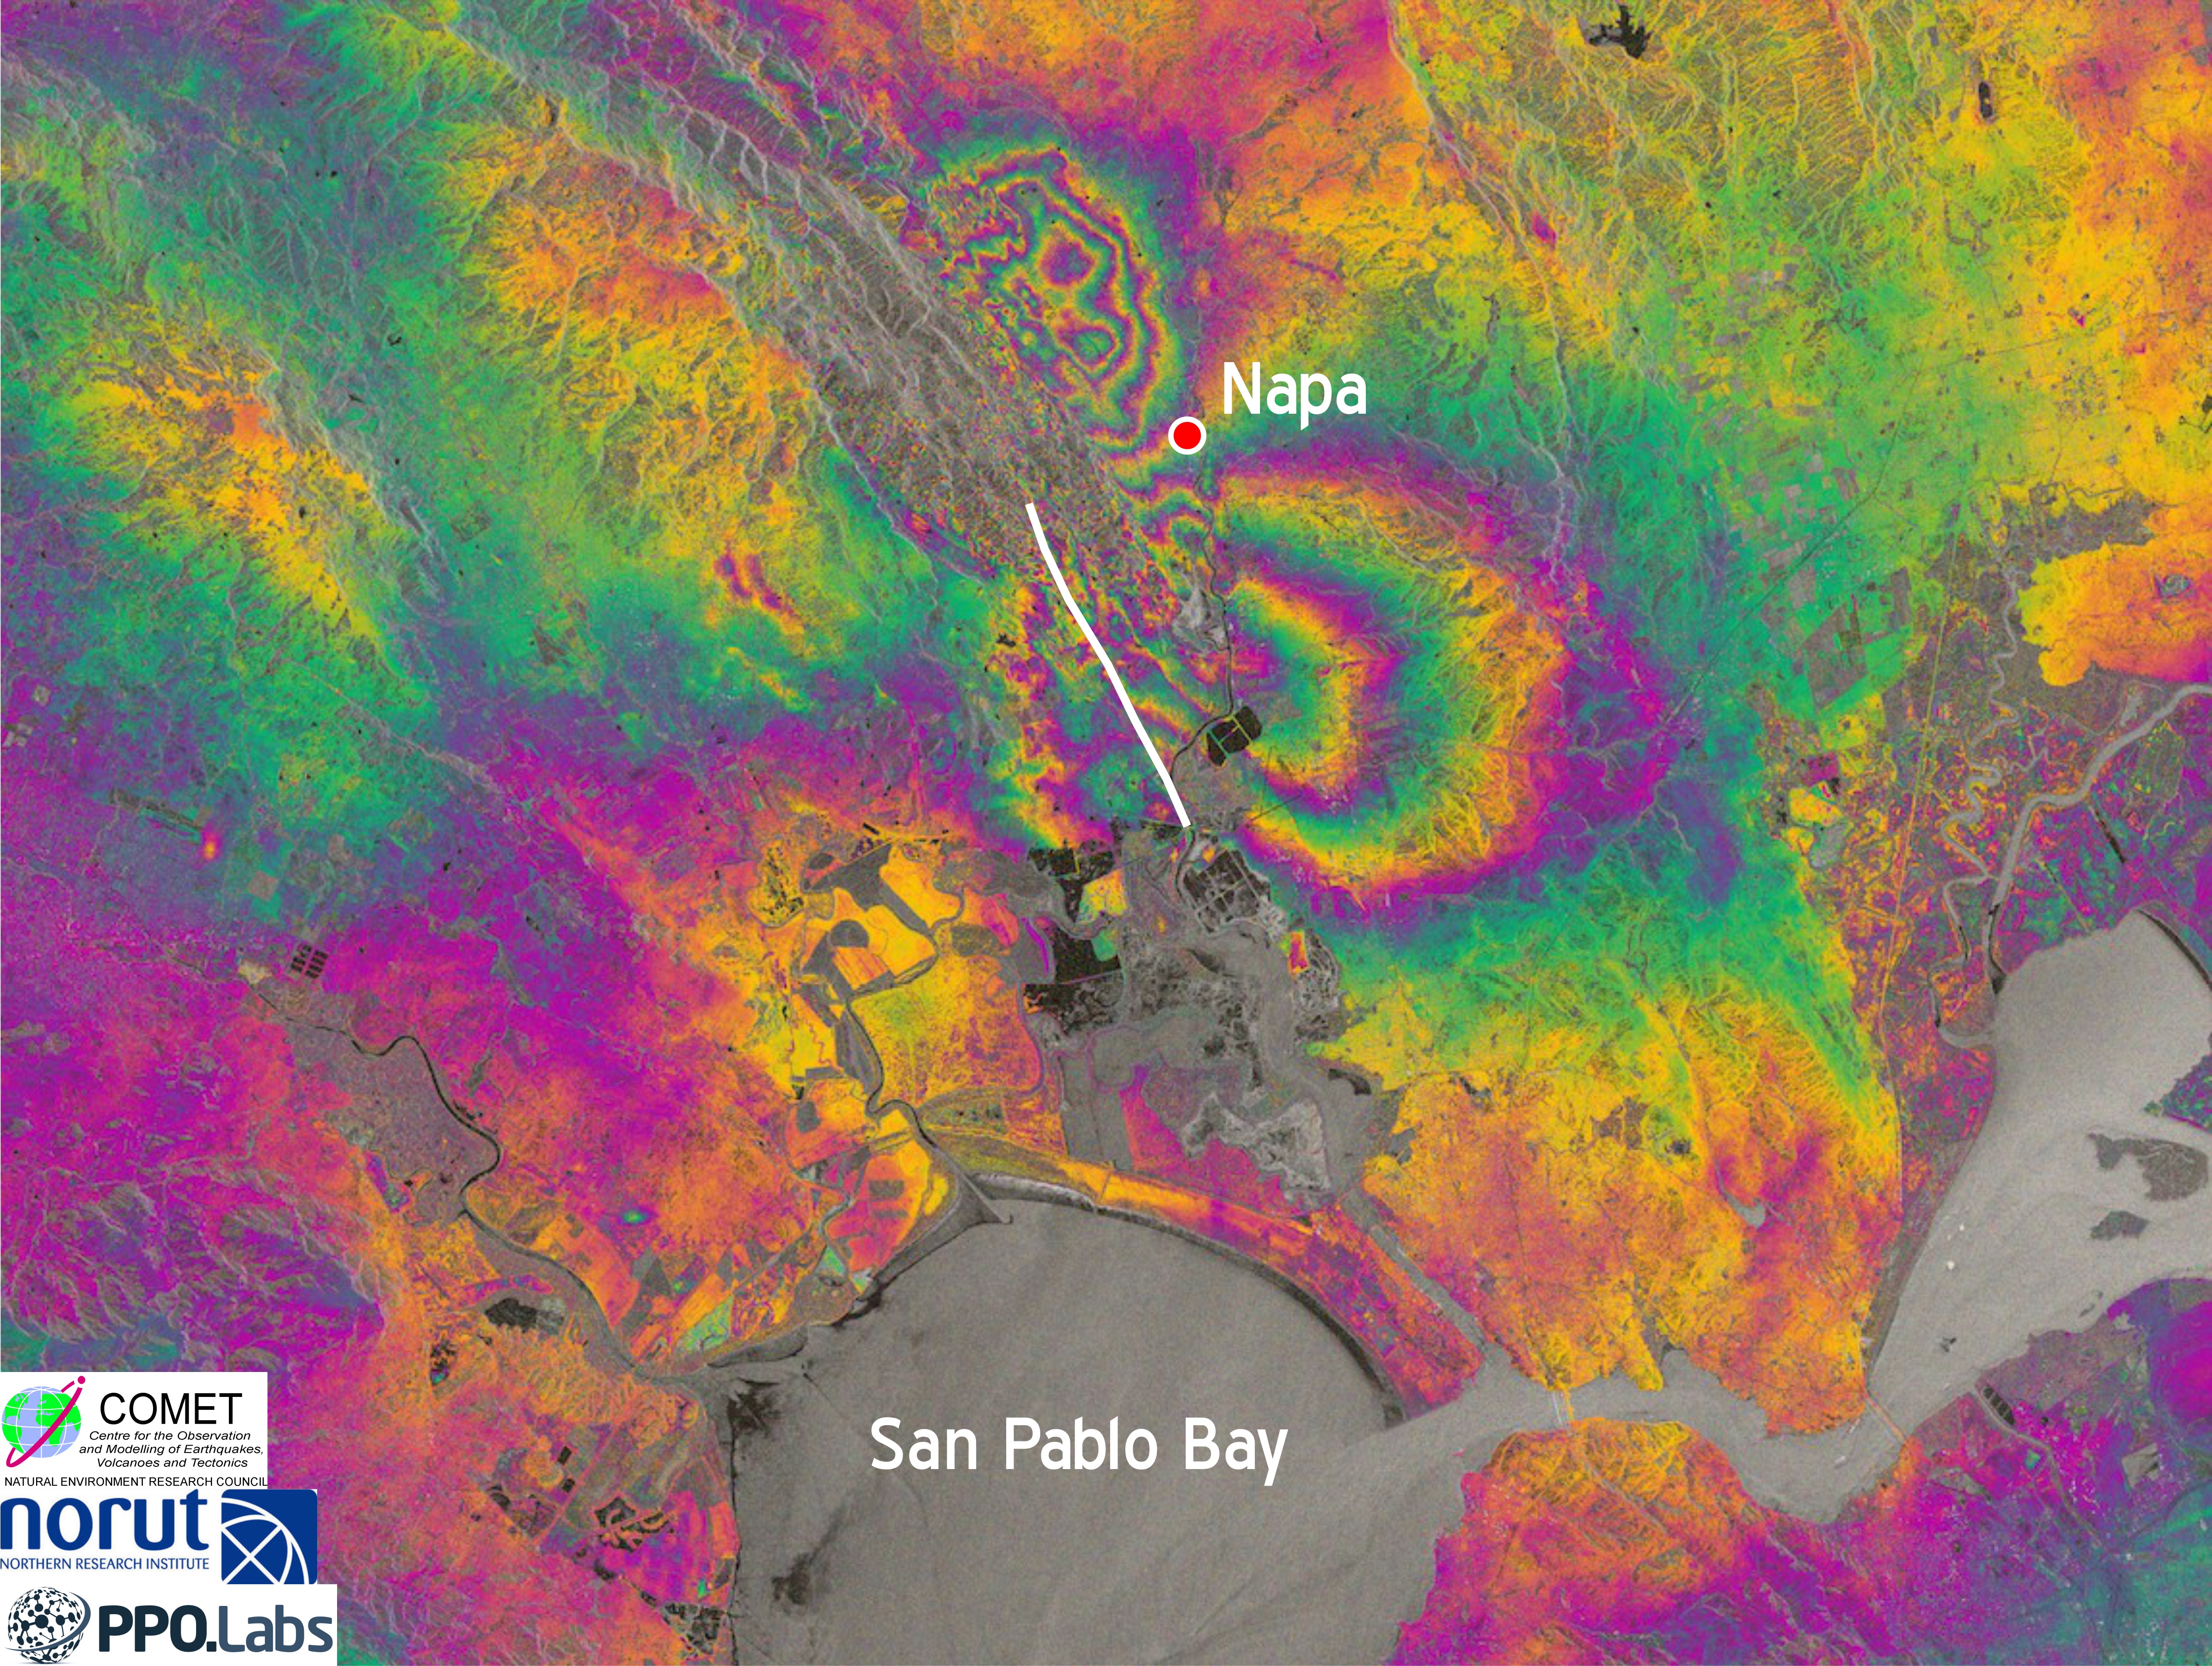
Sentinel-1A interferogram of the ground deformation due to the August 24th earthquake, Napa, California. The surface fault rupture (mapped in the field by UC Davis scientists) is shown by the white line. Image created by Dr Yngvar Larsen, from the research institute Norut in Norway, and Dr Petar Marinkovic, from PPO.labs in the Netherlands. Copyright: Copernicus data (2014)/ESA/PPO.labs-Norut–COMET-SEOM Insarap study.
The interferogram was created by COMET collaborators Dr Yngvar Larsen, from the research institute Norut in Norway, and Dr Petar Marinkovic, from PPO.labs in the Netherlands. Sentinel-1A was launched on 3 April 2014, but it only reached its final operational orbit on 7 August. The pre-earthquake image was acquired on that day. By comparing it with an image acquired on 31 August, it is possible to create a map of the surface deformation caused by the magnitude 6.0 earthquake by looking at the difference in time it takes the signal to reach the satellite.
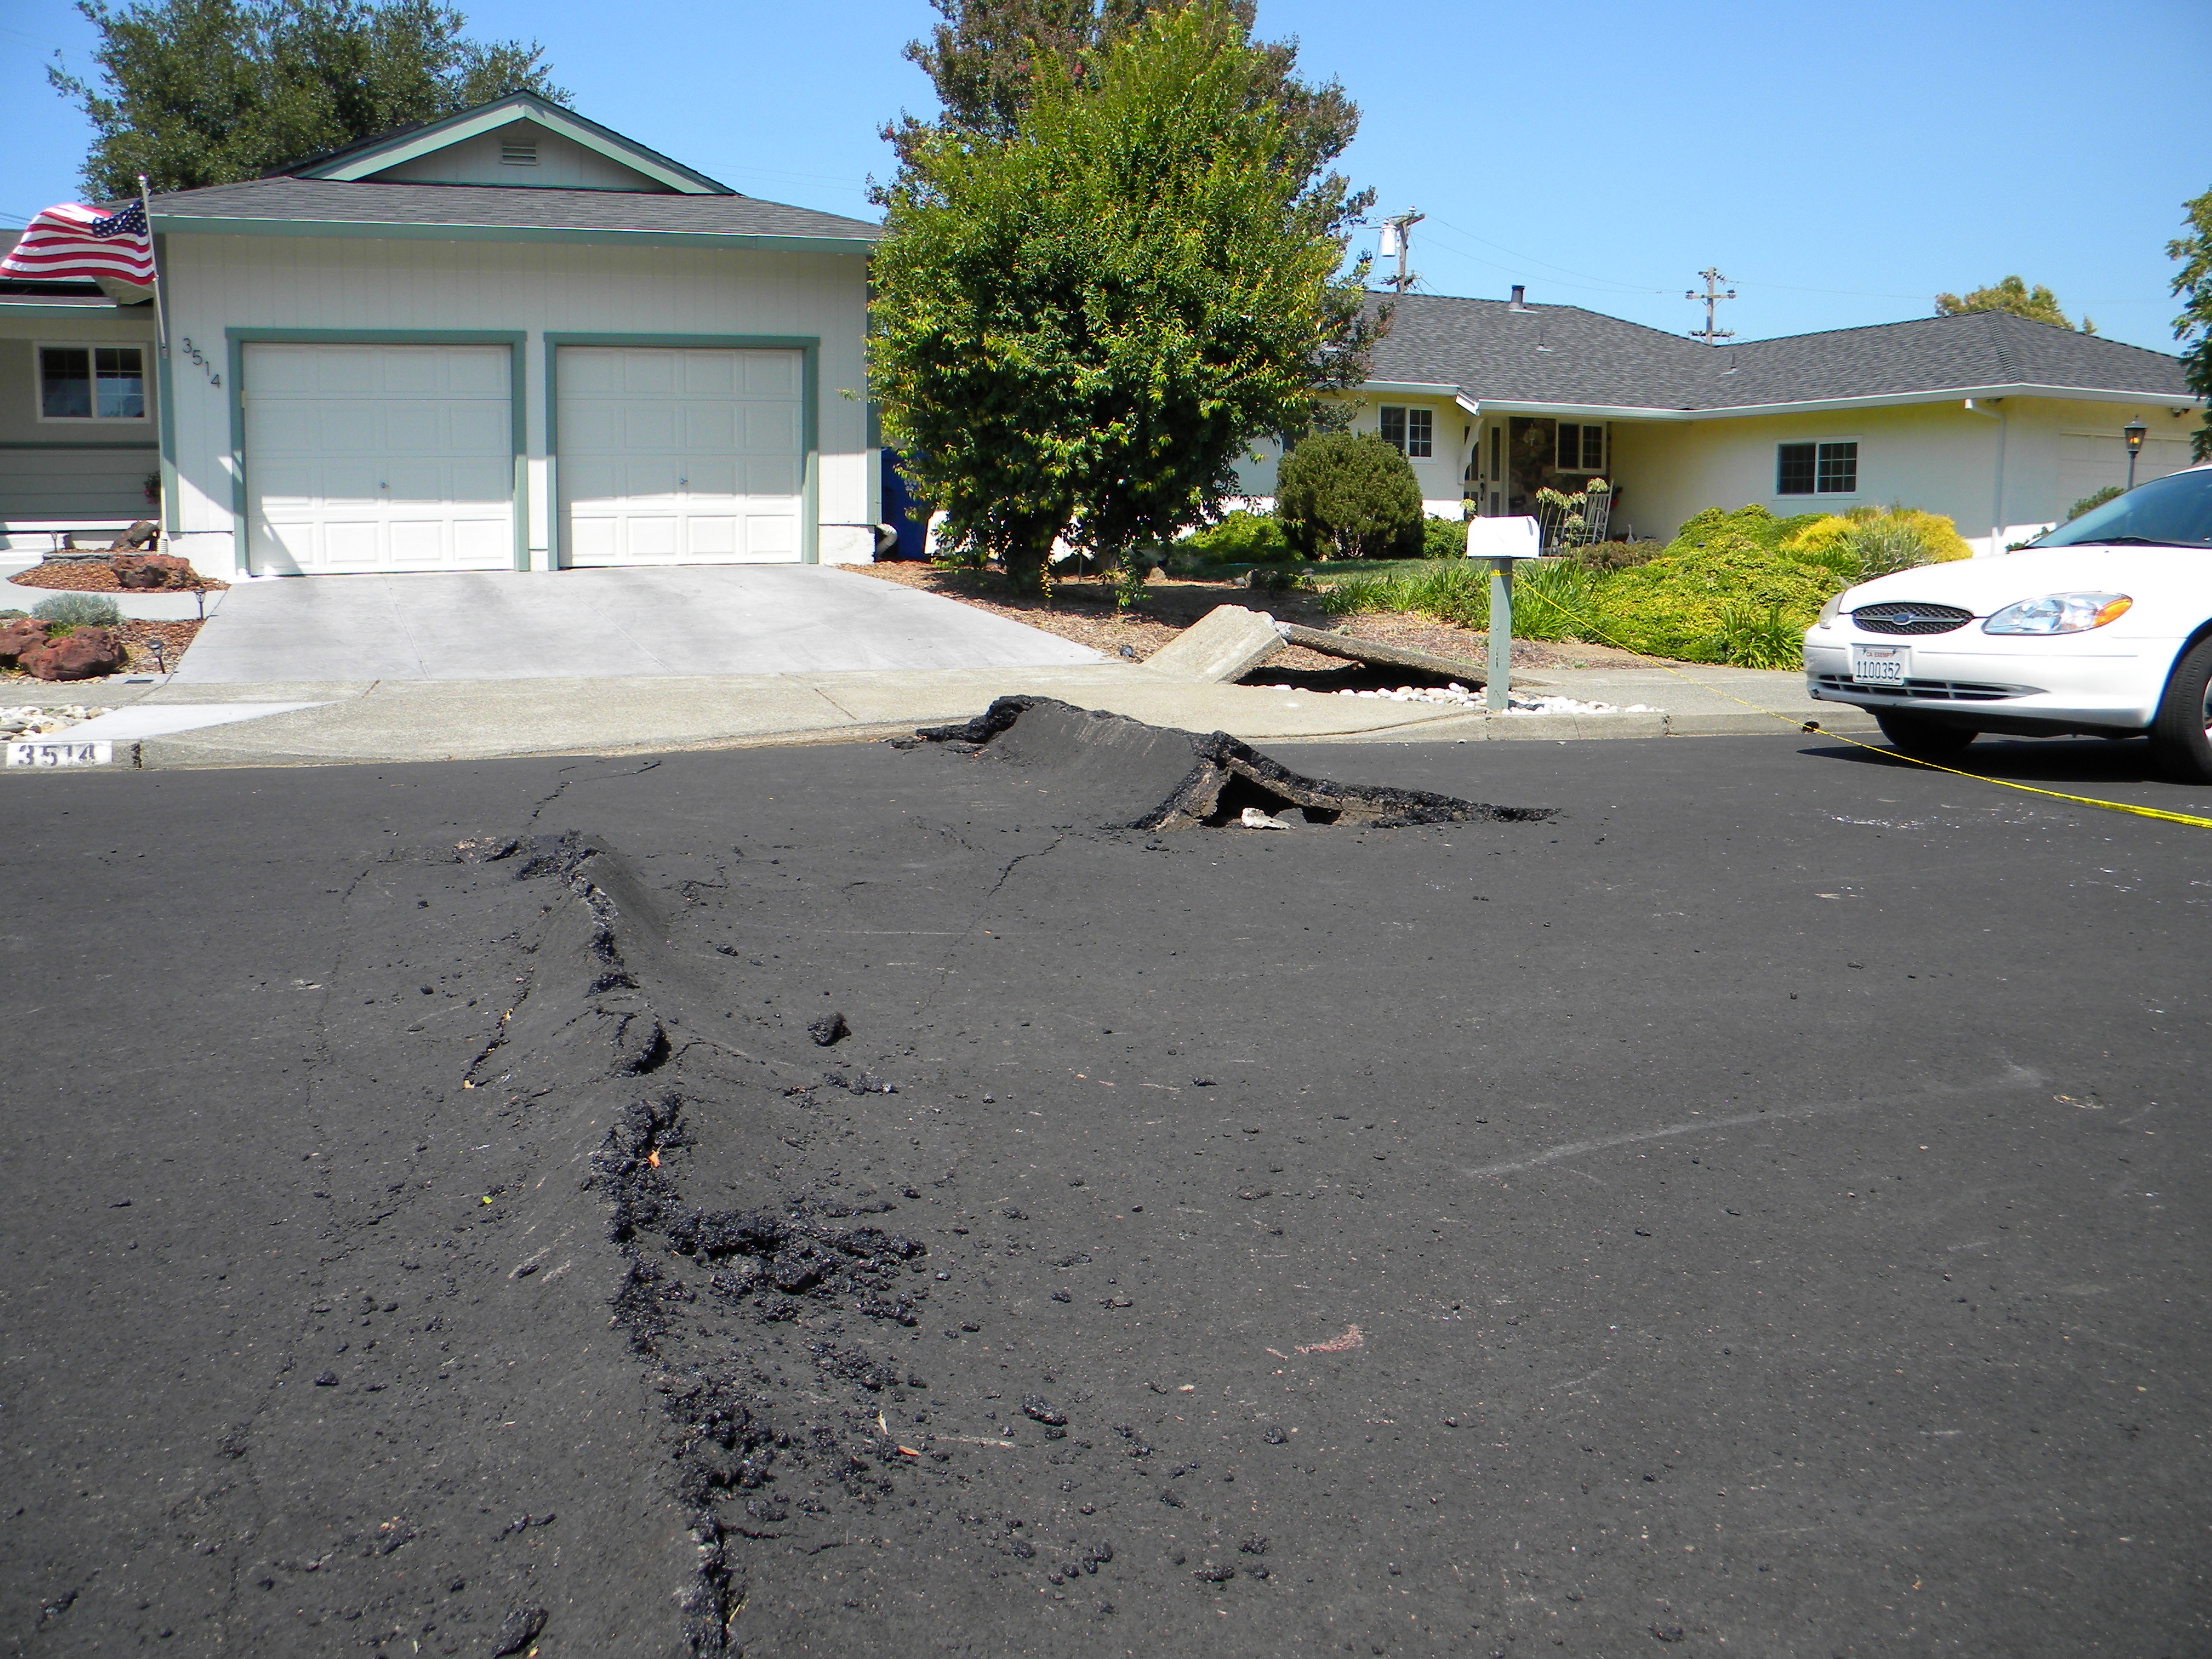
Fault damage in the suburbs west of Napa, California from the August 24th magnitude 6 earthquake. The fault rupture ran through homes and across roads, buckling the tarmac surface and pavements, resulting in damage expected to cost hundreds of millions of dollars. Photo credit: Austin Elliott, UC Davis.
The earthquake occurred north of the Bay Area, California, in a part of the fault system which runs down the length of California and includes the San Andreas Fault. However, this particular earthquake occurred on one of the parallel fault systems 40 km east of the San Andreas. This earthquake is the biggest to hit the San Francisco Bay Area since the Mw 6.9 Loma Prieta earthquake in1989, although this most recent earthquake was many times smaller.
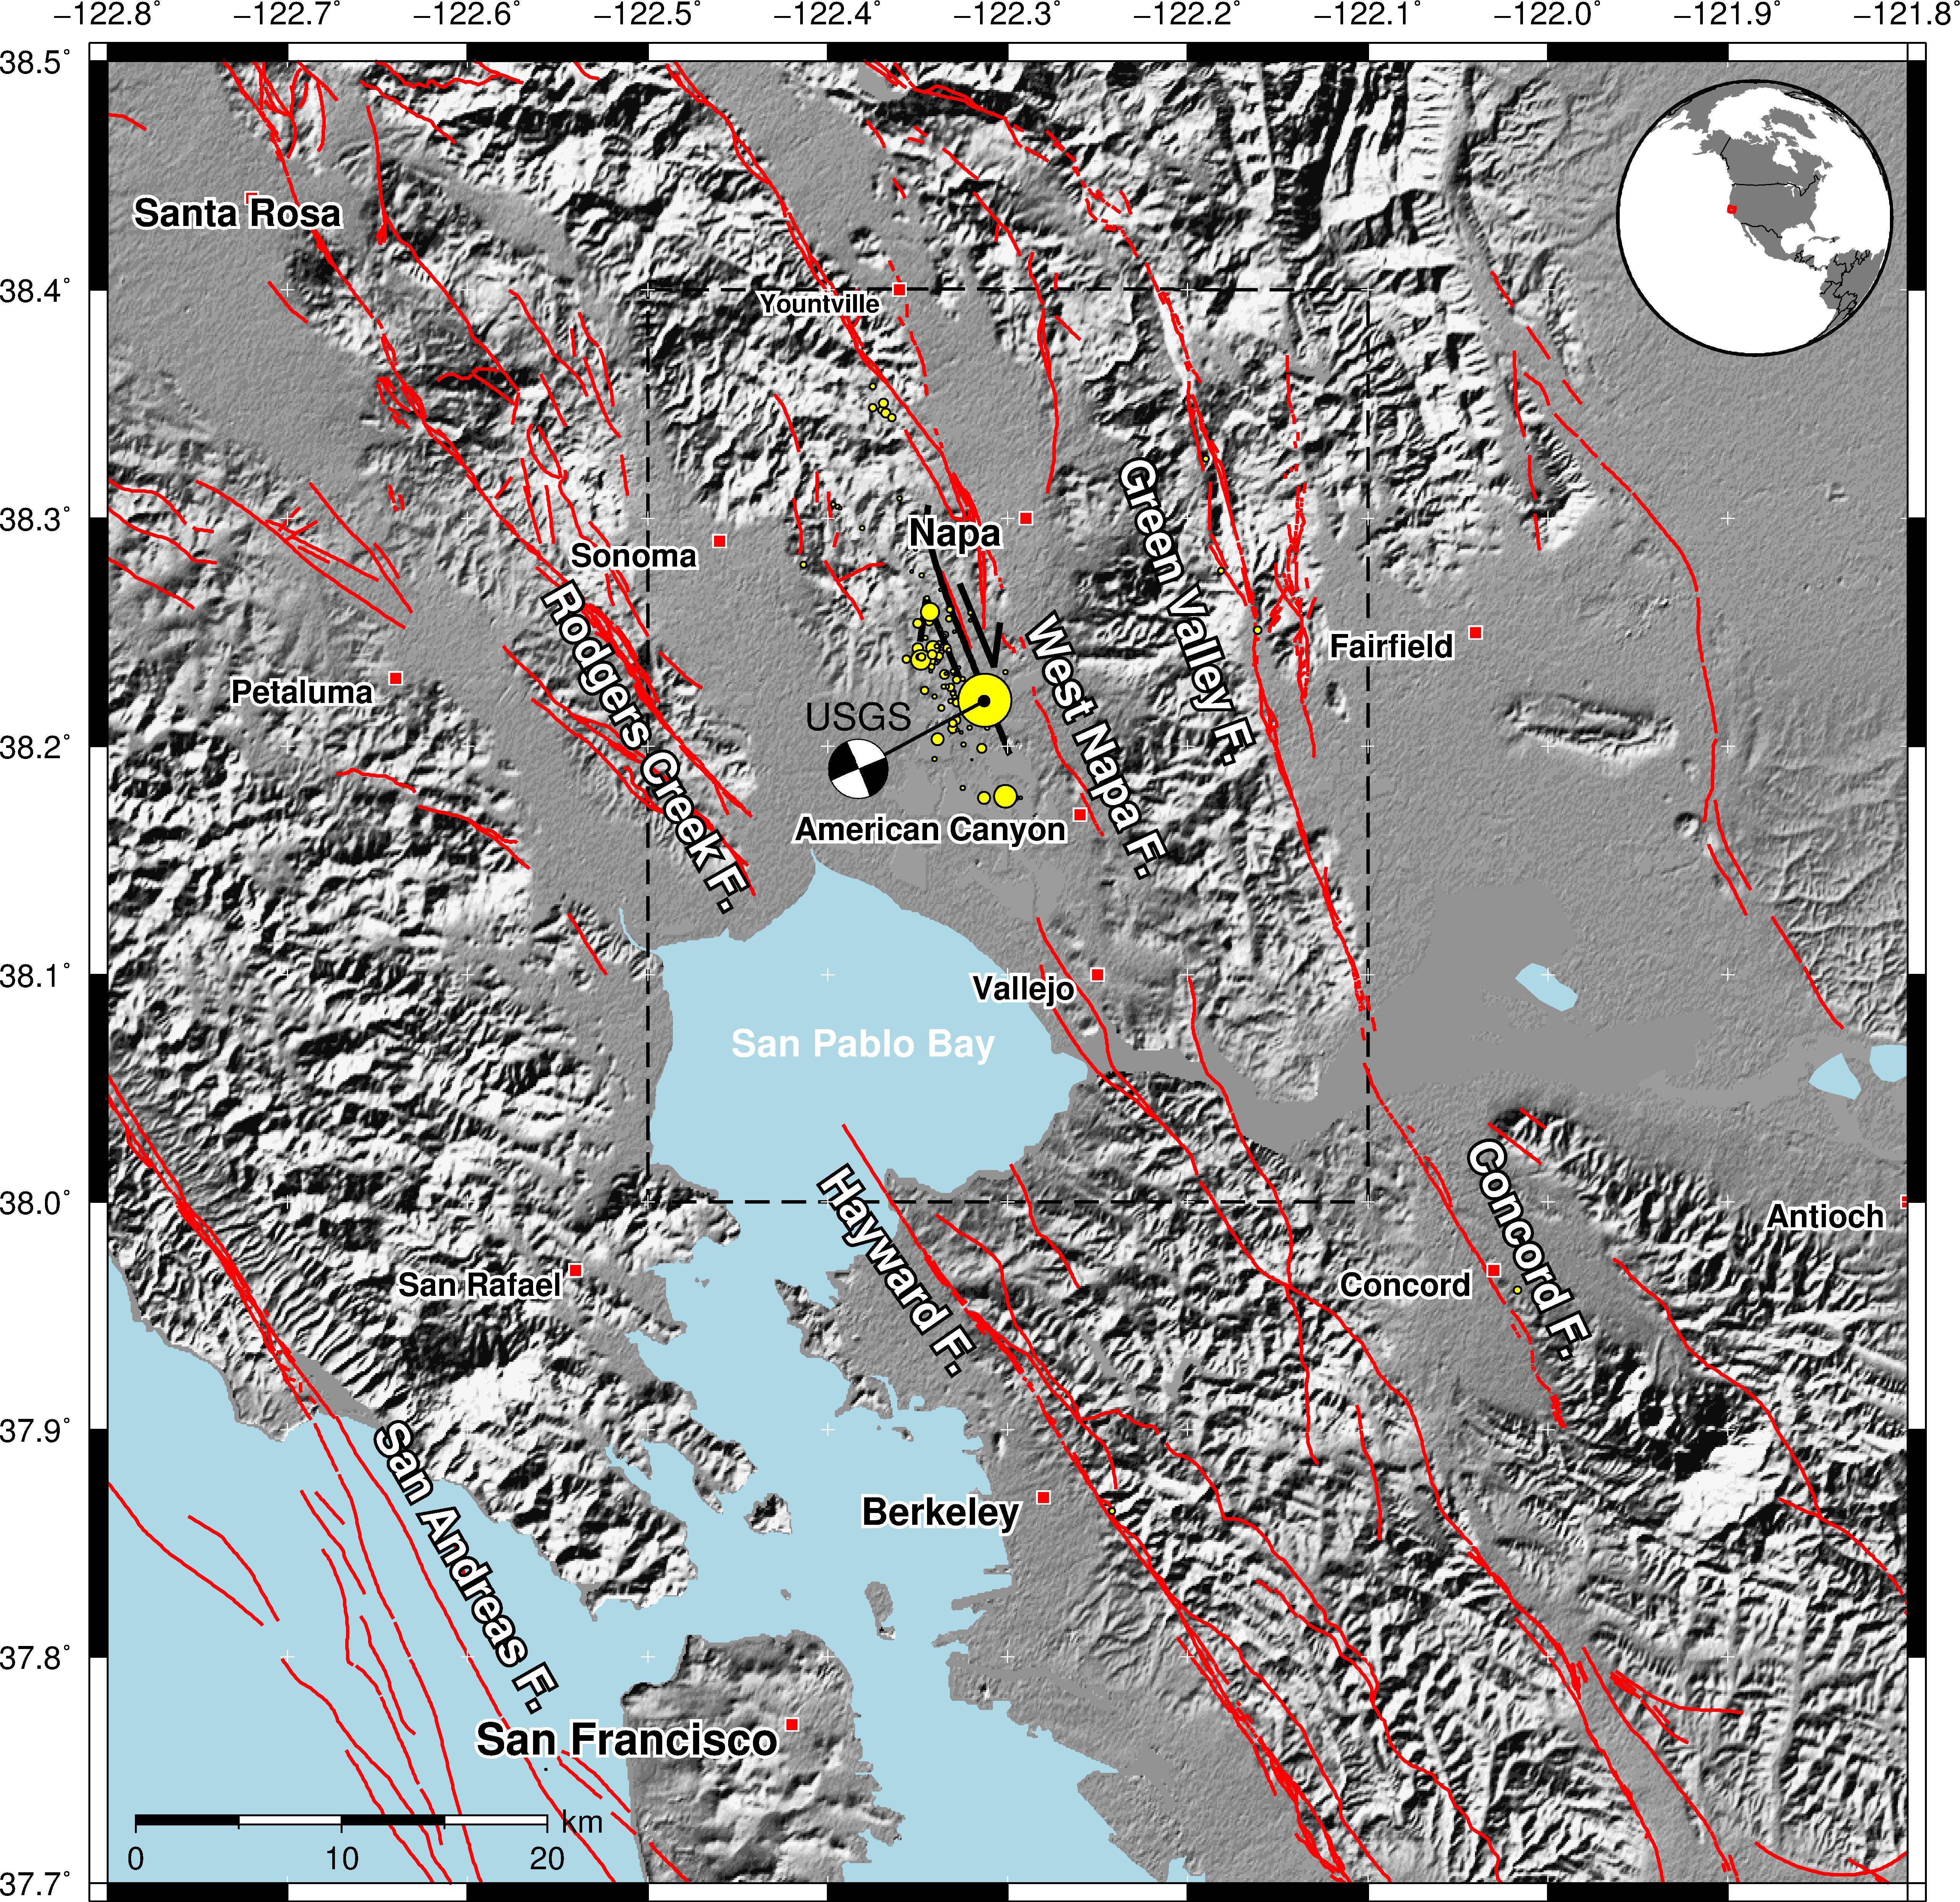
Fault map (red lines) of the region around the Napa Valley earthquake, California. The fault rupture (mapped by UC Davis scientists) resulting from the August 24 earthquake is shown by the black line, south-west of Napa. The mainshock and smaller aftershocks are denoted by the yellow circles. Earthquake locations and existing fault locations sourced from USGS. The dashed line denotes the regions shown in the other figures.
The extent of the ground deformation in interferogram shows that the fault slip which occurred in this earthquake continues further north than the extent of the mapped rupture at the surface. The interferogram shows that the southeast-side of the rupture has moved towards the satellite by about 10cm, whilst the northern portion has moved away by 10cm. Whilst most of the motion in a strike-slip earthquake is horizontal in the direction of the fault, the ground motion at the end of these fault ruptures is a combination of fault perpendicular and vertical. This interferorgam shows up-down and to a lesser extent east-west motions. On the east side of the fault, these motions are in the same direction, either both towards or both away from the satellite, resulting in a large signal. However on the western side of the fault, the east-west and vertical motions are in the opposite sense, cancelling each other out and explaining the asymmetry seen in the deformation pattern across the fault.
(left) Sentinel-1A (European Space Agency) interferogram of the ground deformation from the Napa earthquake. The contours show the ground motion towards and away from the satellite. The black line denotes the surface rupture mapped in the field by scientists from UC Davis. (right) The same interferogram processed to show the total motion towards and away from the satellite. South of the town of Napa, the ground has moved towards the satellite by up to 10 cm (red colours), whereas to the north it has moved away by 10 cm (blue colors). Despite being a strike-slip earthquake in which most motion is horizontal, the satellite measures mainly vertical and east-west motion and sees the ends of the rupture bulge up (and eastwards) at one end (towards the satellite in the south) and down (and west) at the other. The mainshock and smaller aftershocks are denoted by the yellow circles. Earthquake locations and existing fault locations (red lines) are sourced from the USGS. Copyright: Copernicus data (2014)/ESA/PPO.labs-Norut–COMET-SEOM Insarap study.
The small surface displacements measured in the interferogram agree with the small offsets measured in the field by geologists surveying the fault rupture, who find displacements in roads and kerb stones of about 10-20 cm.
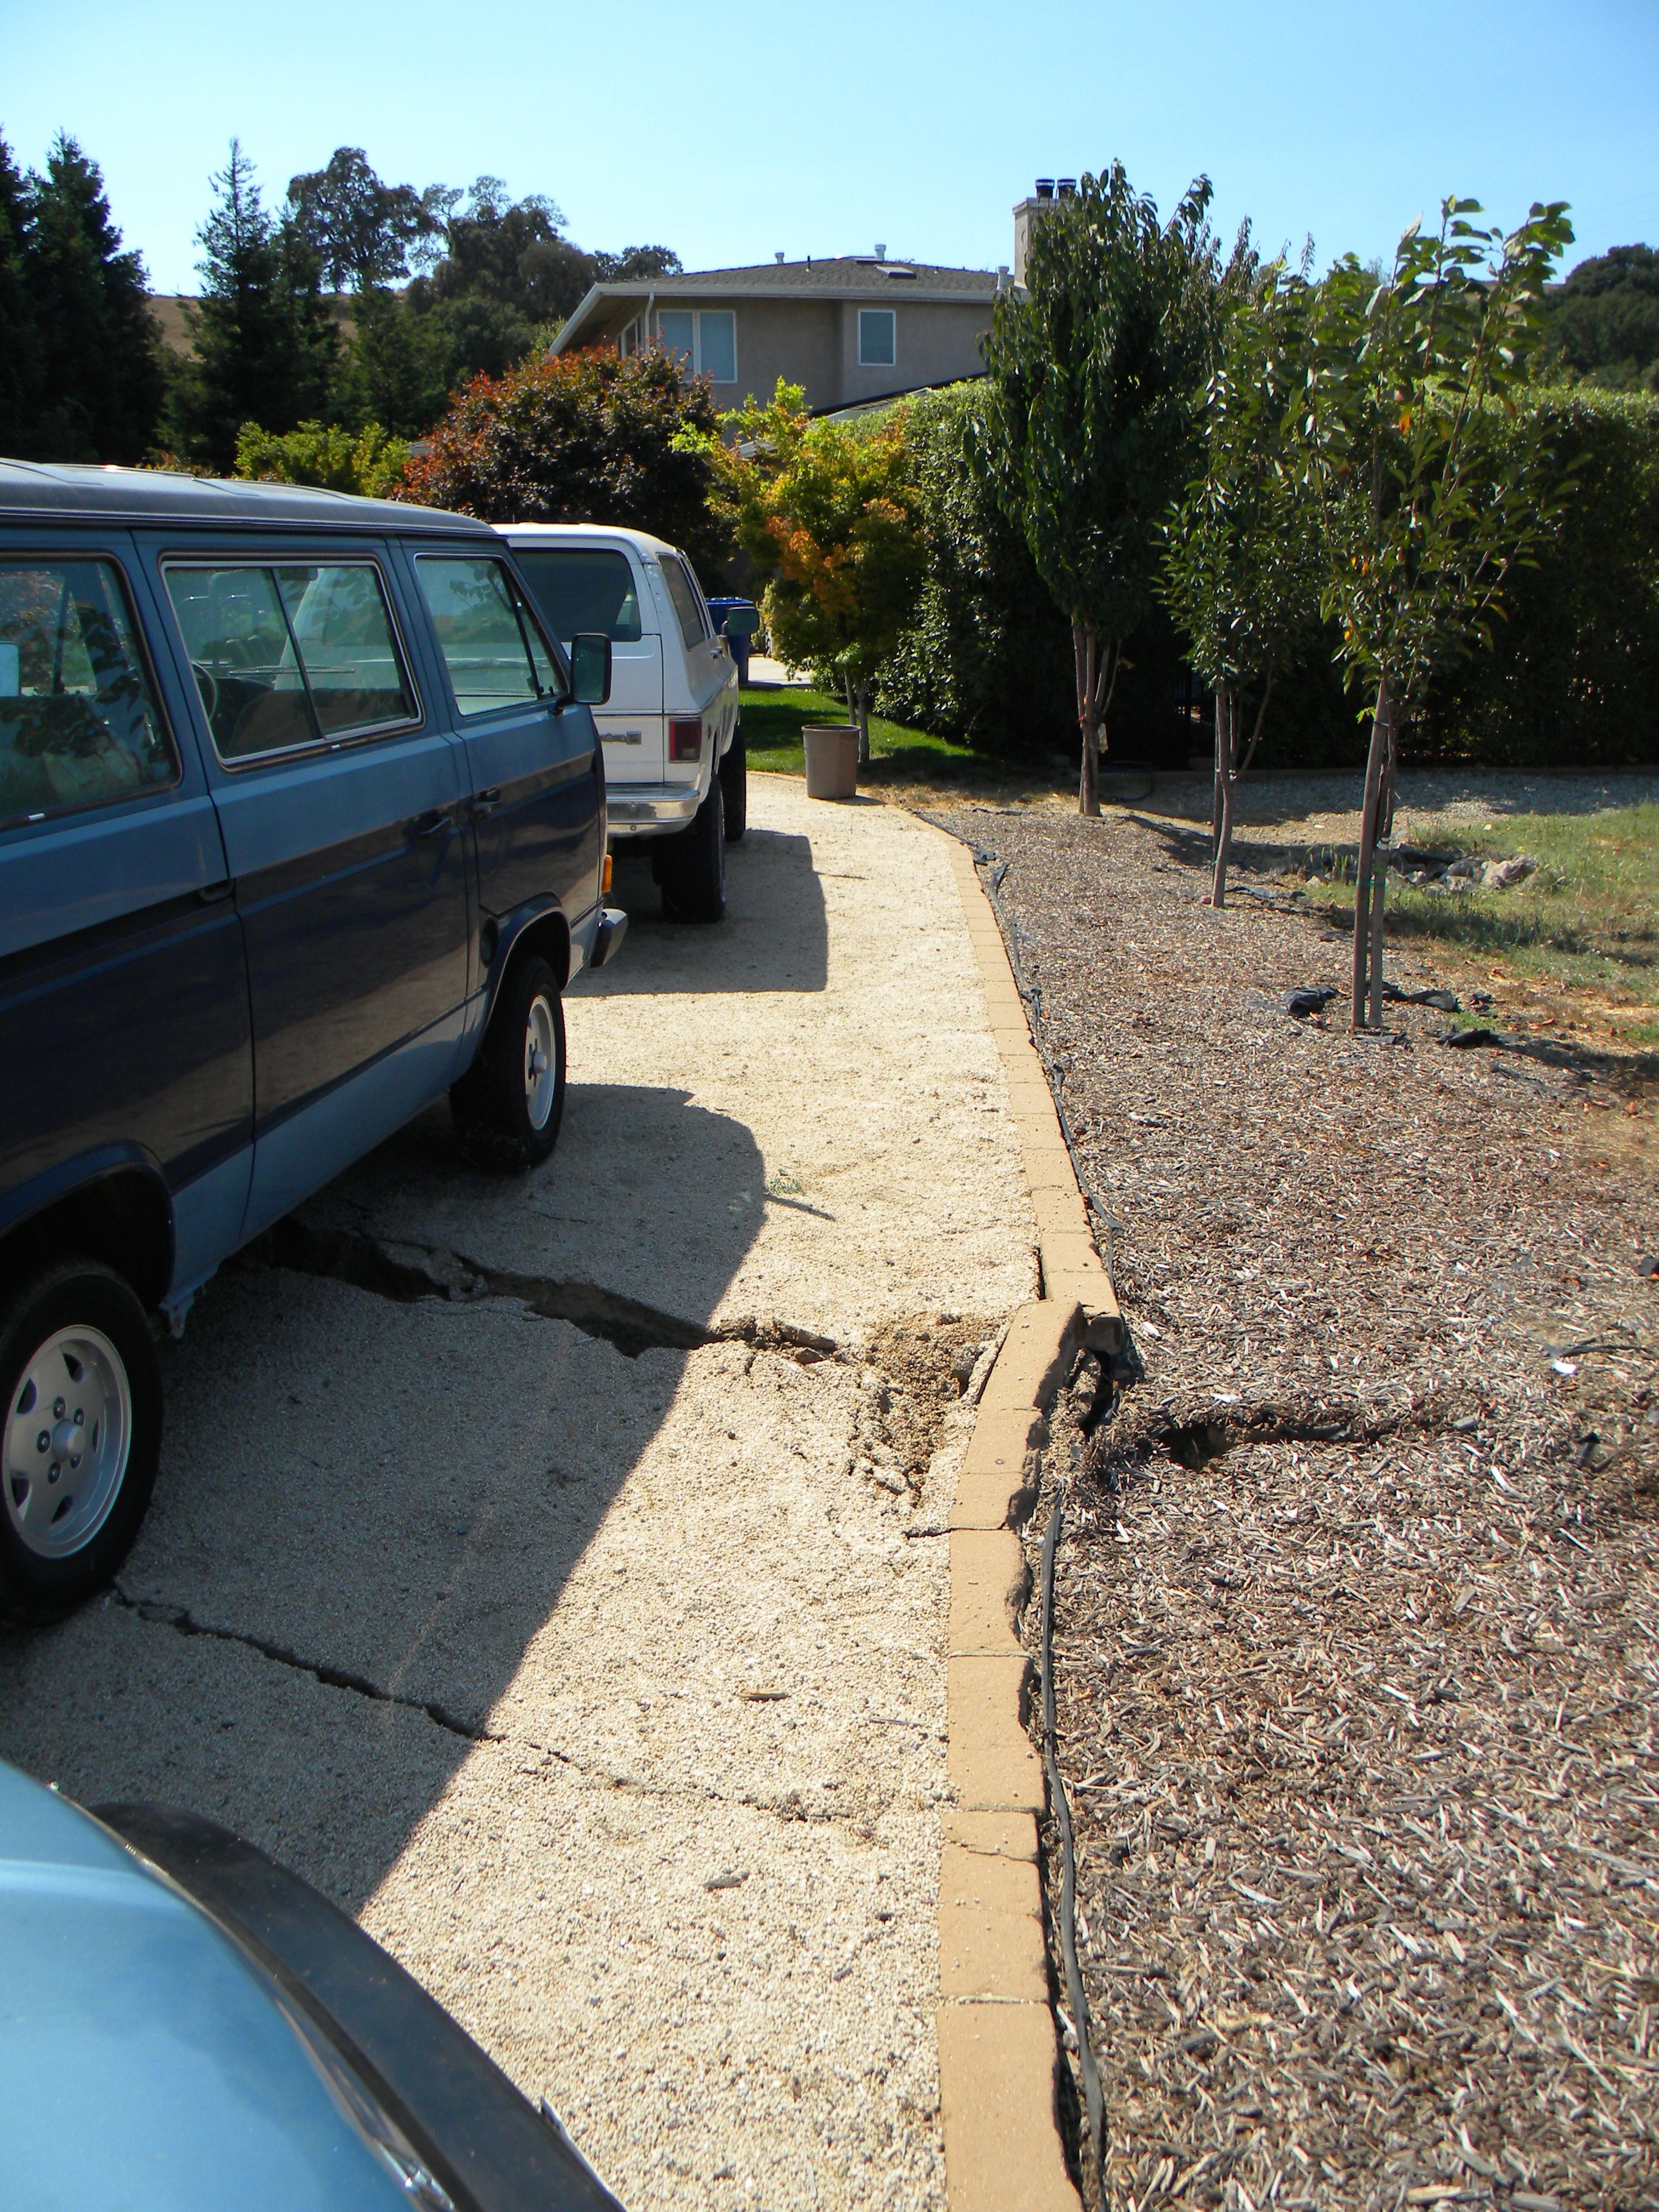
The surface rupture offset kerb stones to the right by about 10-20 cm. This relative motion is consistent with the right-lateral strike-slip faulting in this earthquake. This photo is taken at the northern end of the fault rupture, on the West side of Napa. Photo credit: Austin Elliott, UC Davis.
The interferogram also reveals other portions of the fault system that have moved slightly in this event. Sharp lines in the interferogram known as discontinuities, show minor movements on other faults, such as the part of the West Napa Fault system that crosses Napa airport.
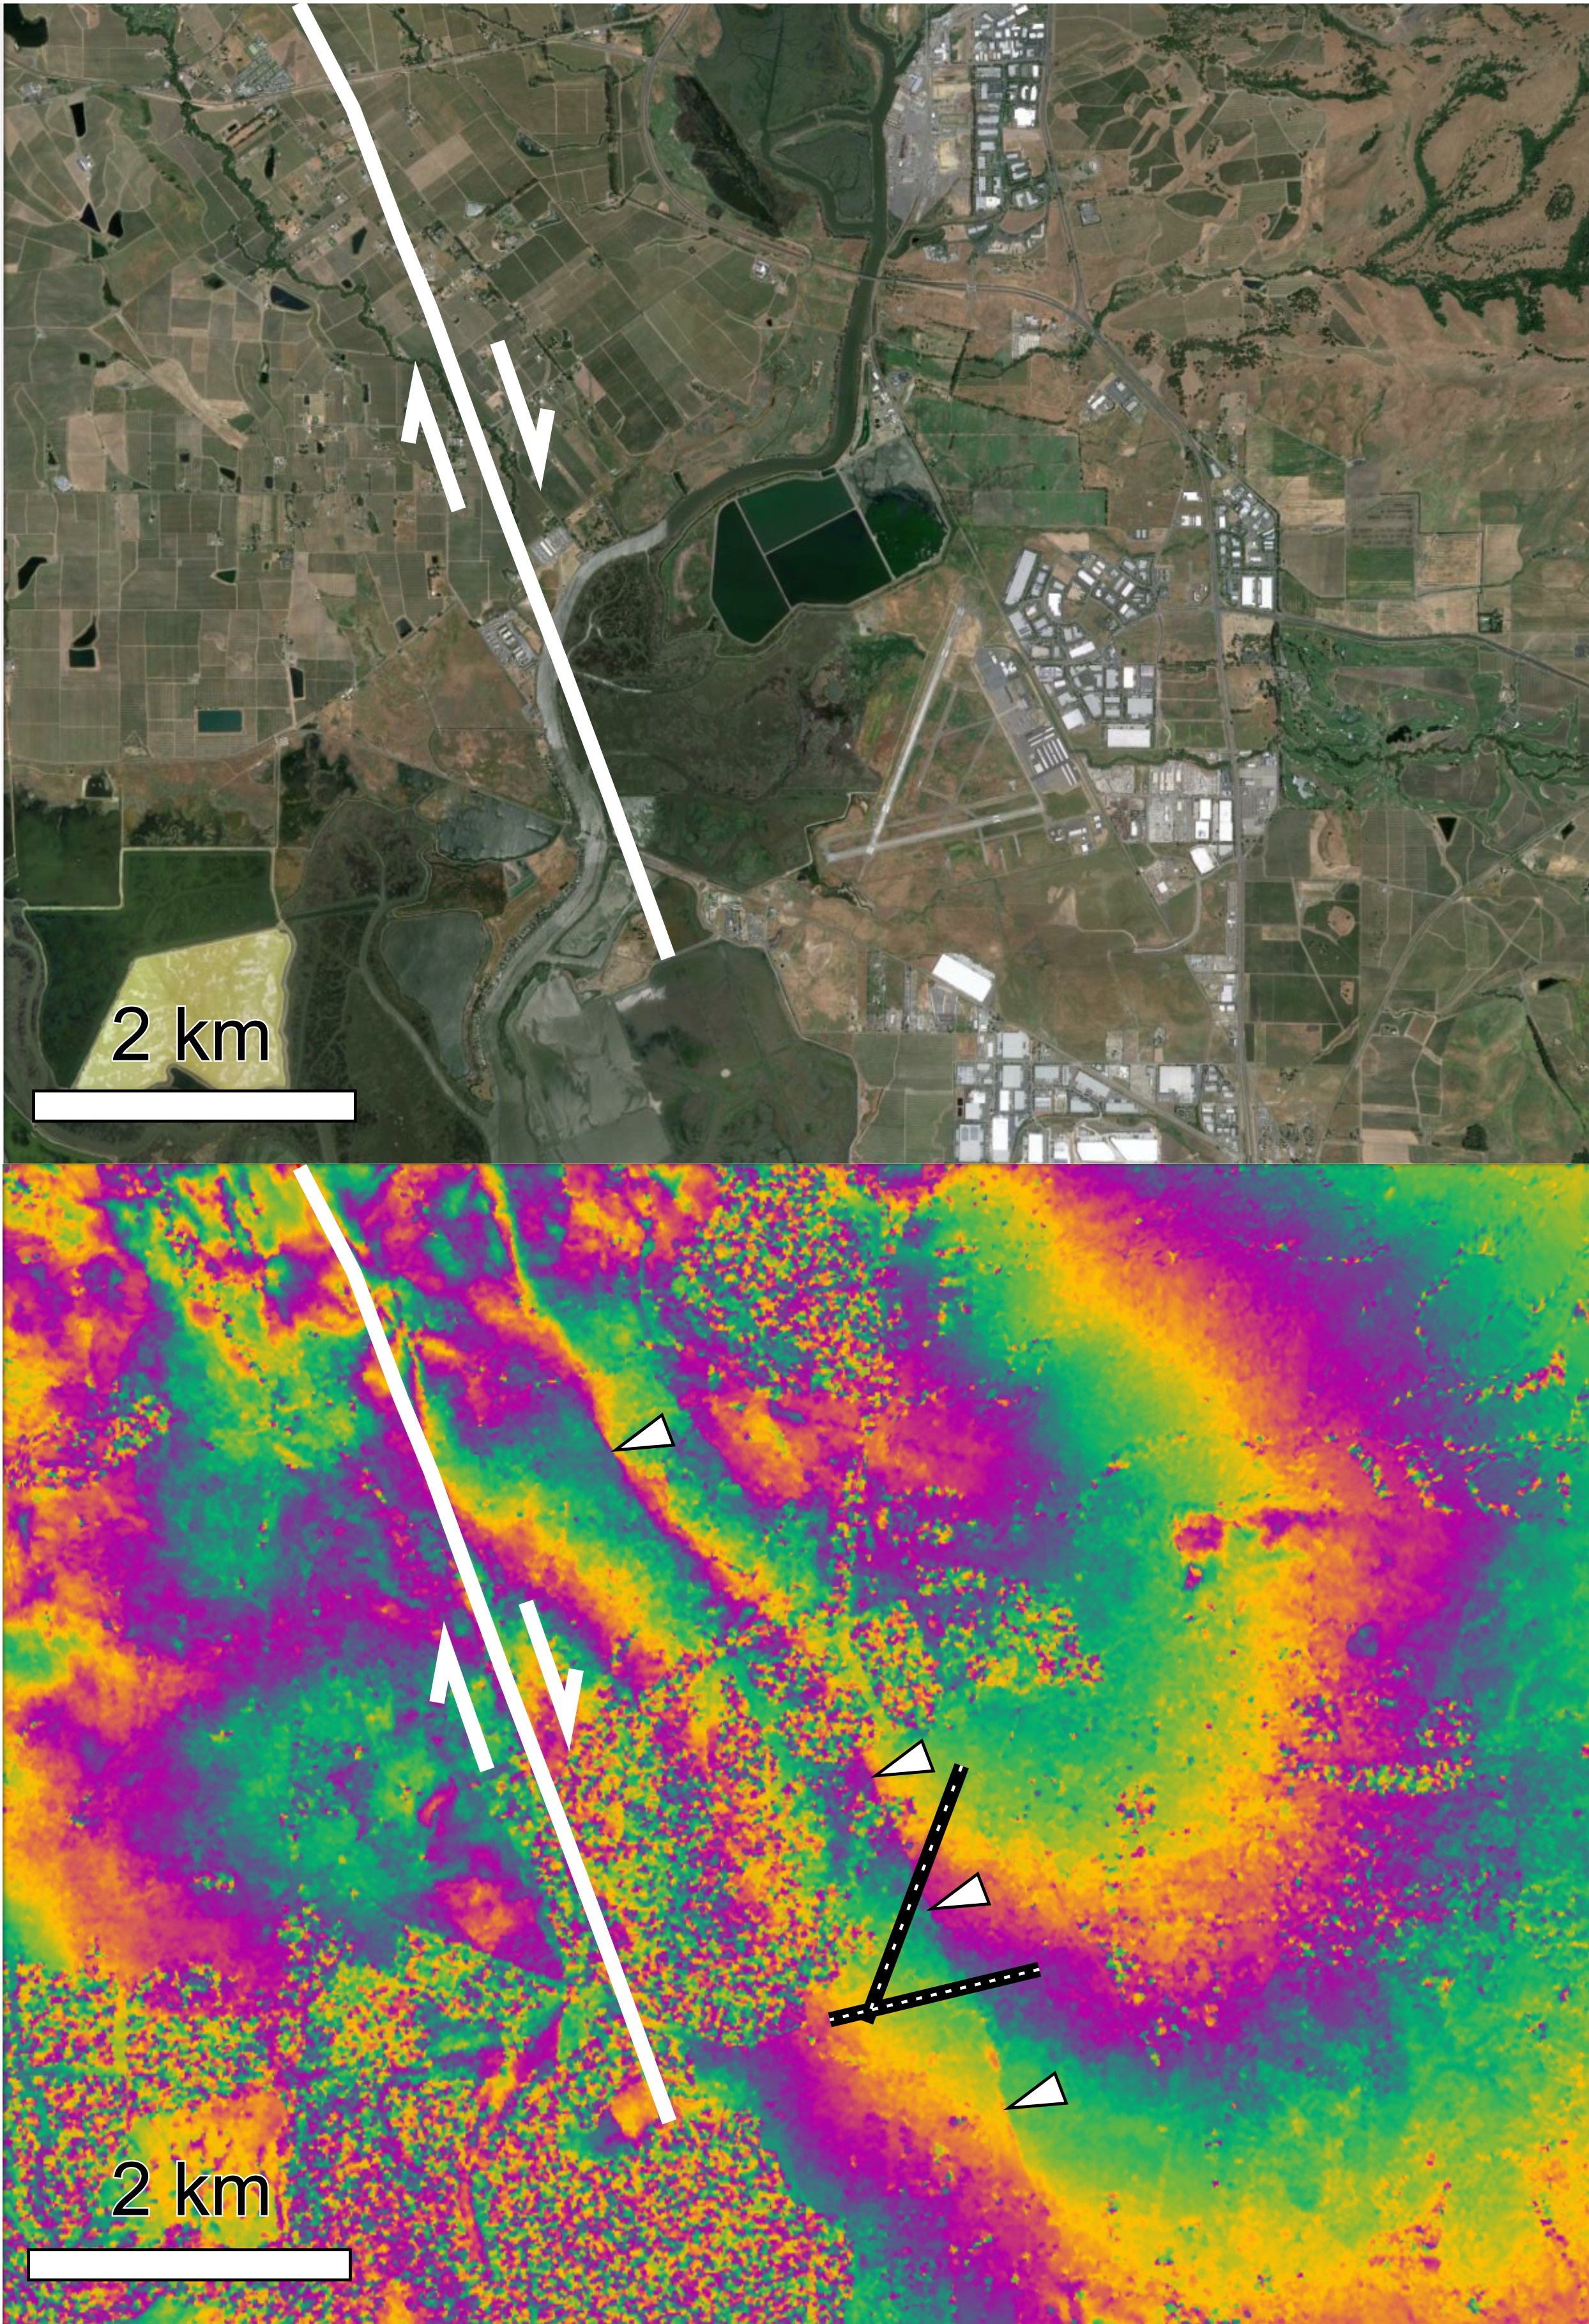
(top) Satellite image of Napa County Airport, five miles south of Napa (GoogleEarth) and the southern extent of the mapped surface rupture (shown in white, UC Davis). (bottom) Sentinel-1A interferogram showing the deformation field around the fault. A small discontinuity running north-south is also visible in the interferogram (marked by white triangles) and is due to minor rupture of a parallel fault strand across the airport runways. Copyright: Copernicus data (2014)/ESA/PPO.labs-Norut–COMET-SEOM Insarap study.
When the Sentinel-1 constellation is fully operational (with the launch next year of the identical Sentinel-1B satellite), the average time delay between an earthquake and a radar acquisition will only be a few days. This will enable COMET & EwF researchers to analyse the surface deformation more quickly following earthquakes.
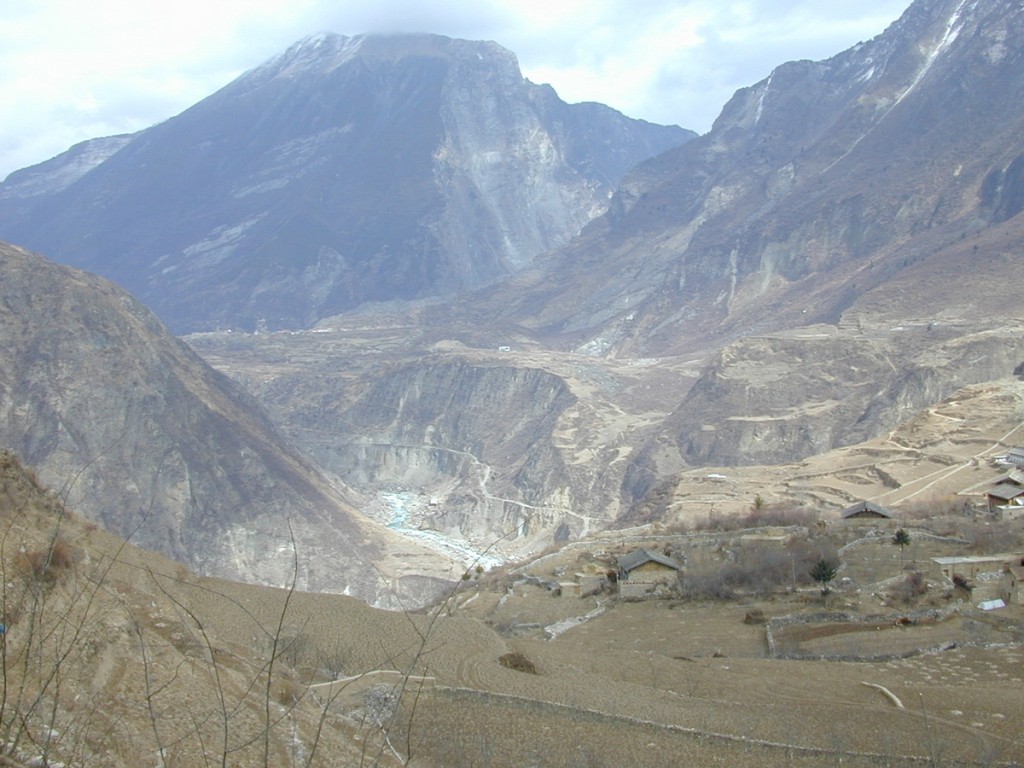 One of the topics that has emerged as a major concern across the Earthquakes without Frontiers partnership during the first two years of the project is the problem of earthquake-triggered landslides. While it is well known that large earthquakes can trigger many thousands of landslides, and that those landslides form a major secondary hazard, many of our partners feel that they lack the tools necessary to adequately assess the likely extent of landsliding or prepare for the consequences. Investigation of this issue is the goal of one of the EwF project researchers, Dr David Milledge (Durham University).
To summarise the current state of our understanding of earthquake-triggered landslides, and to identify promising avenues for future research, more than 40 people gathered recently for a workshop at the College of St Hild and St Bede at Durham University. The workshop was supported by the Institute of Hazard, Risk and Resilience and the Department of Geography at Durham, and involved a series of speakers from the US and Europe. The presentations covered a number of different aspects of earthquake-triggered landslides, including the distributions of landslide areas and volumes (and how those can best be measured using available data), the controls on landslide location, and the long-term implications of landsliding for mountain range growth and development. Following this, there were about 10 shorter presentations from staff and researchers from Durham and elsewhere. These covered a wide range of topics, from the impacts of earthquakes on river sediment discharge and carbon cycling, to laboratory investigations of hillslope stability during earthquake shaking.
The next day, a smaller group met to discuss the state of the field and to identify outstanding research questions, resulting in a list of promising research themes. The group also discussed the need for a short commentary on the costs of earthquake-triggered landslides, as well as possibilities for a wider research network around the topic. Some of the key questions that are relevant to the EwF project are listed below; while we currently lack general answers to these questions, they provide a blueprint by which we can increase our understanding, and thus our resilience, to these secondary hazards.

Laser scanning of the fault scarp at the surface where it crosses a road. This offers the potential for future repeated measurements that would show if the fault is creeping, and also produce a comparison to satellite derived observations of creep. Erhan Altunel, Yunus Kurban and David Mackenzie.
In October 2011 a magnitude 7.1 earthquake struck the cities of Van & Ecriş in Eastern Turkey killing over 600 people. Using satellite radar measurements, EwF scientists were able to precisely map the fault segments that ruptured in this event.. These observations were critical in showing that the slip in the earthquake remained buried between 8 and 20 km underground. However, this leaves a large shallow portion of the fault nearer the surface that has not broken, and field observations show that this fault is capable of rupturing in earthquakes, posing a continuing hazard to this city of half a million people.
Field excursions to the earthquake area were made in 2013 and 2014 to collect samples along the fault and measure the height of the scarp. These measurements will be used to calculate the slip rate along this fault segment. Also, additional splay fault segments have been identified in and around the city that may also have the potential to rupture. Understanding the behaviour of faults is crucial to determining whether they are able to stably slide over many years, or whether they are locked and can rupture seismically. This work is done in collaboration with in country partners in Turkey at the University of Eskisehir (Prof Erhan Altunel and Master’s student Yunus Kurban), and forms part of David Mackenzie’s (University of Oxford) PhD project.
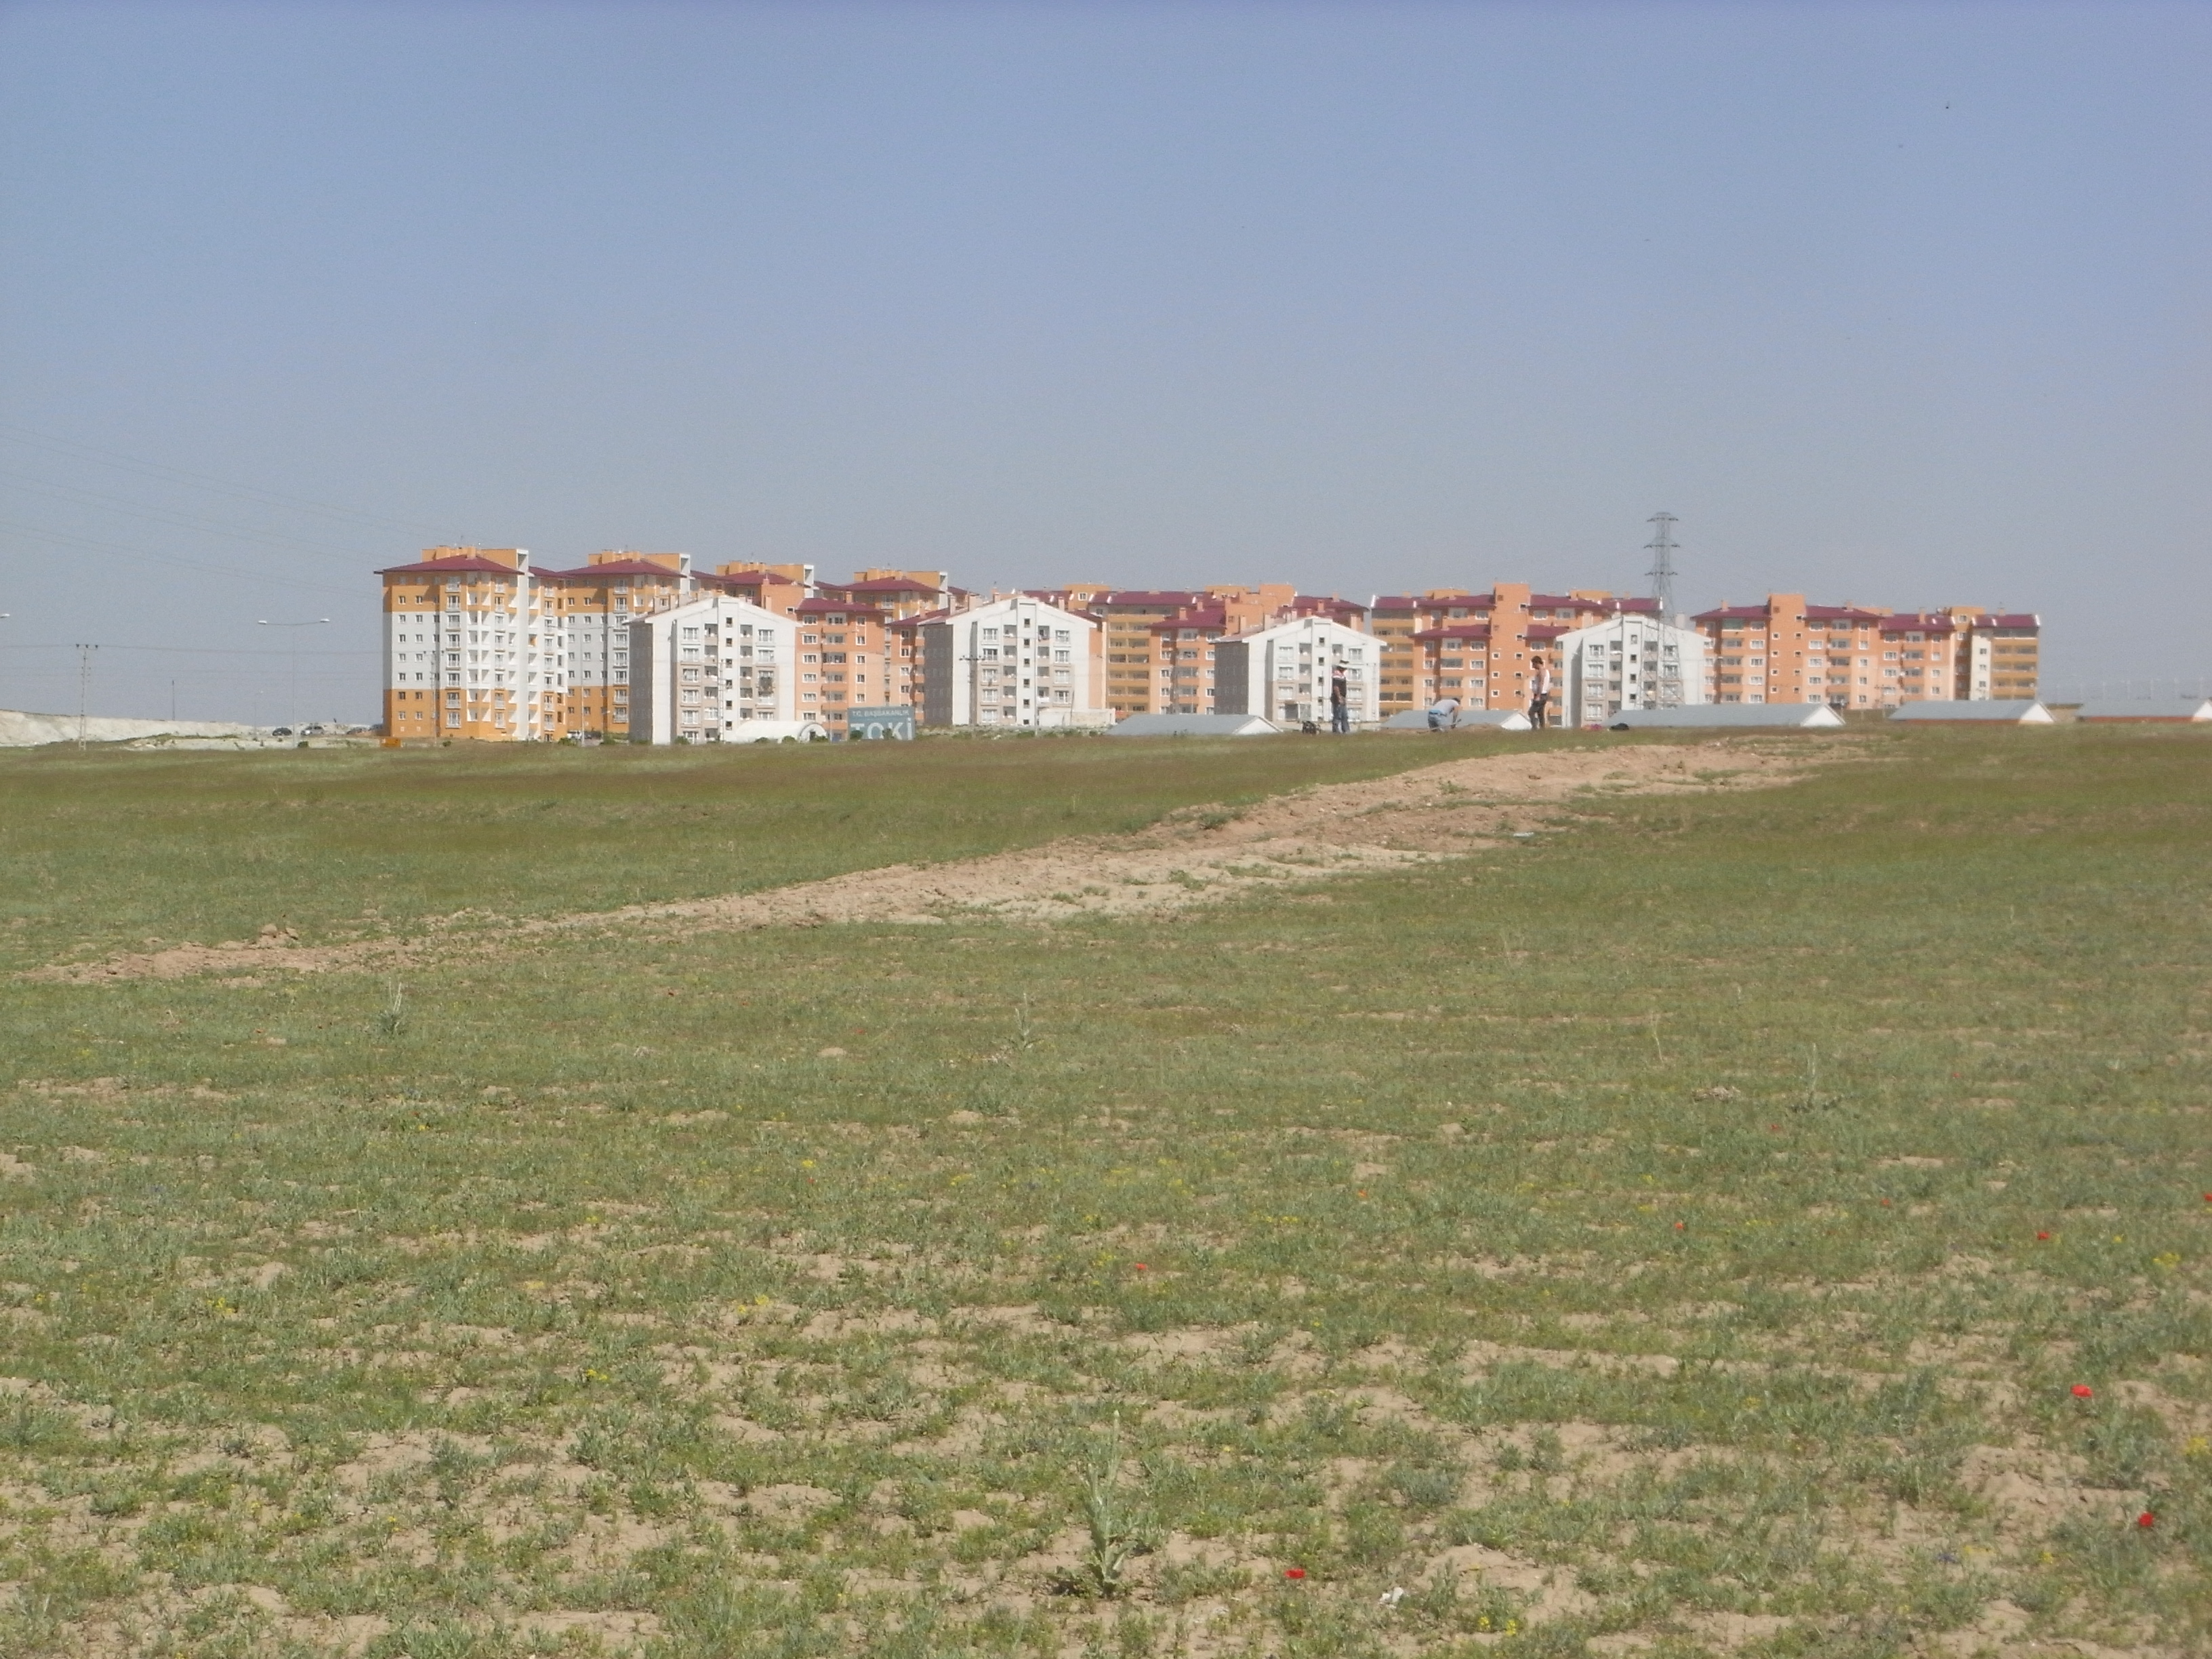
New apartment flats built at the northern end of the city of Van after the earthquake. The fault outcrops at the surface in the immediate foreground. The proximity of buildings to the fault highlight the importance of assessing the earthquake potential on this fault.

A sudden release of energy and the snapping of the Earth’s crust can literally knock us off our feet. Earthquakes can also be responsible for landslides, tsunamis and sometimes volcanic activity. Thankfully, for most of us, quakes are likely to be the stuff of disaster movies, but around the world their effects can have devastating results.
EwF scientist John Elliott discusses recent earthquakes with a live audience at the Natural History Museum in London. He talks through his work as a scientist who uses satellites to study the very contortions of the Earth that occur in these events, exploring the cause, effect and difficulty in predicting future episodes. The Natural History Museum has regular talks from scientists to museum goers as part of their Nature Live series (of which this video was one, recorded in March 2014): http://www.nhm.ac.uk/nature-online/nature-live/index.html.
Video copyright: Natural History Museum.
Kate Ravilious
Data gathering needn’t always involve expensive instruments or exotic fieldtrips. Here in resource strapped Nepal, seismologists are tapping into the power of local people to collect information that could ultimately save many lives.
In places like California and Japan shake-maps, as they are known, are commonplace. Houses built on thick layers of sediment will be rattled much more than houses situated on granite bedrock for example. Detailed knowledge of local geology, plus dense arrays of instruments enable geologists to accurately predict which areas are going to wobble most when an earthquake arrives. This information ensures that funding can be targeted and spent in the areas which need it most. But here in Nepal the network of instruments is sparse and without these shake-maps it is very hard to know how best to spend the very limited funds and increase earthquake resilience in this earthquake-prone land.
Today I visited Nepal’s National Seismological Centre in Kathmandu. Lok Bijaya Adhikari took me to see their accelerometer – an instrument that measures the acceleration produced by an earthquake and tells you literally how much the ground moved. I enjoyed making my own very mini earthquake by jumping up and down, and watching the light come on, registering that the ground had moved. Countries that can afford a good network of accelerometers can use the data gathered during small earthquakes to assess which parts of a city shake most. But Nepal has just seven accelerometers to cover the entire country – not nearly enough to gather the local detail required to produce a shake map.
Instead Adhikari and his colleagues are tapping into a much cheaper and more plentiful resource: gossip. When something exciting happens we all love to tell our version of events. Last year the National Seismological Centre added a ‘Did you feel it?’ button to their local earthquake reports webpage (http://www.seismonepal.gov.np) and Facebook site (https://www.facebook.com/pages/National-Seismological-Center-Department-of-Mines-and-Geology-Nepal/334399900030441). People are invited to submit their experience of an earthquake – how intense the shaking felt, what kind of things fell over, how long the shaking went on for, and so on.
Obviously personal accounts are subjective and nowhere near as accurate as an accelerometer, but providing there are enough accounts the exaggerated answers are smoothed out. “We can gain some information on how the ground responds and estimate which local areas are most at risk,” Adhikari told me.
Given that Nepal experiences around five earthquakes of magnitude 4 or greater every month, there are plenty of opportunities for people to submit their experiences. And the explosive rise in mobile phone uptake and interest in social media in Nepal over the last five years or so suddenly make this a viable and very powerful method of gathering data. Now all Adhikari needs to do is spread the word…
Kate Ravilious (http://www.kateravilious.net) is a science journalist who is following the work of EwF. She is visiting Nepal thanks to the generosity of a travel grant awarded by the European Geosciences Union (http://www.egu.eu).
A review of the conference on “Earthquakes: from Mechanics to Mitigation”, organised by EwF and the British Geophysical Association (BGA), hosted by the Royal Astronomical Society and the Geological Society of London as part of their New Advances in Geophysics (NAG) conference series. The conference list of speakers can be found here.
Tim Middleton
Why do we study earthquakes? Is the aim to minimise economic losses? Do we want to save people’s lives? Or are we just interested in how the Earth works?
The recent conference on Earthquakes: from Mechanics to Mitigation at the Geological Society in London brought these questions into sharp focus. Over the course of two days geophysicists, geologists, engineers and social scientists met to hear about the range of ways in which people go about studying earthquakes. Are we trying to pin down the value of the static coefficient of friction on earthquake faults? Do we want to find out the history of earthquakes in remote parts of Central Asia? Are we concerned with the number of parameters in ground motion prediction equations? Are we trying to ensure that buildings we engineer won’t fall down and we won’t be sued? Or do we simply want to know how many people might die? Each of these is a valid question to be asking and each was addressed over the course of the conference. But motivation is a vital, and often much neglected, component of the research process and until we’re clear about our motivations we can’t be clear about how well we’re doing.
One recurring theme was a concern with the use of earthquake hazard maps. What do we want hazard maps for? And how do we assess whether or not they’re any good? Until such questions are answered, it is unclear how, or indeed why, they should be made; our motivations ought to be questioned. Eric Calais gave the disconcerting example of the misleading information that was available prior to the 2010 Haiti earthquake, both on the official hazard map and on the UN website. Might no map at all have been preferable to one that was wrong? An incorrect map can lead to complacency, yet, on the other hand, perhaps it is necessary to get a conversation started. Furthermore, having a map gives decision makers at least something to point to, even though they know it is wrong. But is this a legitimate safety blanket?
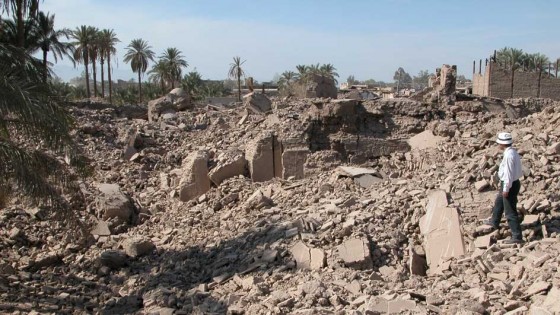
Figure 1: Destruction of adobe buildings in Bam following the 2003 earthquake. More than 25,000 people died and 85 to 90 percent of the buildings in Bam were either damaged or destroyed.
However, if loss of life is our primary concern, then might we be going about things in entirely the wrong way? As Seth Stein pointed out, on average more people in the US die each year from skateboarding accidents than they do in earthquakes. On this basis, we should be investing more in skateboarding safety than in earthquake research. So why don’t we? Perhaps it is because there is something more shocking and disruptive about earthquakes. In an earthquake, an entire society can become overwhelmed in a matter of minutes and this is emotionally and practically more difficult to deal with than a steady trickle of skateboarding accidents.
It is possible, therefore, to make a case for continuing investment in earthquake research, but the question we then need to ask is: what sort of research is needed? Corruption, poor decision-making, badly constructed buildings and sheer ignorance amplify any underlying seismicity to such an extent that these are the real causes of the tragic loss of life. Emily So suggested that if we’re interested in minimising earthquake fatalities, we should treat earthquakes as a public health issue. We should follow the lead of evidence-based medicine and try to pin down how and why people die in earthquakes and then work out how to do something about it.
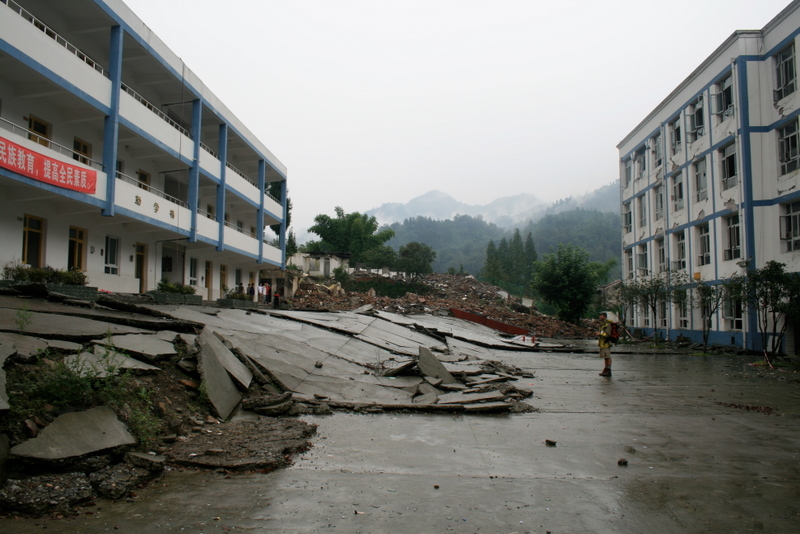
Figure 2: Fault scarp that formed in the courtyard of Bailu Middle School during the 2008 Wenchuan earthquake. The school buildings were less than one year old at the time of the earthquake and did not collapse. It is possible to save people’s lives.
There are success stories in this regard. Ruben Boroschek explained how rigorously enforced building codes in Chile limited the death toll in the recent 2010 earthquake. Engineers know what needs doing to stop buildings collapsing, but Chile unfortunately remains an isolated example. Chile experiences a magnitude 8 earthquake roughly every 15 years and over 200 perceptible events every single year; the population simply isn’t allowed to forget about the ongoing threat of destruction. Furthermore, engineers can be sued if their building falls down. Other countries with poorer building codes, meagre financial resources, and longer earthquake recurrence intervals, will find it harder to replicate Chile’s success.
None of this is to say that the science isn’t necessary; some exciting developments are occurring here too. For example, Giulio di Toro presented results of recent high pressure rock friction experiments and Richard Walters gave as a glimpse of future plans to process radar data in near real time to build up global maps of where strain is accumulating. We just shouldn’t kid ourselves that science alone will solve all our problems. It was a fascinating conference, but also a reminder of the importance of working across disciplines and being clear about what we’re aiming to do.
Jonathan Rigg, National University of Singapore & Katie Oven, Durham University
We are now 18 months into our five-year Earthquake without Frontiers research programme which involves a dazzling number of researchers from the natural and social sciences, and around 20 institutions spread across four case study countries.
The field research is being undertaken in Nepal, India (Bihar State), Kazakhstan and China (Sichuan and the Ordos Plateau). Already, on the social science side of the project, a common problem – how to build resilience in the context of earthquakes – is taking a very different form.
As Katie and Sam reported back in October, the national level governance structures in Nepal are generally weak following a decade-long civil conflict and an ongoing political impasse. Despite this, there are a wealth of bilateral, multilateral and NGO agencies and institutions driving forward the earthquake risk reduction agenda. With so many actors involved, coordination challenges arise, but achievements are being made including the retrofitting of hospitals and schools, urban search and rescue training, the training of local masons in earthquake safe construction, and the rolling-out of community-based disaster risk reduction programmes.
Just across the border in Bihar State, Katie and Sam reported on a very different governance context. Like Nepal, Bihar has a long history of weak governance and under-development; however Bihar has undergone a transformation in recent years. The Chief Minister has made disaster risk reduction a priority and there are now strong state institutions in place including a State Disaster Management Department and Authority, with funding from the State Government. Here, emphasis has been placed on awareness-raising amongst government stakeholders and the wider public to create a demand for earthquake safety, in particular, earthquake safe construction.
In China, the structures of national and regional government are generally well functioning and effective, impressively so. But this, we sense, may create the problem of a local-level gap at times of crisis, when formal structures are interrupted but there are no informal alternatives at the community level. In Kazakhstan our research is only at an early stage, but here the issue of post-socialist transition will loom large, we expect. While there are some visible signs of a ‘seismic culture’ – for example in the ‘earthquake-proof’ wooden cathedral, reputedly built without a single nail – our initial discussions do not lend us to think that this culture has survived through the turbulence of the Soviet and independence years.
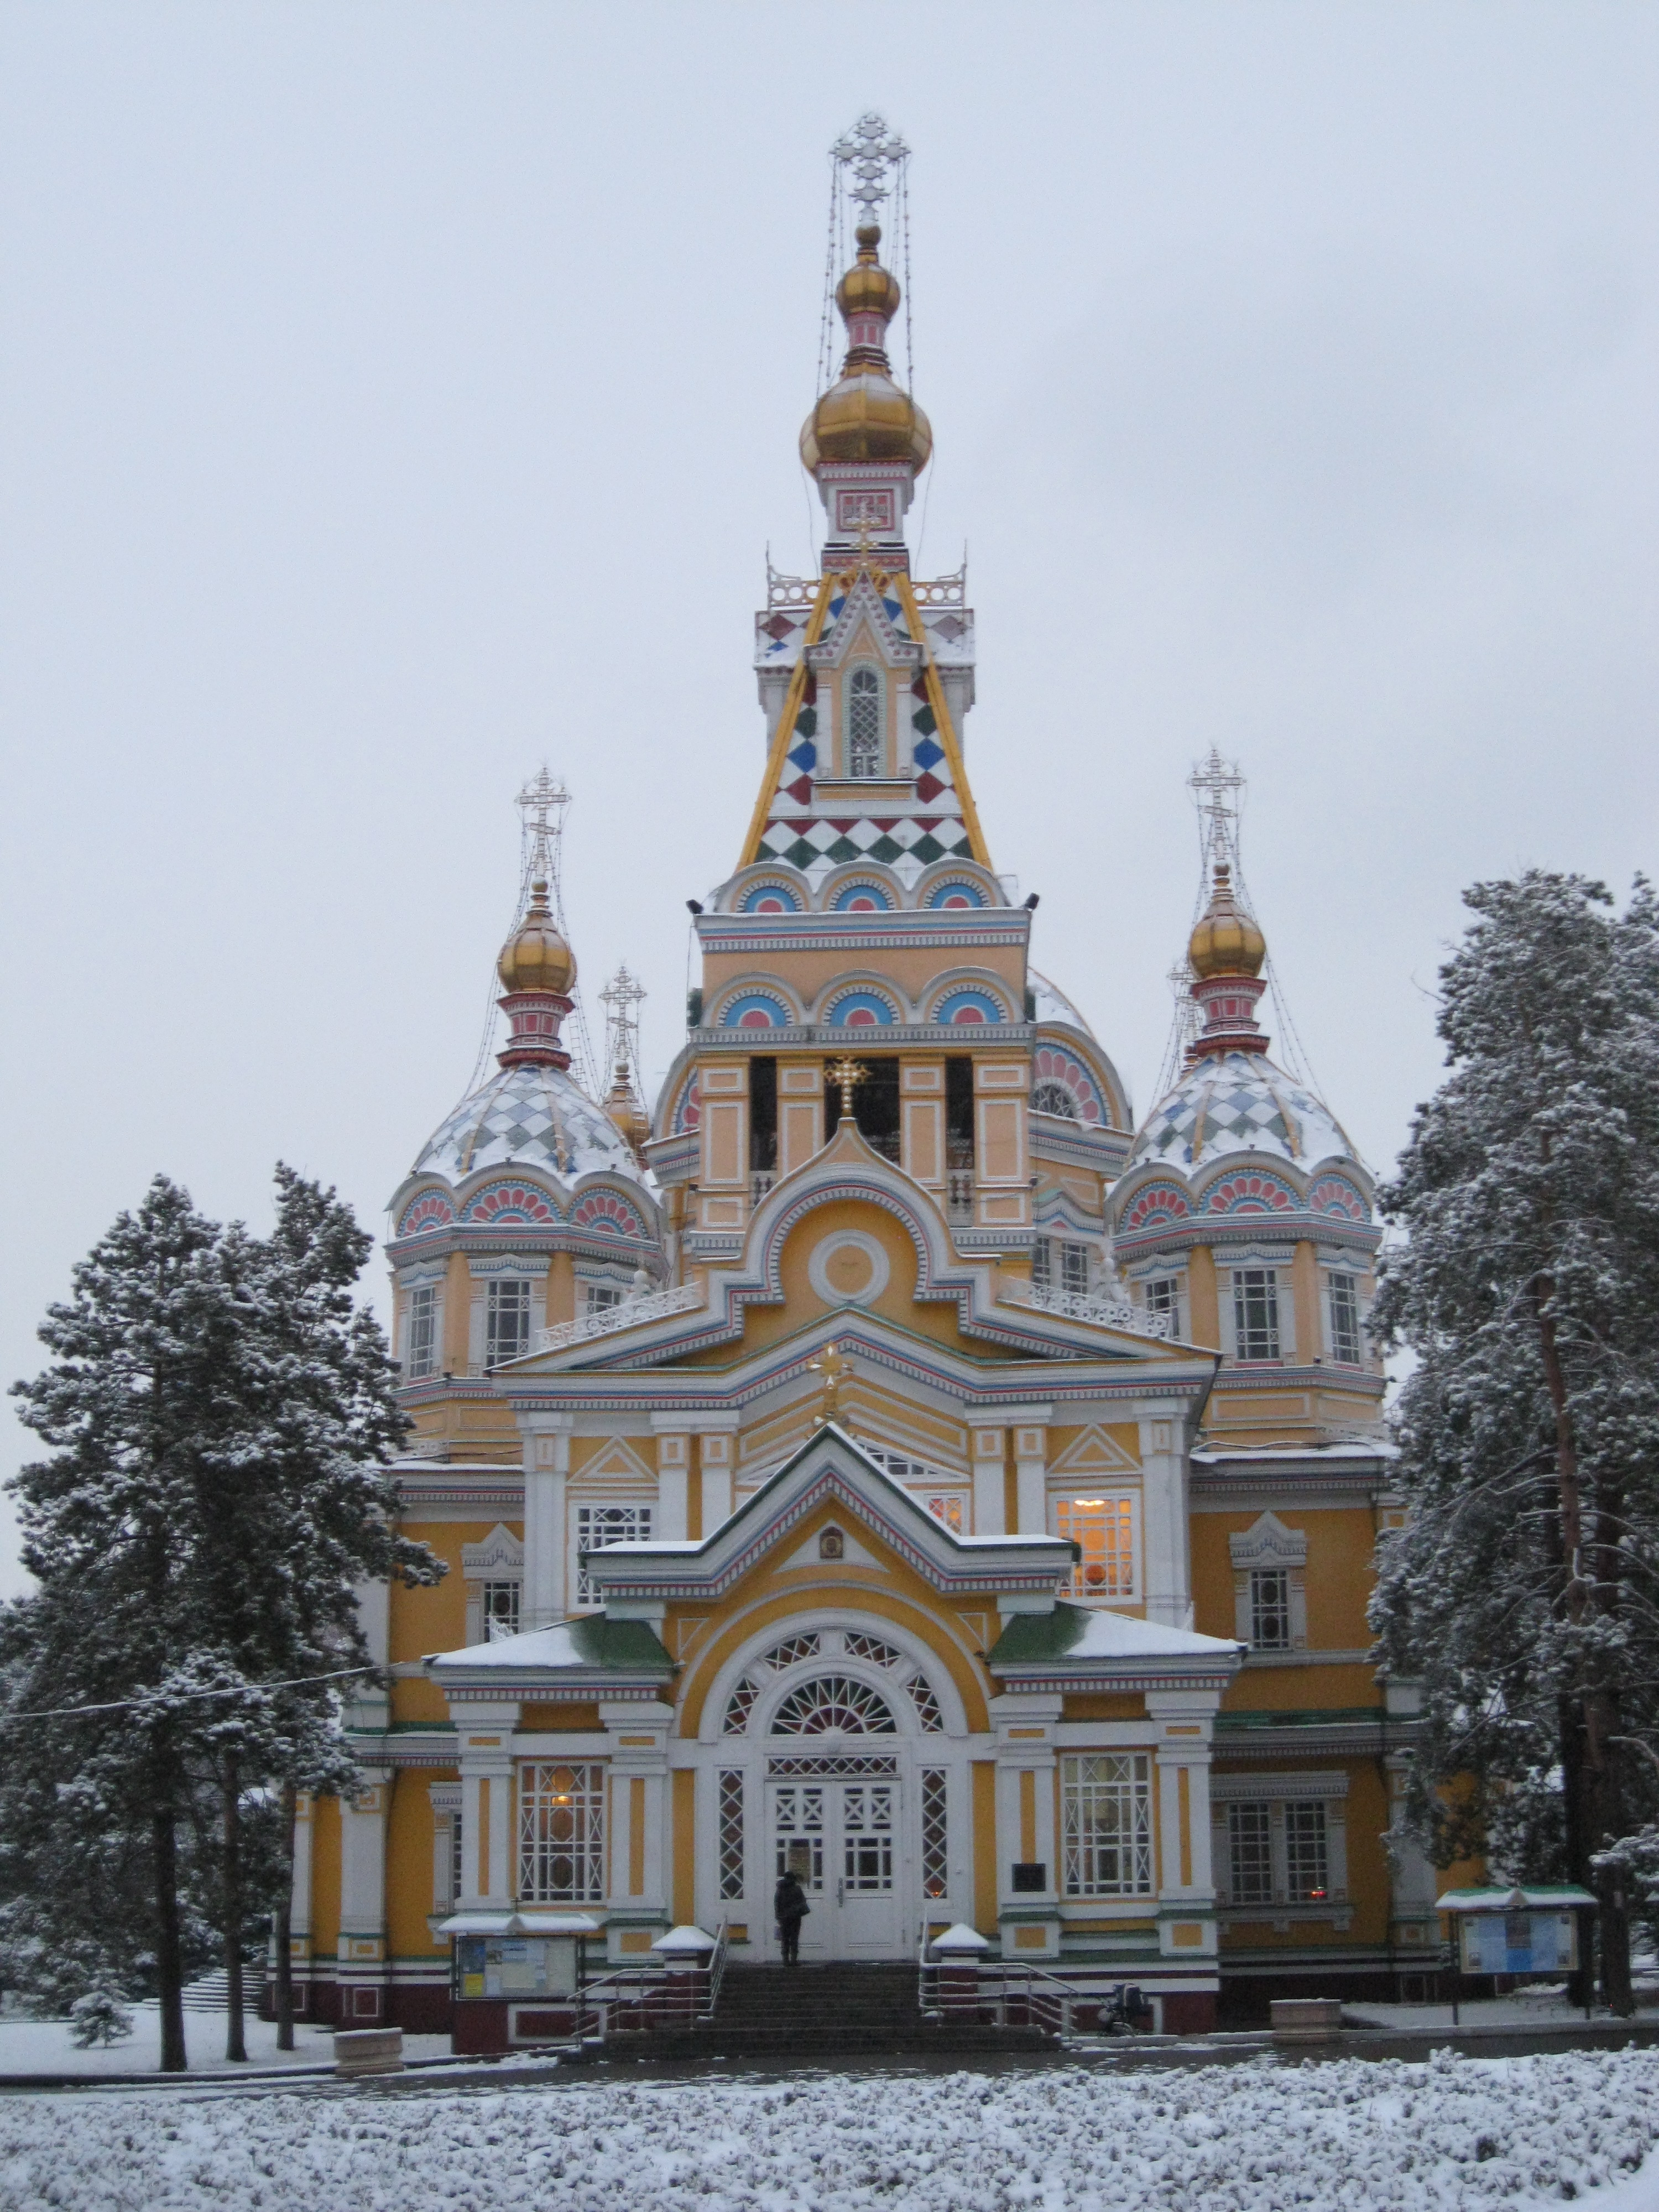
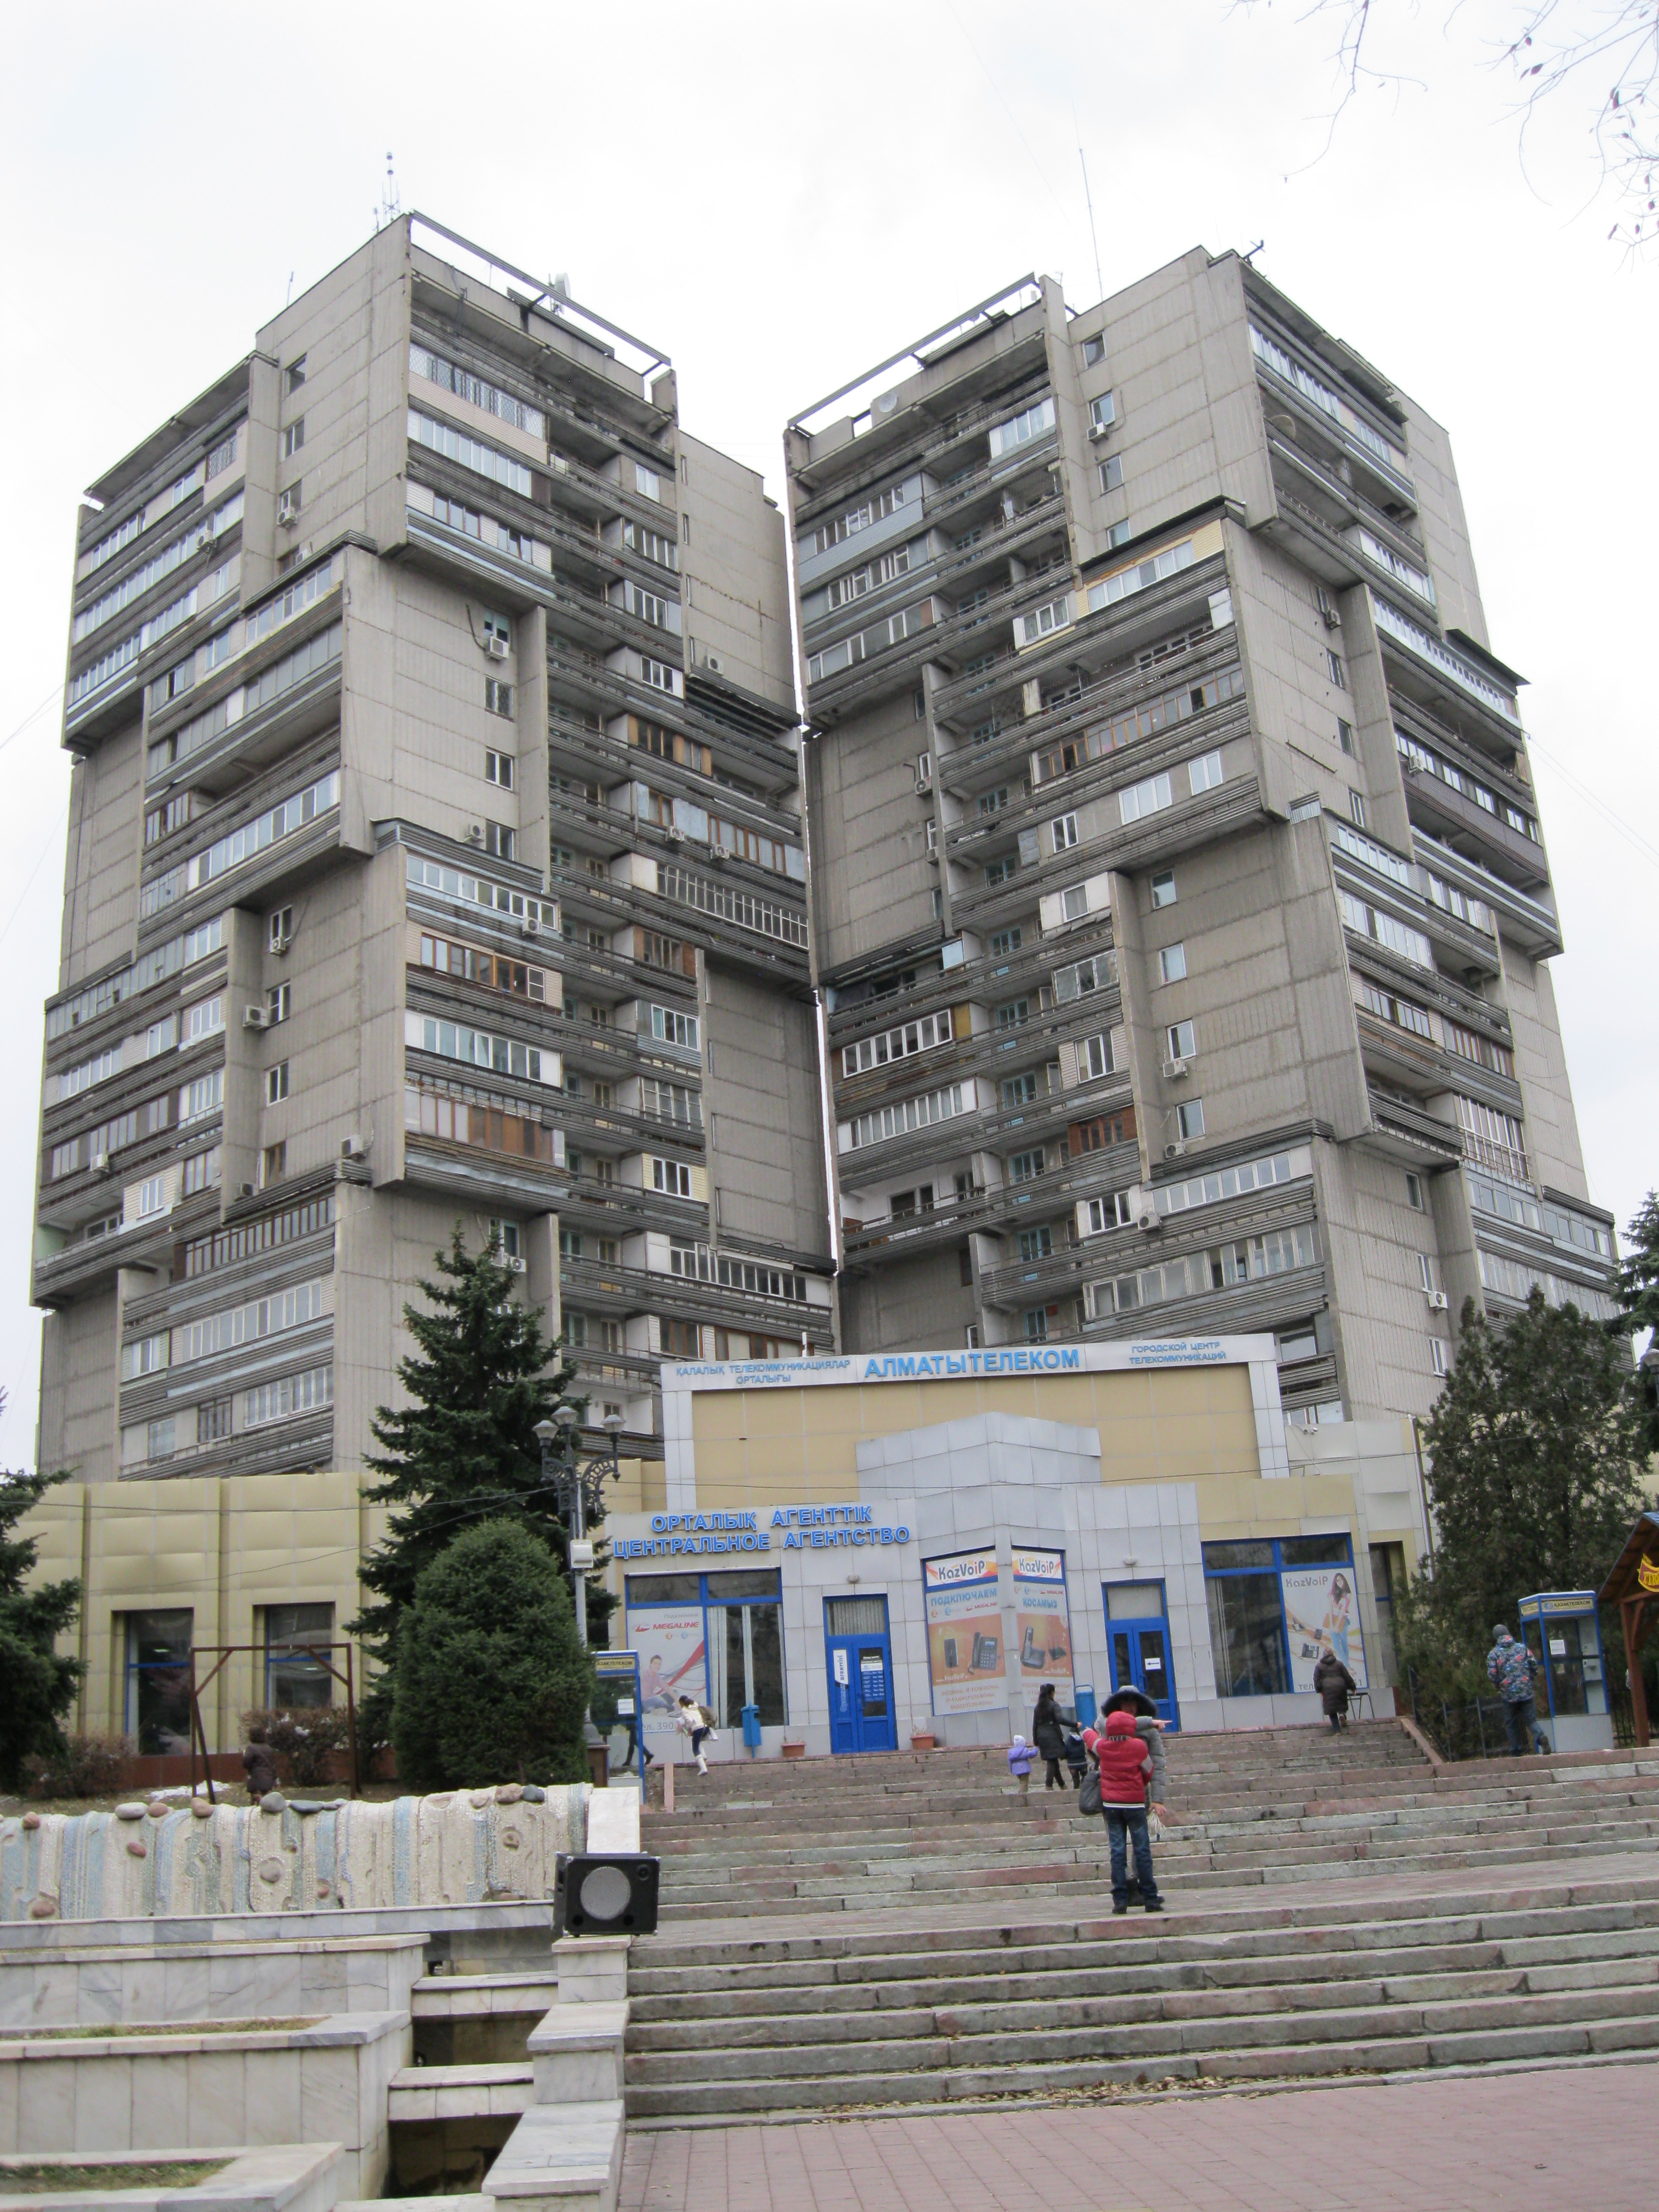
Left: Evidence of seismic culture – the wooden cathedral constructed in 1907. Right: Residential buildings from the Soviet era
A key question, of course, is whether this is a case of ‘horses for courses’, where we should both expect and celebrate difference: that the desired end of resilience can be secured in very different ways and that these need to be sensitive to national histories, cultural contexts, development capacities, and political realities. Or, alternatively, are these different approaches compromising the ends? Perhaps unsurprising, it is likely that the ‘reality’ lies somewhere between these two positions, but this raises the question of what cross-country learning can be achieved. The recently launched Sharing and Learning on Community Based Disaster Management in Asia Project, a collaboration between the UK-DFID, the Chinese Government, developing countries in Asia and the UNDP, is an interesting example of cross-border cooperation and engagement for disaster risk reduction. With Nepal identified as one of the project’s initial partner countries what, exactly, are the lessons for Nepal from China in terms of the country’s top-down approach to disaster management; and for China, in terms of Nepal’s vigorous NGO and community-engagement with earthquake hazard?
By John Elliott (University of Oxford)
Recently published work shows that there is significant remaining seismic hazard at the city of Van resulting from the relatively deep rupture of the previous earthquake from 2011.
In October 2011 a magnitude 7.1 earthquake struck the cities of Van & Ecriş in Eastern Turkey killing over 600 people. Using satellite radar measurements, we were able to precisely map the fault segments that ruptured in this event.. These observations were critical in showing that the slip in the earthquake remained buried between 8 and 20 km underground. However, this leaves a large shallow portion of the fault nearer the surface that has not broken, and field observations show that this fault is capable of rupturing in earthquakes, posing a continuing hazard to this city of a million people.
Earthquakes continue to surprise in their location and size, such as the 2010-2011 Christchurch earthquakes in New Zealand, which occurred on unknown faults. The Van earthquake also occurred on previously unmapped faults, highlighting the need to undertake basic mapping of active fault structures, as well as measure regions building up strain that might rupture in the future.
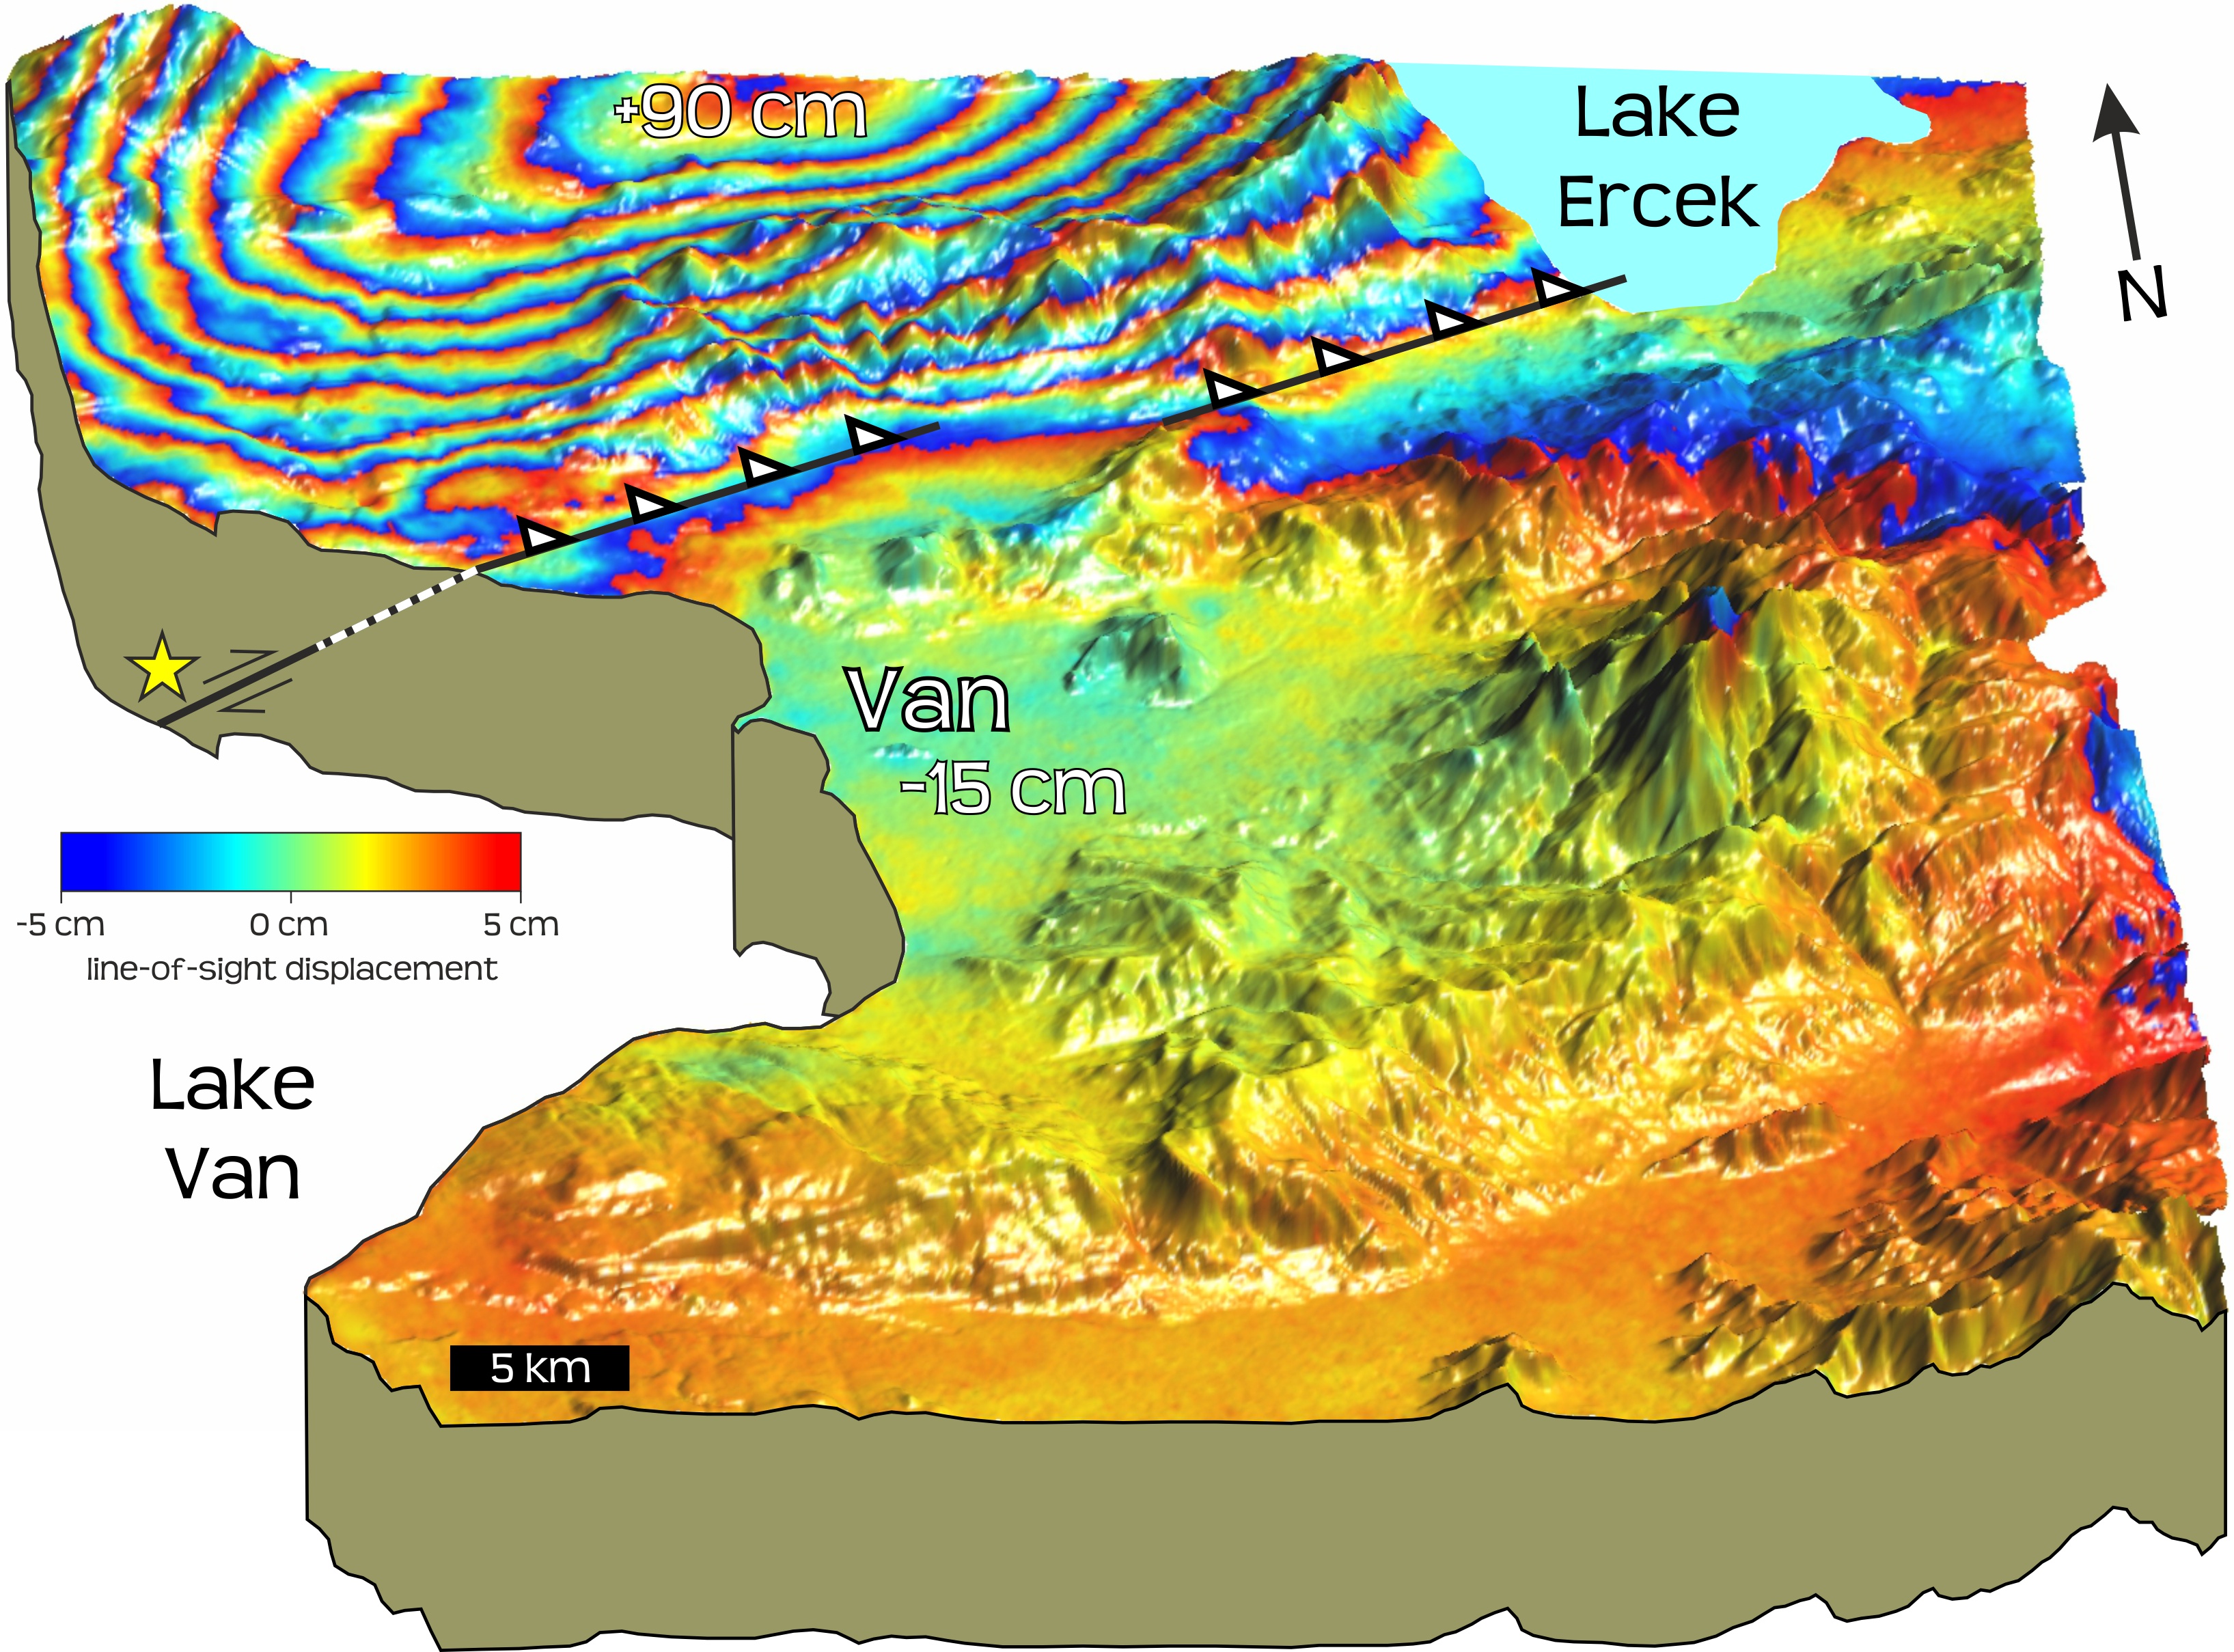
Figure 1: Perspective view of the ground deformation due to the October 2011 magnitude 7.1 earthquake which struck the city of Van in Eastern Turkey. The rainbow colours show 10 cm contours of ground motion (up to 90 cm uplift in the mountains north of Van and 15 cm of subsidence under the city itself). This deformation is measured using the Italian X-band radar satellite COSMO-SkyMed. With this high resolution data, the precise location of the faults (black lines and white triangles) on which the earthquake occurred (yellow star at 15 km depth) can be found. This highlights which portions of the fault ruptured in the quake, and more importantly for examining future seismic hazard, which portions did not break – in this case the shallow sections of the fault (dashed line), nearer the city of Van.
The InSAR data presented here (Figure 1) permit us to determine an accurate location and the depth extent of faulting for the 23 October Mw 7.1 earthquake as 8–20 km, along a pair of fault planes, each 14 km in length. This relatively deep earthquake leaves an unruptured upper portion of the fault in the shallow crust, which is now under greater stress from this deeper slip.
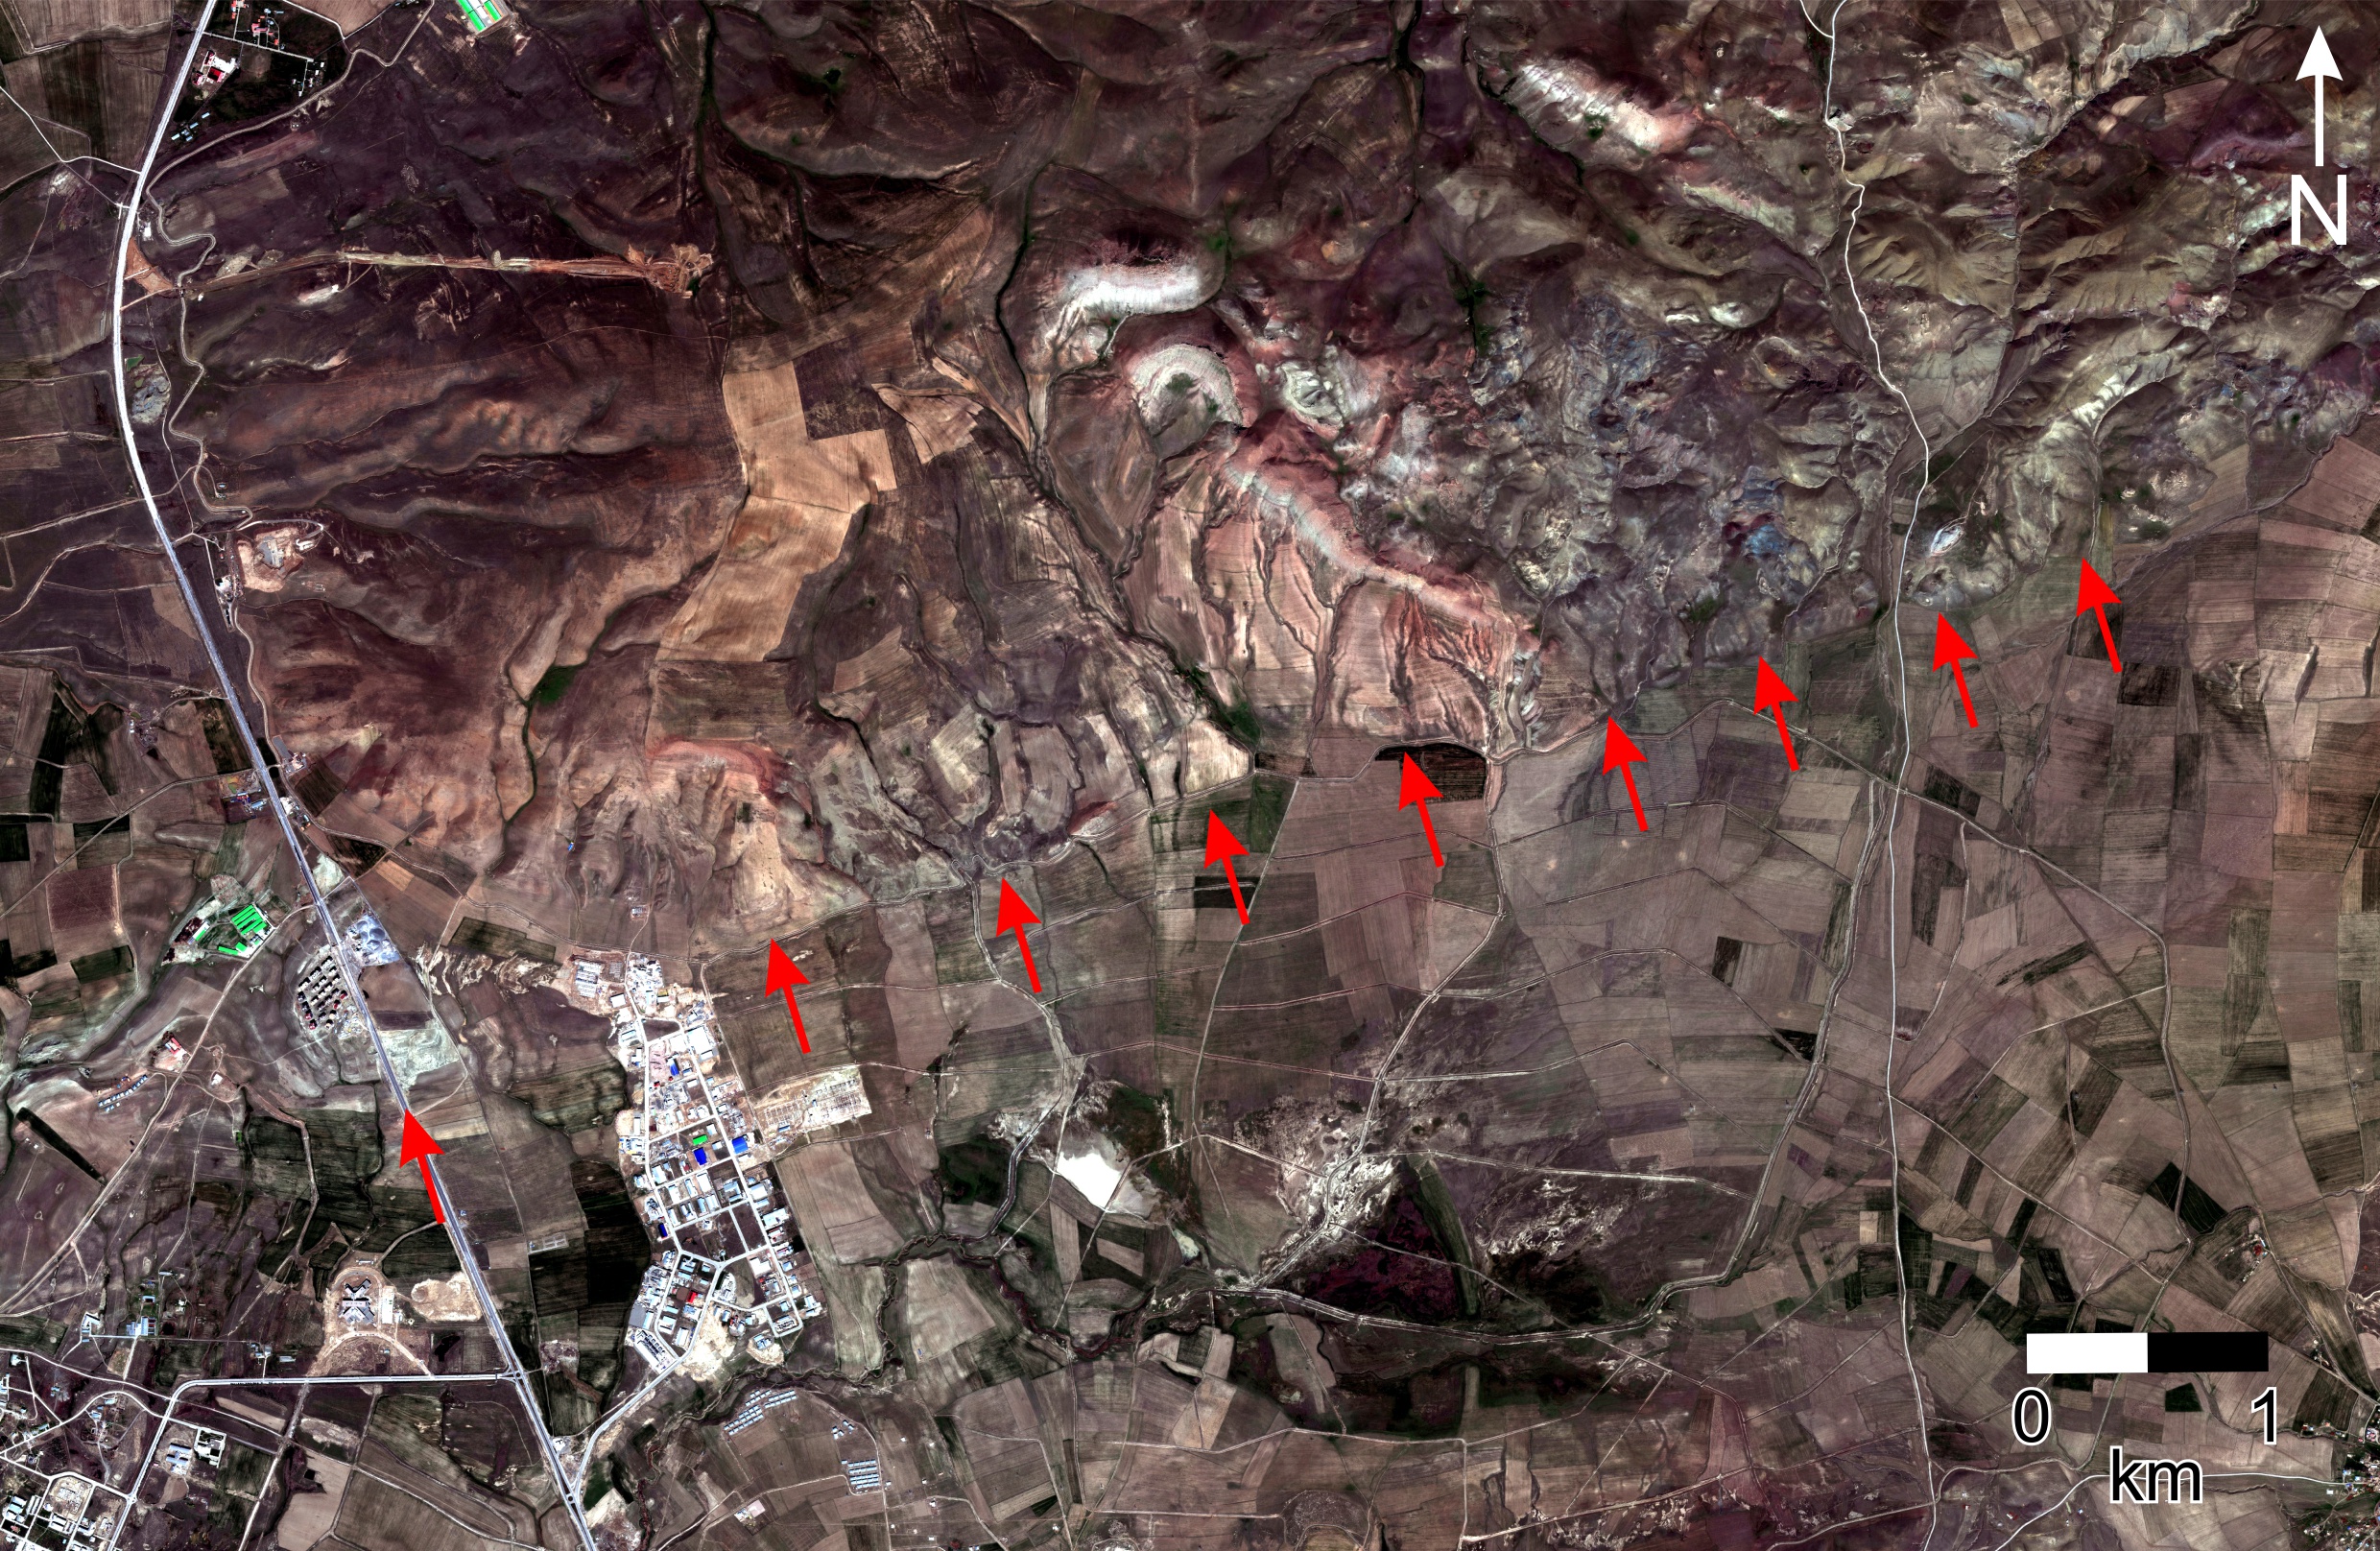
Figure 2: World-View 2 satellite imagery of the western fault segment, 10 km north of Van. The fault trace runs almost east-west (red arrows – the western most arrow is the location of figure 3). The surface geomorphology of the fault scarp is relatively clear in retrospect as there is a change in river incision moving from the south (flat agricultural fields) to the north across the fault (deeper stream and river valleys). This change in river cutting is due to the uplift of the hillside north of the fault from past earthquakes which push up the mountains. In the 2011 earthquake, the mountains to the north grew higher by almost 1 m.
The projection of these fault segments to the surface is just 10 km north of Van (Figure 2). For such a large earthquake, very little of the slip occurred at the surface (Figure 3a) – the maximum slip of 9 m occurred at 14 km depth. However, given that the surface trace of the fault is clearly visible in the geomorphology of the mountain range to the north of Van and that fault gouge was found in Quaternary sediments at the surface (Figure 3b), it is very likely that the upper portion of the crust is seismogenic, and could still break in the near future.

Figure 3: (a) The slip motion on this fault at the surface is very small for such a large earthquake. The previously straight kerbstone moved a few centimetres to the left and down on the south side by less than 10 cm (red arrows). The small movements of the fault at the surface indicate most of the slip in the earthquake remained deeply buried. Photo Credit: John Elliott, June 2013. (b) Image of the sediments in the road cutting where the fault crosses the road shown in (a). This shows a line (marked by red arrows) cutting though these soft sediments that has been created by past motion on this fault. This fault gouge dips to the north by about 50 degrees, matching the dip of the depper fault which slipped in the 2011 earthquake and that was found from modelling the InSAR deformation data shown in figure 1. Photo Credit: Kate Scharer, November 2011.
A hiatus of months to years in rupture between two similarly sized earthquakes is not unprecedented, as found for a pair of equal sized earthquakes in China which occurred on the same fault – the first deeper in 2008, and the second much shallower ten months later in 2009.
Katie Oven and Samantha Jones
Over the past six months Sam and Katie have been engaging in research to examine how earthquake risk reduction (EQRR) is governed in Nepal and the Indian State of Bihar. A series of interviews and focus group discussions have been undertaken with a range of stakeholder groups, including international organisations, government bodies, and national and international NGOs, with a view to understanding the policy and legislative context and the role of different stakeholders in EQRR. This stage of the research has focused on state level policy and planning and below we offer some preliminary reflections. The next phase will explore how national level policy plays out at the local (district/village) level; and how earthquake science is currently informing policy and practice.
EQRR in Nepal
The EQRR landscape in Nepal is complex, reflecting a post-conflict state with a weakly functioning government. This is undoubtedly a challenging environment in which to build an earthquake resilient society. Indeed, the Disaster Management Act, which was first drafted in 2007, still has not been ratified. Fortunately a UN Development Programme-funded initiative to develop a national strategy is serving as a common foundation to guide stakeholder interventions. With relatively high levels of funding being channelled through multi-lateral and bi-lateral donors, a considerable amount is being achieved in terms of EQRR. This includes retrofitting hospitals and schools, the identification of open spaces in Kathmandu for use in disaster situations, community-based risk reduction and institutional strengthening. The number of stakeholders involved creates significant coordination challenges. These are being effectively addressed by the Nepal Risk Reduction Consortium (NRRC).
But is this a sustainable scenario? There are aspects of EQRR that require strong centralised governance, for example establishing and overseeing national emergency operating centres and maintaining critical lifeline services. This role does not necessarily need to be played by the state but it does require a long term vision, resources and authority. Currently the NRRC is taking a strong lead in this area but what next for Nepal? Findings suggest that the Government of Nepal needs to accord higher priority to developing institutional structures such as a national disaster management authority so they can own the process and lead future resilience building in Nepal.
EQRR in Bihar
In the Indian State of Bihar, by comparison, EQRR is in its infancy. For a long time, the focus of the Government of Bihar (GoB) has largely been disaster relief, a reflection of the State’s susceptibility to flooding and the catastrophic 2008 Kosi flood disaster. However, the current Chief Minister is making disaster risk reduction (DRR) a key priority. This began in 2007 with the establishment of the Bihar State Disaster Management Authority (BSDMA) to manage DRR activities across the state. While the BSDMA was relatively inactive until the current Vice-Chairman was appointed in 2010, rapid progress is now being made. New legislation is being drafted and ratified, while older legislation is updated. Examples include the State Disaster Management Plan along with standard operating procedures, the Bihar Urban Planning and Development Act and building by-laws, with guidance provided by the National Disaster Management Authority. But, while there are plans for a national and district level emergency operations centres and for all new buildings (public and private) to adhere to earthquake safe standards, there are currently no formalised plans to retrofit existing building stock – even priority life line infrastructures including hospitals.
Despite Bihar receiving very little donor funding for DRR, funding is not considered to be a major constraint on EQRR implementation with funding provided by the State Government. However, a lack of awareness amongst government stakeholders and the wider public, along with limited capacity and expertise particularly in technical sectors such as civil engineering and architecture, are cited as key constraints. Efforts are being made to address this gap through training programmes which are being rolled out at the state, district and panchayat levels. These include state-wide training programmes for engineers, architects, contractors and masons.
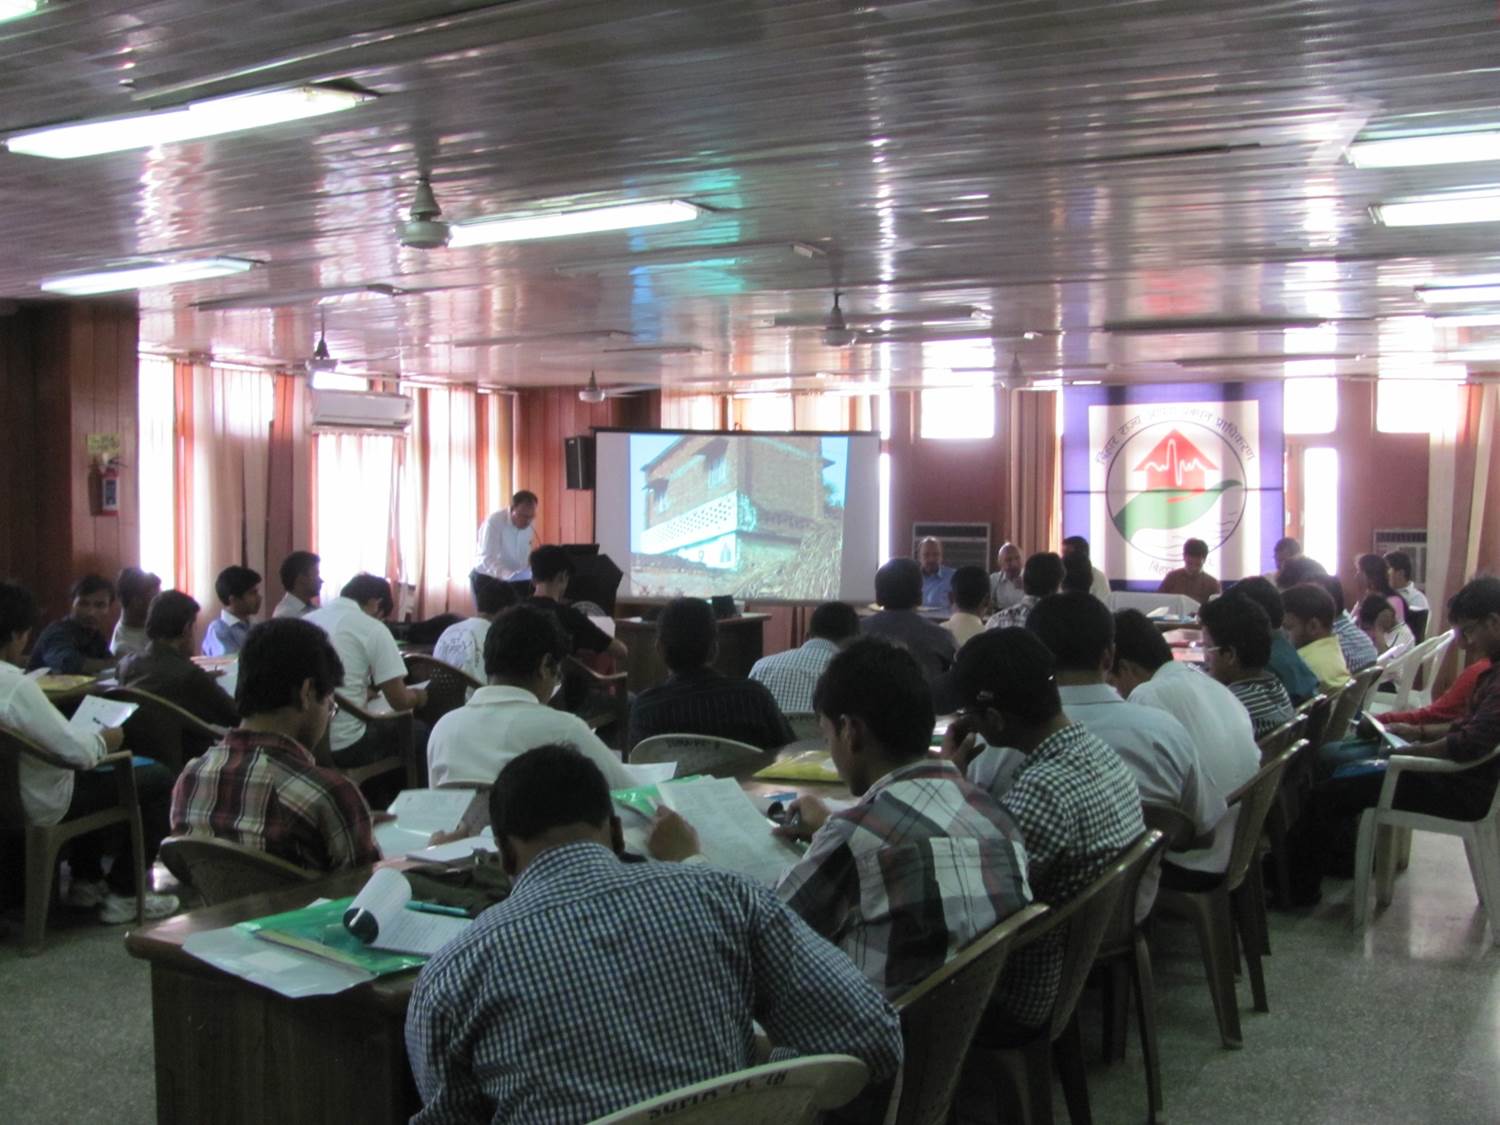
Lectures on earthquake engineering for engineering students organised by the BSDMA (source: BSDMA)
While there is a lot of political will in Bihar at the highest level of government, the GoB does not seem to be planning for a major earthquake tomorrow, whereas in Nepal, certainly among donors, there is a recognition that a devastating earthquake could happen at any time and the country needs to be ready. The earthquake felt in Kathmandu a few weeks ago will hopefully provide continued impetus for on-going preparedness efforts in the region.
By Yu Zhou (University of Oxford)
This April, part of the EwF group (Professor Philip England, Professor Barry Parsons and Dr. Richard Walker from the University of Oxford; Professor Lena Dominelli and Dr. Katie Oven from Durham University; John Young from the Overseas Development Institute; and Timothy Sim from the Hong Kong Polytechnic University) organised meetings in Xi’an (Northwest University) and Beijing (Peking University) to discuss both geological and social issues with a wide range of Chinese bureaus and researchers. The two meetings brought together more than 60 people including representatives from government ministries and departments, international organisations and universities. The representatives have offered valuable suggestions on what the EwF project could do to cooperate with on-going work around earthquake risk reduction in China.

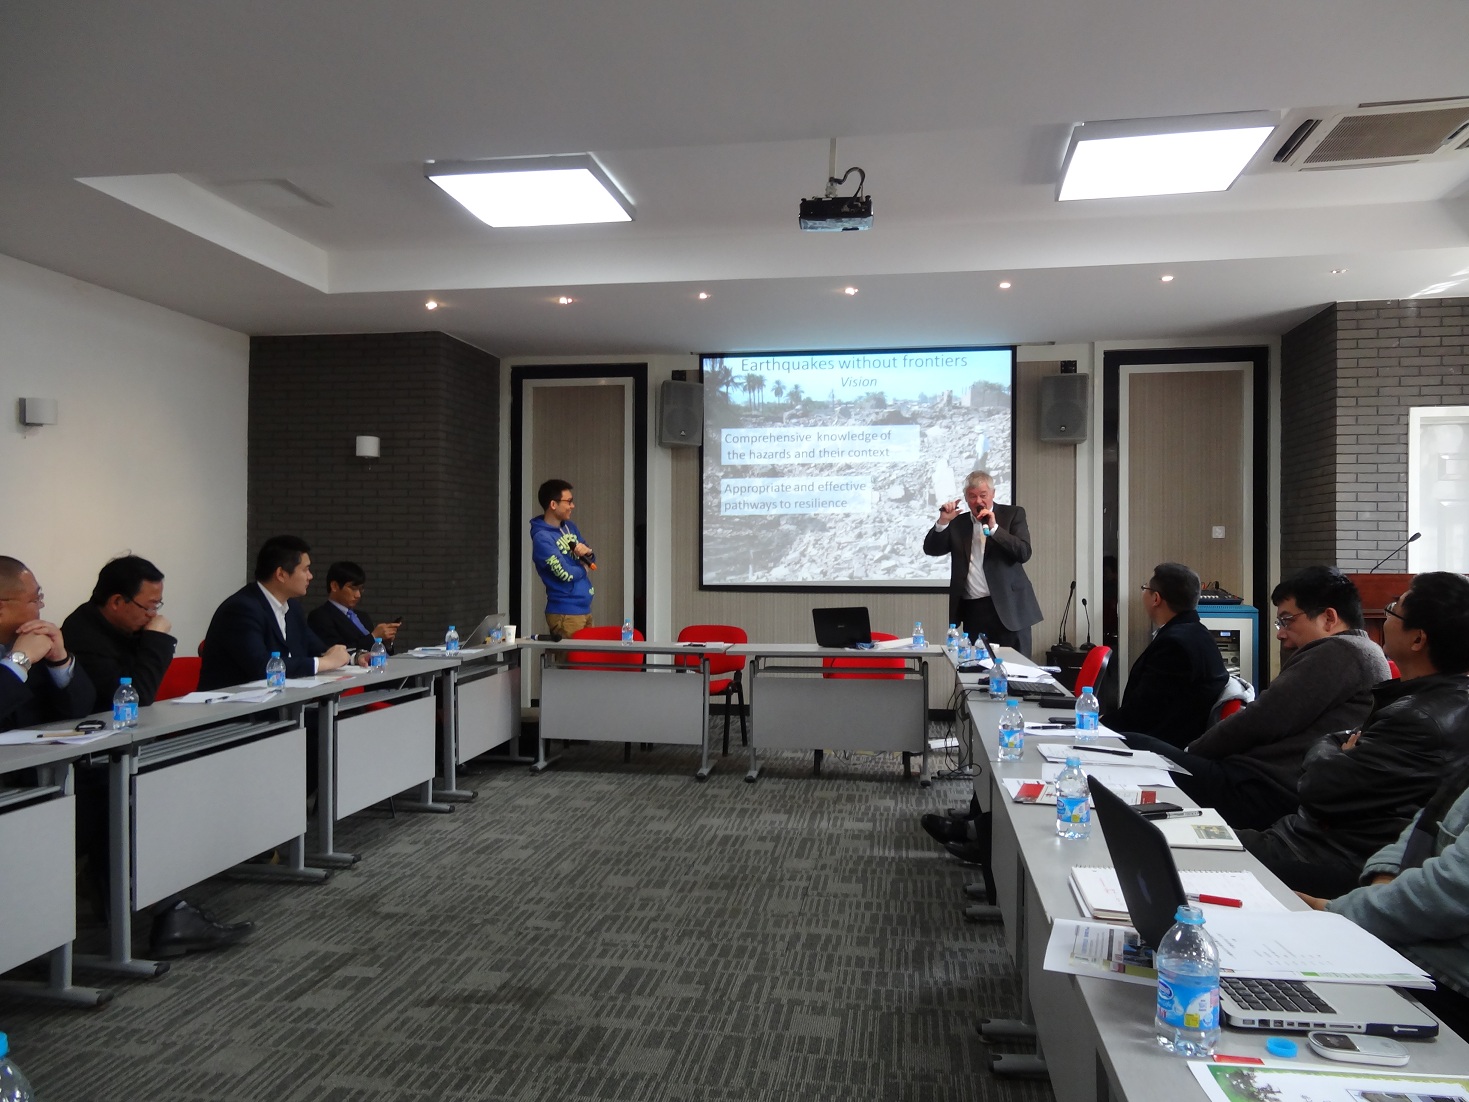 Figure 1. EwF launch meetings in Xi’an (top) and Beijing (bottom).
Following the EwF meetings, a smaller group of researchers (Dr. Richard Walker and Dr. Magali Rizza from the University of Cambridge; Ji Ma, a PhD student from the Institute of Geology at the China Earthquake Administration; and myself) spent five days doing reconnaissance fieldwork in Shaanxi Province, where the M8 1556 Huaxian earthquake occurred. This devastating earthquake was responsible for the greatest known death toll of over 800,000, and has aroused intense research interest as nothing is known of the earthquake recurrence intervals in this highly populated part of China. During this fieldtrip, we aimed to follow the surface rupture of the 1556 Huaxian earthquake, much of which has been mapped by Chinese geologists, and to determine the slip rates and past occurrence of earthquakes on the east Qinling fault, which runs along the southern boundary of the Ordos Desert. However, the dramatic modification of the landscape by human activities (e.g., construction and farming) in the past 400 years added challenges to the fieldwork.
 Figure 2. Populations in the Ordos Desert. The Ordos Desert is a rigid block with the Weihe Graben bounding its southern side. Xi’an, with a population of 6.5 million, is the most densely populated city in this region.
Guided by Professor Xijie Feng from the Earthquake Administration of Shaanxi Province, we visited a number of sites along the 1556 rupture. We were surprised by the continuous and consistent ~8 m scarp over the entire fault length. If the entire 8 m scarp is confirmed to be formed during the 1556 earthquake, the geological story of the Weihe Graben will bring new insights to active faulting. To unravel the geological truth, we collected samples for dating from river gravels that were uplifted in the scarp, and from ancient soil and loess layers that overlie gravels in the footwalls of the faults. We also found evidence for higher scarps, which may represent some pre-historic events. If the main scarp was indeed formed in the 1556 event, then samples from the same layer should give the same age, and the age of the samples from different layers may indicate the earthquake recurrence intervals. We hope to be able to calculate a minimum late Quaternary slip rate using the date of the samples and the displacements measured on high-precision and high-resolution digital elevation models (DEMs) from field surveys, photogrammetry and computer vision techniques.
 Figure 3. Field sites in the eastern part of the Weihe Graben. Base map is a 10 m resolution DEM which is constructed using 10 SPOT 5 images (2.5 m resolution), and point clouds from SRTM (90 m resolution) and ASTER GDEM (30 m resolution).
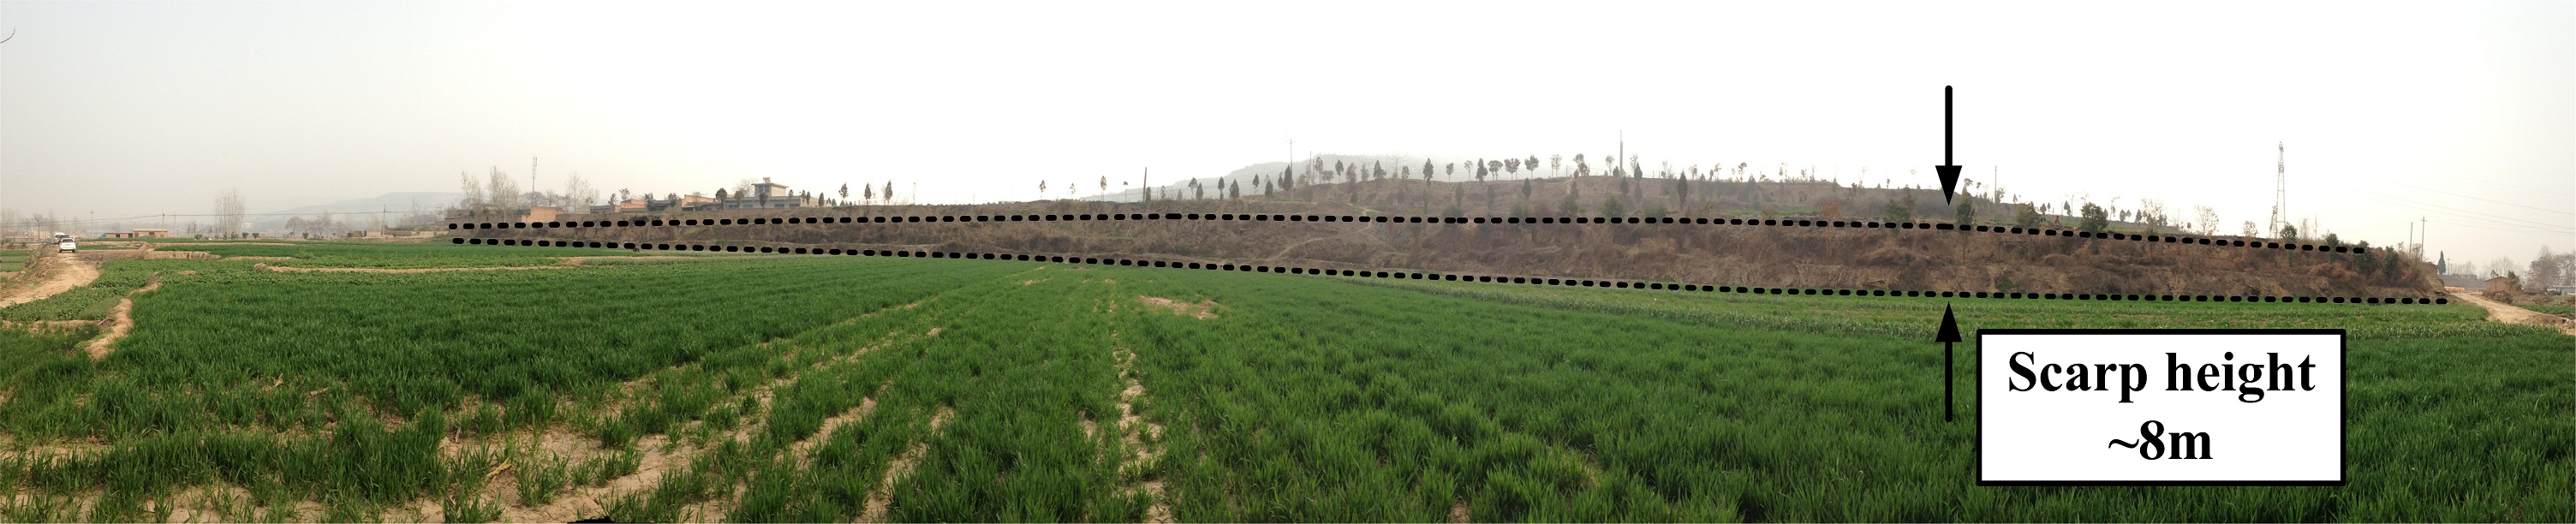
 Figure 4. During the investigation, we saw a continuous and consistent ~8 m scarp over the entire fault-length. To test whether the 8 m scarp was formed in the 1556 earthquake, we collected samples for dating from the loess layers (red circle in lower photo).
The M8 1556 Huaxian earthquake is the most recent destructive earthquake in the Weihe Graben. The highly populated cities in this region (e.g., Xi’an and Weinan) have a significant influence on Chinese history and culture. The cultural heritage in this part of China is amazing. During this trip, we were lucky to visit some famous historical sites including the Terra-Cotta Warriors of the first Emperor Qin Shi Huang. Should earthquakes happen in the future, they will have extremely severe effects. Hopefully we are able to learn more on future trips to reduce seismic risks.
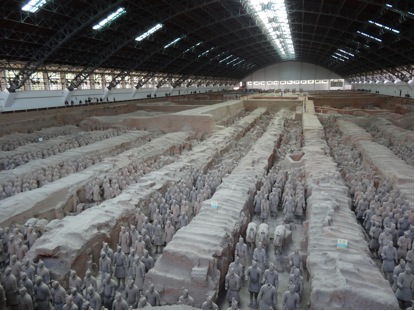
Figure 5. One pit of the Terra-Cotta Warriors in Lintong District (east of Xi’an) in Shaanxi Province. During this trip, we visited some of the historical sites around Xi’an. The Terra-Cotta Warriors were made in the late 3rd century BC to protect the first Emperor of China in his afterlife. The cultural heritage in this part of China is of great importance in Chinese history.
Many thanks to Professor Peizhen Zhang from the Institute of Geology at the China Earthquake Administration, and Professor Xijie Feng from the Earthquake Administration of Shaanxi Province. Thanks also to the Administration of Shaanxi Province for supporting our field trip in Shaanxi.
 ..
..
Professor Alex Densmore and I are currently recruiting a Post-Doctoral researcher to work with us on a project on earthquake-induced landslides. This post, which will start on 1st October 2013, is a two month position that is part of the consortium team on the ‘Earthquakes Without Frontiers’ project that is featured on this blog, funded by the NERC-ESRC Increasing Resilience to Natural Hazards Programme. As a reminder, the aim of the EWF project is to increase resilience to continental earthquakes across the Alpine-Himalayan mountain chain, through a linked trans-disciplinary partnership of physical scientists, social scientists, policy specialists, and regional and national partner organisations. This involves:
This new post will contribute primarily to aspect (i), and will focus in particular on delivering an enhanced understanding of coseismic landsliding, and of new web-based forecasting tools for end-users. This work will comprise two separate strands:
1. Development of a process-based approach to the forecasting of coseismic landslides that improves upon current empirical approaches; and
2. Construction of a novel tool for tracking the temporal evolution of landslide material.
The work will be focused on three primary field areas: Nepal and northern India; southern Kazakhstan; and central China. The post-holder will be based in the Department of Geography, Durham University, but will be expected to work closely with team members at the other institutions within the consortium (Cambridge, Oxford, Leeds, Hull, Northumbria, the British Geological Survey, and the Overseas Development Institute), as well as with wider members of the partnership.
Full details of the post are available on the Durham University jobs website: http://www.dur.ac.uk/jobs/ or please feel free to email me at: d.n.petley@durham.ac.uk
By Rob Parker (University of Cardiff) and Dave Petley
The Mw = 7.8 earthquake on Tuesday in Iran was the largest event in that country for about 50 years. Fortunately, the depth of the earthquake (82 km) and the low population density in the affected areas meant that loss of life was low for an event of this size. Indeed, reports suggest that only one person died in Iran, although there are reports of 40 deaths in Pakistan. This single fatality in Iran was the result of a landslide, and one of the images on the BBC reports about the earthquake also seems to show landslides:

Over the last three years or so, we have been working with our colleagues Alex Densmore and Nick Rosser, and funded by the Willis Research Network, to develop a model that will allow us to make an initial assessment of landslide impacts in earthquakes. Rob recently submitted his PhD, and has now moved to a post-doctoral position at Cardiff. However, we thought that this event would be an interesting first application of the model, which has been produced through a statistical (logistic regression) analysis of spatial patterns of landslides (with areas larger than 11,000 square metres) triggered by four large earthquakes in the USA, New Zealand, Taiwan and China. The model provides a first-order prediction of the probability of hillslope failure across the region affected by seismic shaking, based on the strength of ground motions and the gradient of hillslopes. Areas likely to have experienced high levels of landslide activity are shown in red, and while areas we expect to be less affected by landslides are shown in green and then blue. Here, landslide probability has been estimated using preliminary ground motion data published by the USGS and hillslope gradients derived from the ASTER global elevation model.
This is the outcome of the model:

We have a Google Earth kml of this that we can provide. Unfortunately we cannot embed this in the blog, and we don’t have access to our ftp site until Monday. Please email DNP at d.n.petley@durham.ac.uk if you want a copy of this.
Some notable features of the predicted landslide distribution are:
| Earthquake | Magnitude | Depth(km) | Percentage of failed hillslopes within 20 km of epicentre |
| 2008 Wenchuan earthquake (China) | 7.9 | 12.8 | 13.4 % (observed) |
| 2013 Khash earthquake (Iran) | 7.8 | 82 | 0.3 % (predicted) |
| 1999 Chi-Chi earthquake (Taiwan) | 7.6 | 8 | 1.1 % (observed) |
| 1994 Northridge earthquake (USA) | 6.7 | 18 | 0.5 % (observed) |
A notable feature of this earthquake is the relatively low number of reported deaths (41 in the two affected countries). The 2008 Wenchuan earthquake, which had a magnitude of 7.9 (i.e. it was similar to this event), caused around 80,000 fatalities, 20,000 of which were attributed to landslides. Similarly, the 2005 Kashmir earthquake in Northern Pakistan (magnitude 7.6) resulted in over 80,000 fatalities. Underestimates of damage and fatalities are common in the immediate aftermath of large earthquakes, particularly in remote areas, and the death toll may change over the coming days. However, the epicentral region has a relatively low population density compared with areas affected by the Wenchuan and Kashmir earthquakes:
 ..
..
Estimates from 2008 suggest a total population of around 4 million within the area covered by our landslide model above. The death toll is therefore unlikely to rise to the levels seen in Wenchuan and Kashmir, where population densities are much higher. It is this low population density, combined with the very large depth of the earthquake, that has meant that the loss of life is so low. A similar, but shallow, earthquake in a more densely populated area would have had very different outcomes.
It is of course vital to say that this is just a first order estimation, and we will need to examine the actual distribution as images become available.
Reference
Bright EA, Coleman PR, King AL, Rose AN, Urban ML. LandScan 2008. 2008 ed. Oak Ridge, TN: Oak Ridge National Laboratory; 2009.
Katie Oven and Susanne Sargeant
January 16th saw the launch of the EwF project in Kathmandu, Nepal. Hosted by the National Society for Earthquake Technology (NSET-Nepal), the event brought together more than 25 national-level stakeholders involved in earthquake risk reduction in Nepal including representatives from government ministries and departments; international organisations including the UNDP; donors including the World Bank and DfID; NGOs; and universities.
Following speeches from Mr Navin Kumar Ghimire (Secretary, Ministry of Home Affairs) and Mr Chakrapani Sharma (Under-Secretary, Ministry of Federal Affairs and Local Development), time was spent exploring the aims of the EwF project in Nepal, India and the wider partnership, beginning with a presentation from Alex Densmore. This was followed by our local partners (the Nepal Risk Reduction Consortium, NSET-Nepal, and the International Centre for Integrated Mountain Development) who outlined some of the physical and social science research needs of the stakeholder community and offered valuable suggestions as to how the EwF project could feed into on-going work around earthquake risk reduction in Nepal. A workshop in the afternoon provided an opportunity for a smaller group to work together to identify key national-level stakeholders engaged in this area and to explore relationships of power and influence. 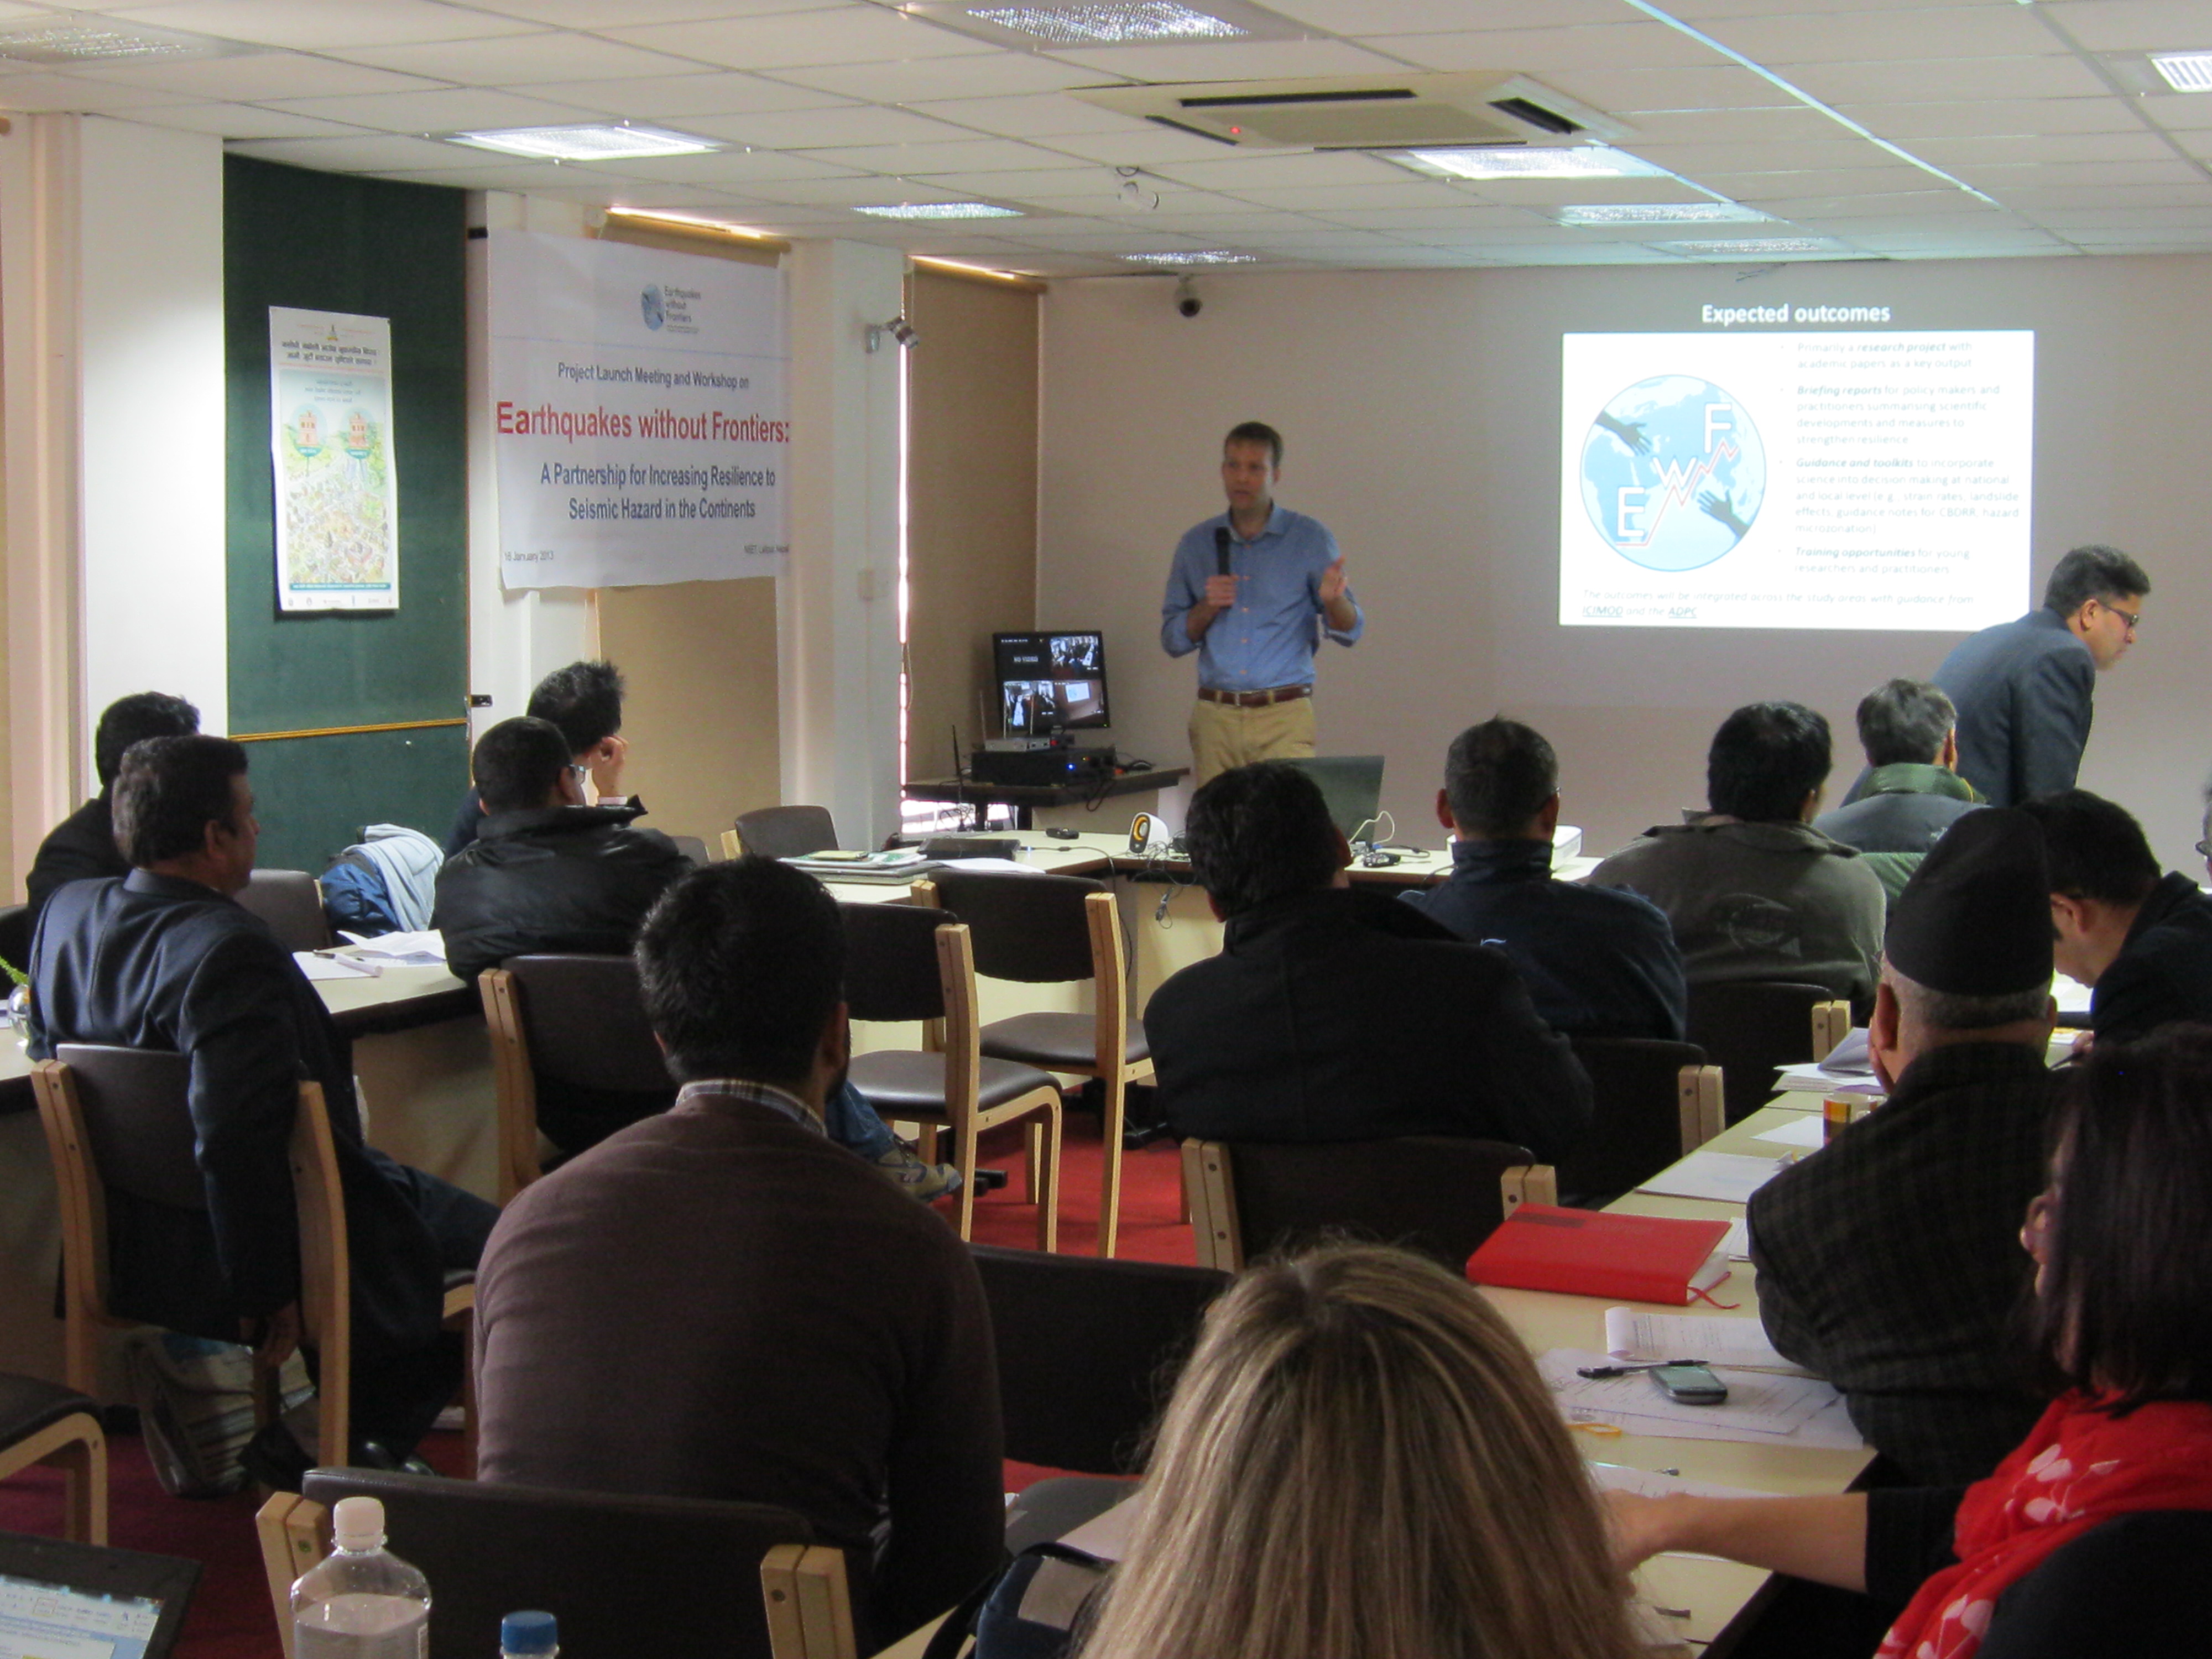
The EwF launch in Kathmandu, Nepal
Unlike India, with its clear government structure and institutional framework for disaster risk reduction (DRR), international organisations, NGOs, and donors have been driving the DRR agenda in Nepal. In line with Nepal’s commitment to the Hyogo Framework for Action, a National Strategy for Disaster Risk Management has been drafted, but this remains a strategy only with no formal legislative framework for DRR.
Despite this political impasse, progress is being made. The Nepal Risk Reduction Consortium (NRRC) provides the structure for action in Nepal by uniting humanitarian, development and financial partners with the Government of Nepal. The NRRC is structured around five flagship priorities: School and Hospital Safety; Emergency Preparedness and Response; Flood Risk Management and in the Kosi River Basin; Community Based Disaster Risk Reduction; and Policy/Institutional Strengthening. The EwF project will be working closely with the NRRC with a view to informing their programmes around earthquake risk reduction. We will also be sharing the learning from Nepal with other countries in the wider EwF Partnership.
During our time in Nepal, we have seen many examples of awareness raising, training and capacity building activities at the municipal/community level, and have taken part in some of these activities. Examples include NSET’s Earthquake Safety Day which saw more than 2,000 people from NSET, the Red Cross, police and other organisations participate in an awareness raising rally in Bhaktapur City; street theatre in Kathmandu to raise awareness around earthquake safe building construction; training for local masons; and retrofitting programmes in schools. Working with our local partners, the EwF team are exploring ways that natural and social scientists, and their research and expertise, might inform these types of activities to create a more earthquake resilient Nepal.
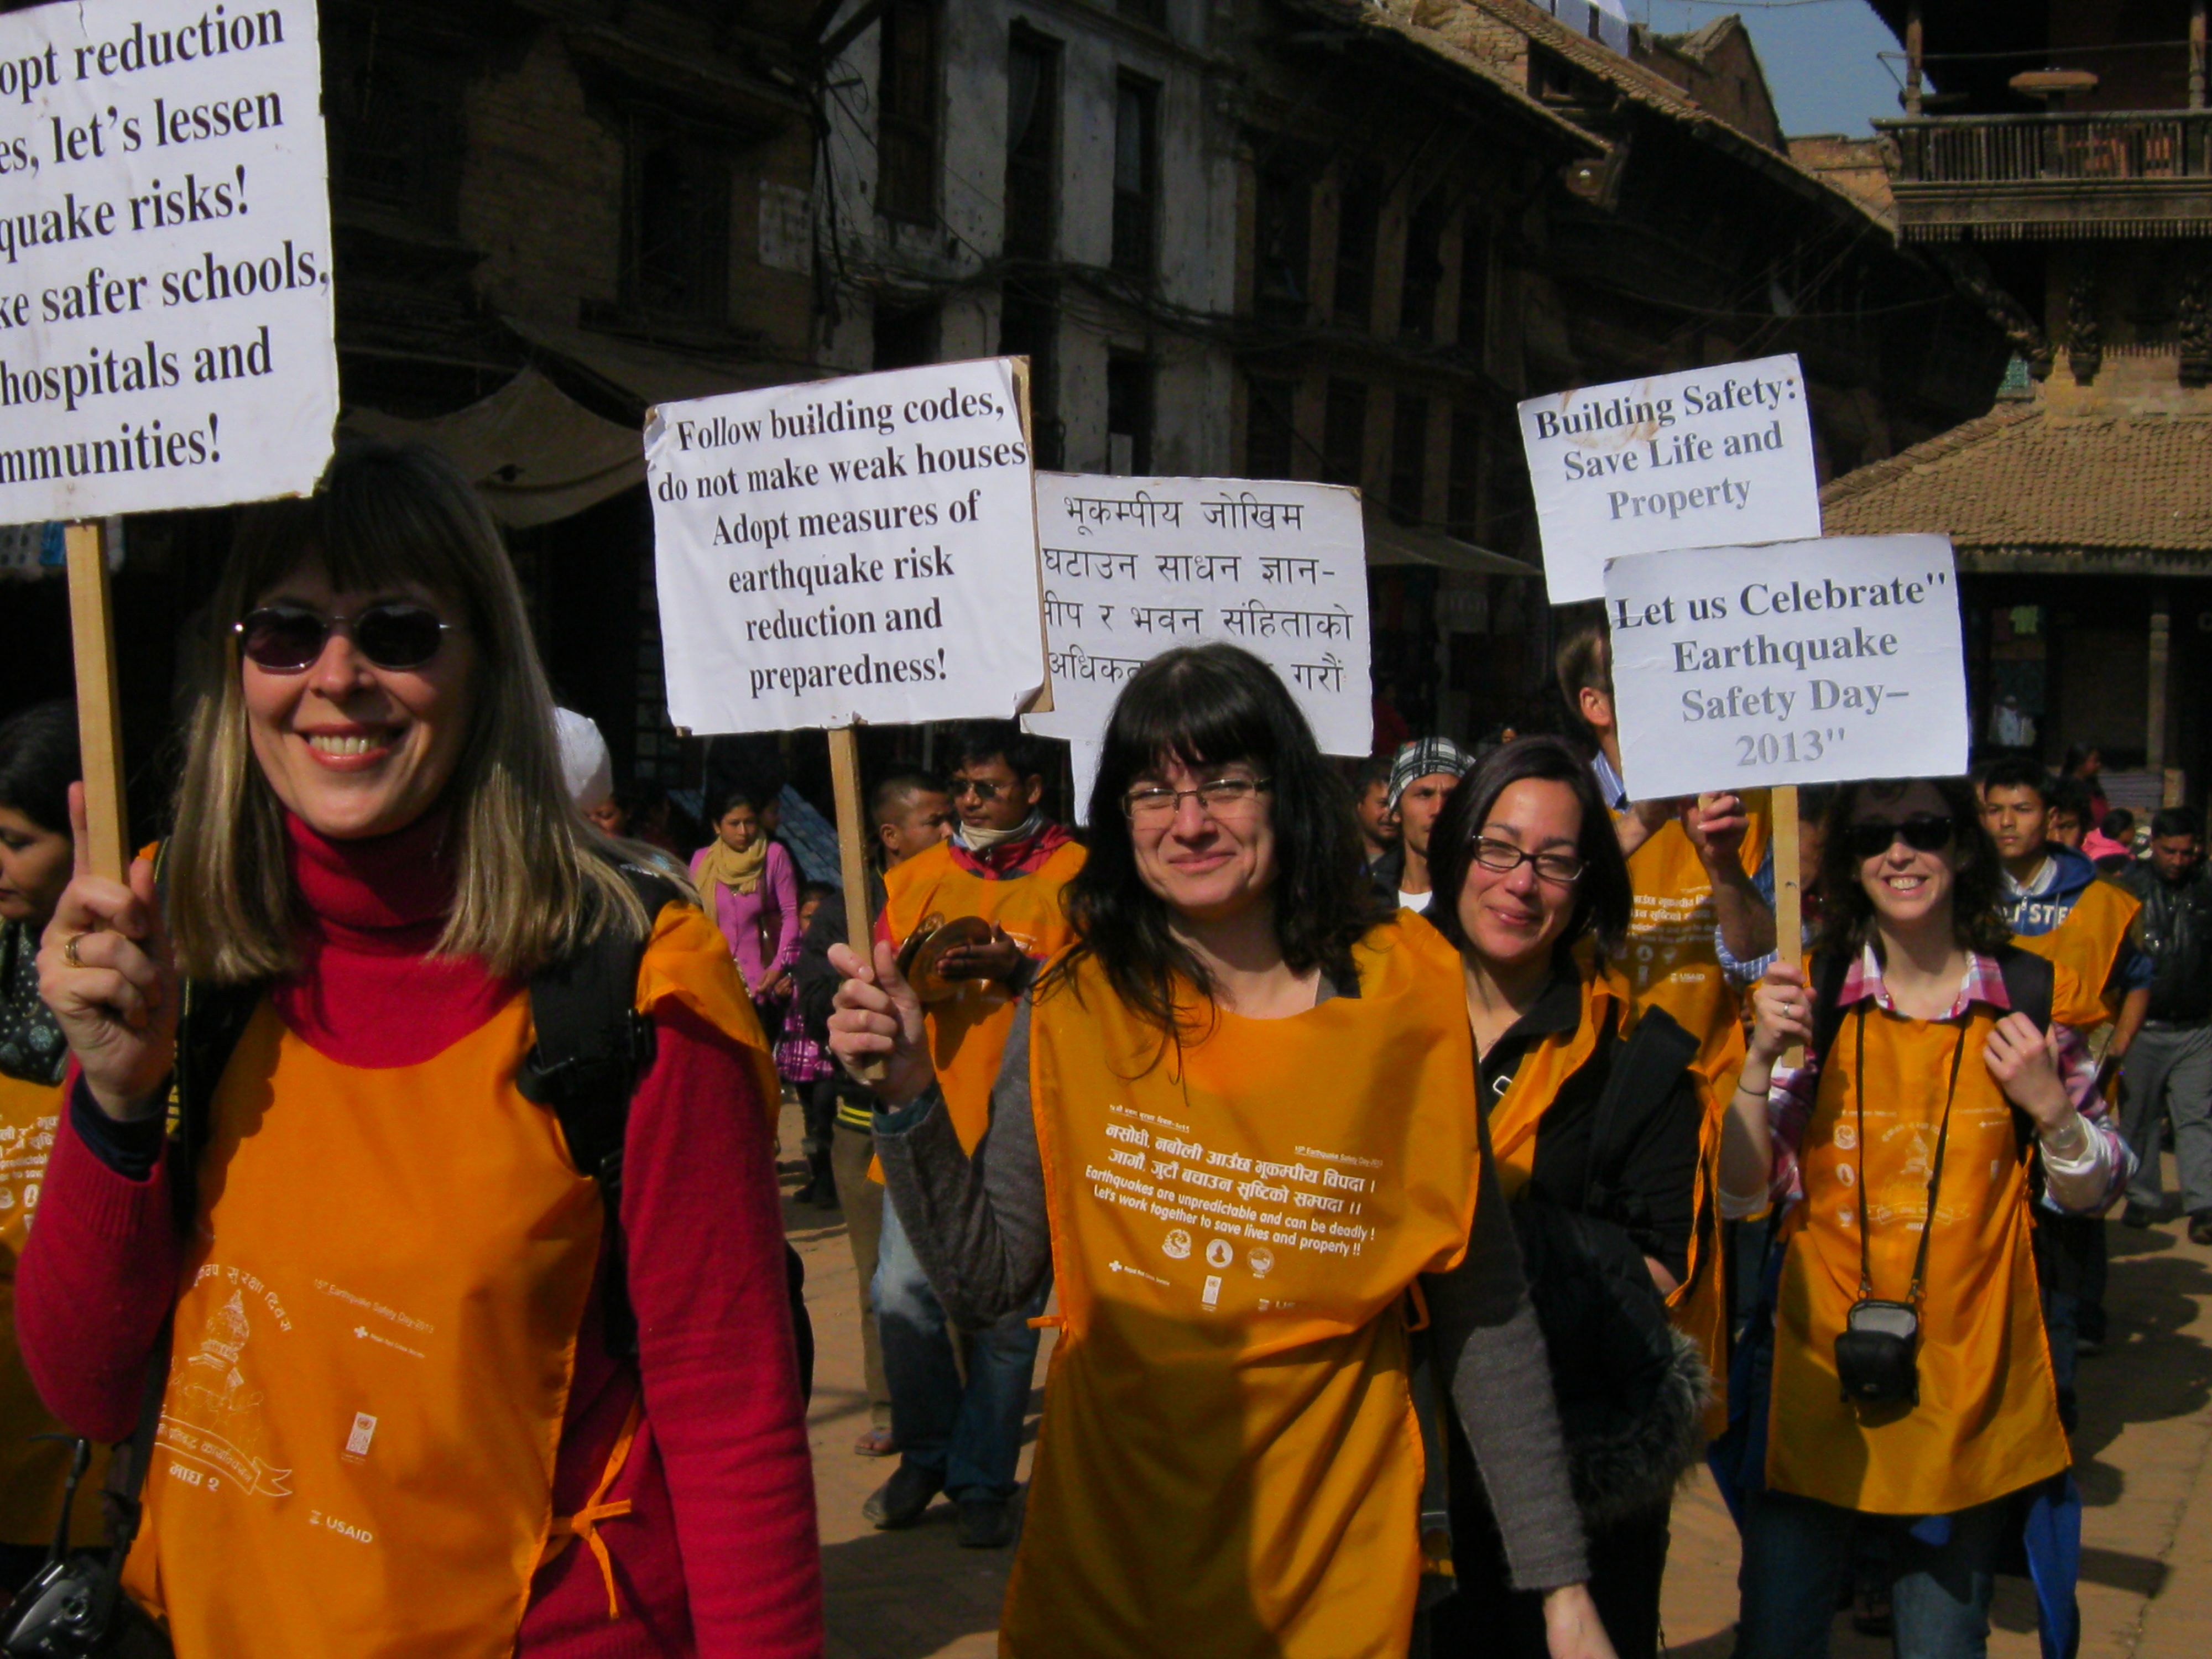
Members of the EwF Team participate in the Nepal Earthquake Safety Day rally
“Punarnava”: Bouncing back to life again and again
Samantha Jones and Katie Oven
The EwF launch in Patna, in the Indian State of Bihar, took place this week. Hosted by the Bihar State Disaster Management Authority, the launch was attended by 25 stakeholders involved in earthquake risk reduction in Bihar including government departments, international organisations, NGOs, and local universities and research institutes. The launch event provided an opportunity to identify and map out key stakeholders involved in earthquake risk reduction, and to discuss the aims of the EwF project in India and Nepal, along with the wider EwF partnership. Local stakeholders shared examples of resilience building activities underway in Bihar at both the state and local (district and community) levels. There was some preliminary discussion around research needs and opportunities for collaboration with the EwF project.
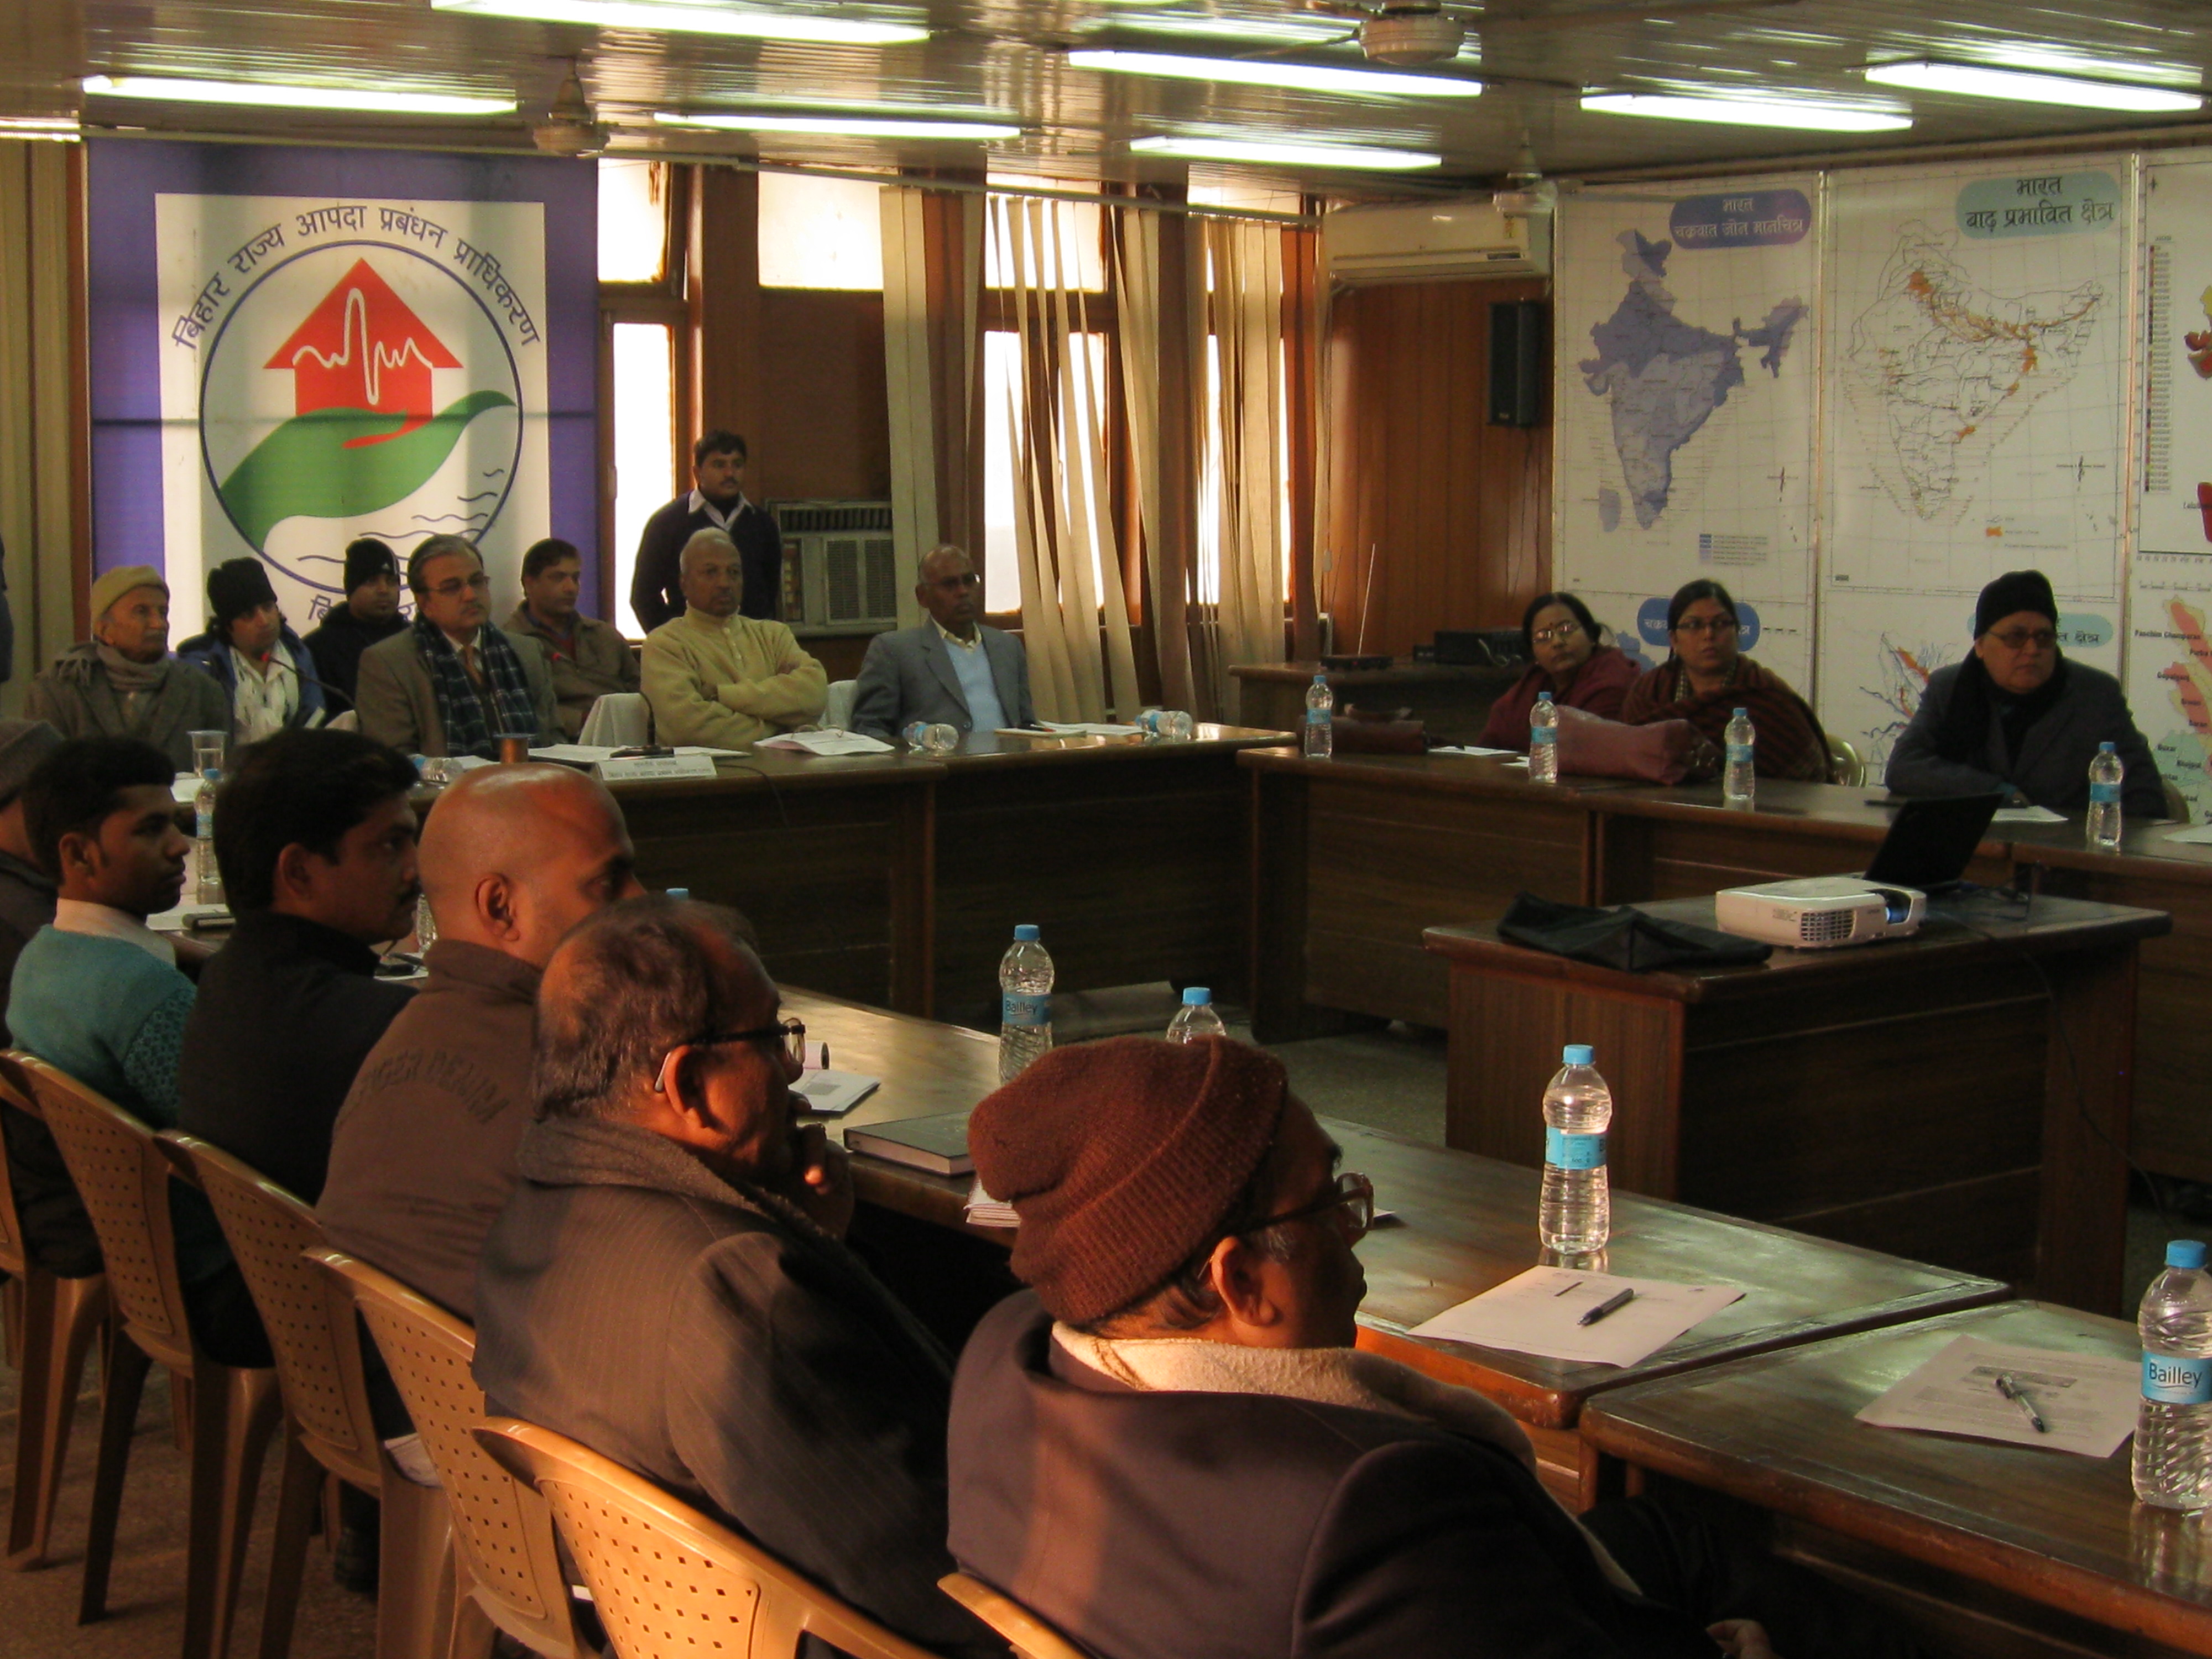
The EwF launch in Patna
The key legislation around disaster risk management (DRM) in India was passed in 2005 (the Disaster Management Act) by the National Government. Key drivers for policy change include past disasters (the 1999 cyclone in Orissa, the 2001 Gujarat earthquake, and the 2004 tsunami) and international frameworks such as the Hyogo Framework for Action. The legislation provides an outline of new structures, roles and responsibilities for DRM but this has only been institutionalised in Bihar in the last four to five years, primarily through the establishment of the BSDMA.
Bihar has long been described as a lawless, backward state. The new government, with its visionary Minister, has generated a sense of optimism amongst stakeholders. As noted by one participant: key people are currently in the right positions to forward the earthquake risk reduction agenda. In the last two to three years there is increasing evidence of awareness raising, capacity building and training in the context of earthquake risk reduction at the state, district and community levels. However, while resources are not considered to be a major constraint, DRM expertise, is acknowledged to be lacking. There are currently no building inspectors to enforce building codes (even though these exist). This has been attributed to a lack of knowledge among architects, engineers and masons and is a priority area currently being addressed by the BSDMA.
By Tim Middleton, PhD student at COMET+, Department of Earth Sciences, University of Oxford
Inner Mongolia is cold in November. Snow and ice blanket the elevated plateau and the biting winds drag the temperature well below minus 20°C. An enormous wind farm, recently installed by the local government, makes good use of the extreme weather. Herdsmen are dressed in fur coats and ski goggles, whilst other locals hack at frozen bales of hay with pickaxes. Perfect conditions, then, for a field trip examining the active faults!
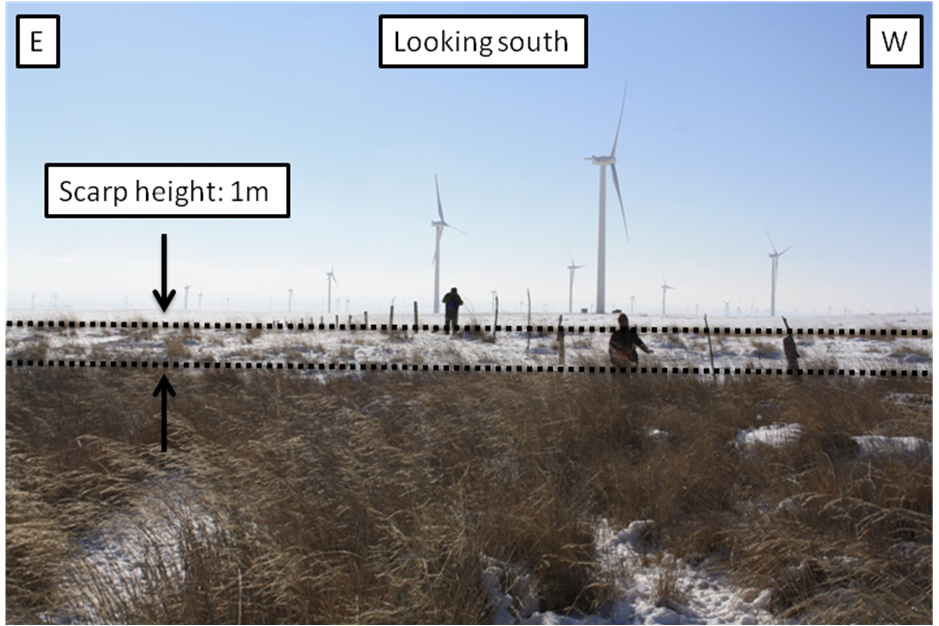
Figure 1: East-west strike-slip fault in Inner Mongolia with a small component of vertical motion to produce the scarp visible in the photograph (possibly the result of a single palaeo-earthquake rupture). The fence crossing the scarp clearly indicates the height difference. Drainage has ponded against the scarp leading to greater vegetation cover on the northern side of the fault.
At the end of November 2012 a small group of researchers (Dr. Richard Walker from the University of Oxford, Dr. Weitao Wang from the Institute of Geology at the Chinese Earthquake Administration and I) spent a busy week doing reconnaissance fieldwork in northern China. We were particularly interested in two things: the possible presence of active strike-slip faults in Inner Mongolia (the northernmost province in central China), and the determination of slip rates on the active normal faults in the northern Shanxi grabens.
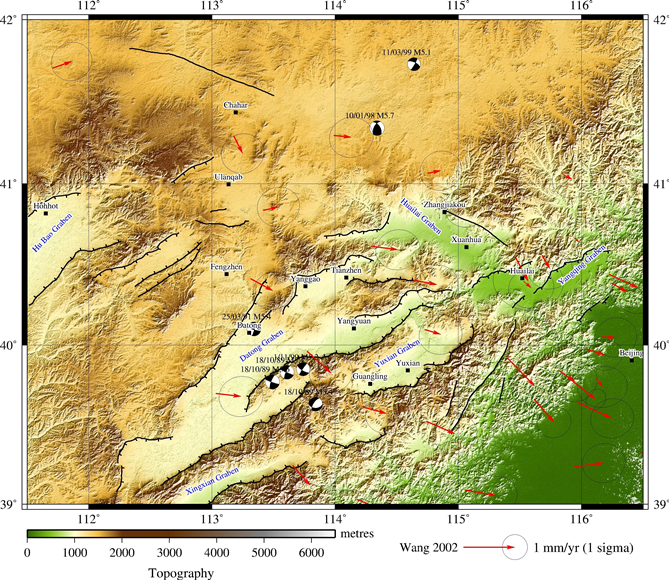
Figure 2: Topographic map of north central China. Beijing is just visible on the eastern edge of the map. Topographic data is from ASTER GDEM; GPS data is from Wang et al., 2002; focal mechanisms are from the CMT catalogue. Black lines indicate active faults and are drawn with the aid of topographic data and satellite imagery. A major strike-slip fault is visible to the northwest of the map, whilst the northern Shanxi grabens are shown towards the south of the map.
Up on the Inner Mongolian plateau, large areas are covered by Cenozoic basalt flows and the landscape is spotted with volcanic cinder cones. A number of the faults cut these flows and by determining the ages of the basalts we hope to be able to place constraints on the rate of motion of these faults. It is also interesting to note that the majority of the cinder cones form belts that trend northeast-southwest, parallel to the normal faults in the northern Shanxi. Tapponnier and Molnar (1977) suggest that this is to be expected given the overall northwest-southeast extension in the region.
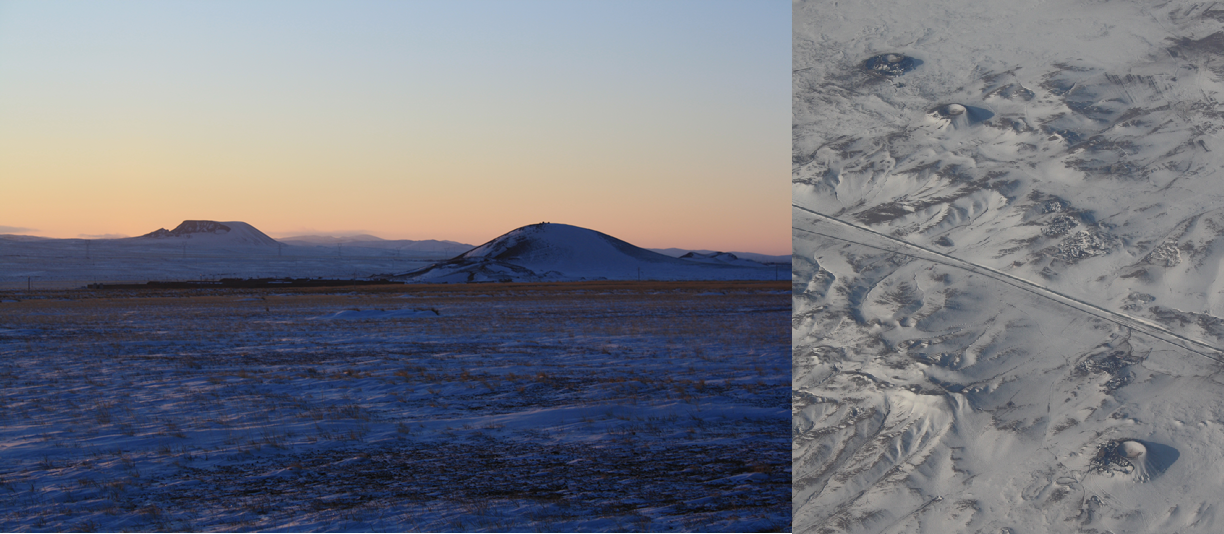
Figure 3: Northeast-southwest trending basaltic cinder cones. The same cones were visible from the window of our plane as we flew into Beijing!
After our sojourn to the freezing north, we moved south to the relatively balmy minus 5°C of Hebei and Shanxi provinces to visit the northern Shanxi grabens. This graben system constitutes the northern portion of the extension that is occurring along the eastern edge of the Ordos Plateau. It comprises a mixture of complete grabens—with intervening horst blocks—and tilted half grabens.
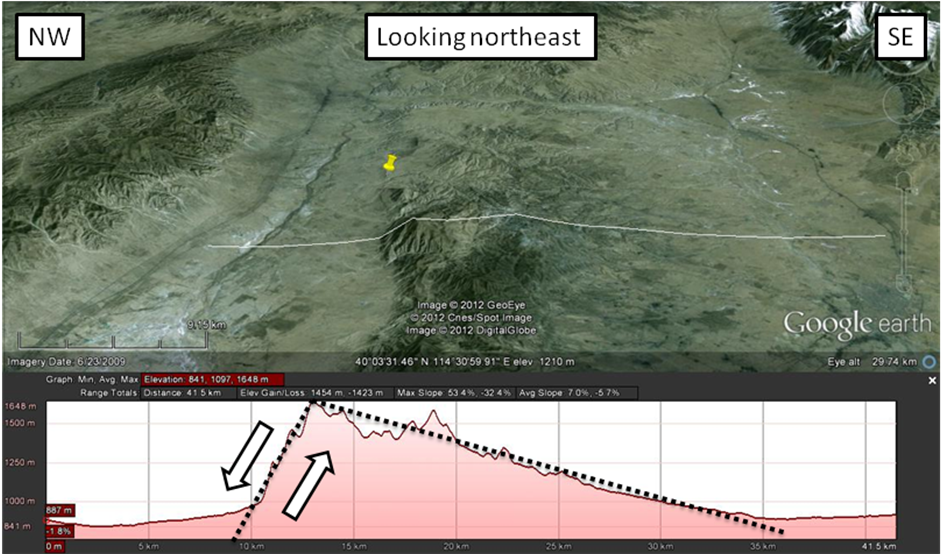
Figure 4: Topographic profile across the footwall of the fault on the southeastern side of the Datong Graben. The profile clearly shows the classic tilted block morphology expected of a half graben.
We visited graben-bounding faults on the northwest side of the Datong Graben, the southeast side of the Datong Graben and the southern side of the Yuxian Graben. At each site we took samples from loess deposits immediately overlying uplifted river gravels in the footwalls of the faults. By using optically stimulated luminescence (OSL) dating, we hope to be able to determine the rates of motion on these faults. In some locations we even found exposed sections of the fault plane, allowing us to measure its strike and dip. This will enable us to convert our vertical rates of motion into slip rates in the plane of the fault.
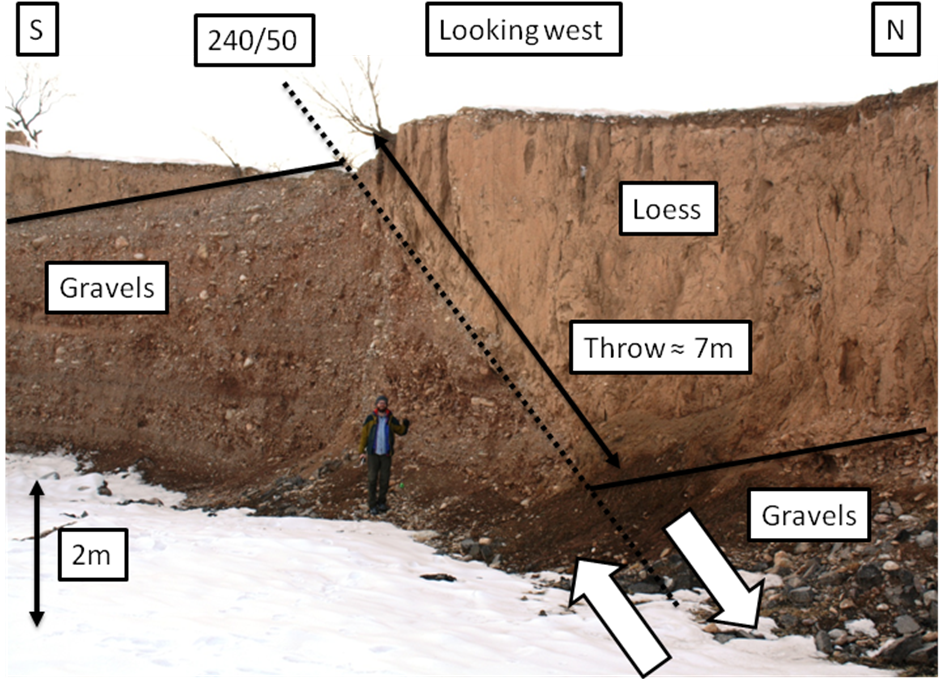
Figure 5: Exposed normal fault on the southern side of the Yuxian Graben. The contact between river gravels and the overlying loess is visible on both sides of the fault, allowing us to estimate the throw on this portion of the fault.
Along one arm of the Datong Graben the topographic data suggests that a new fault is growing in the centre of the basin. We drove past one evening and were rewarded with a stunning sunset view of the fault scarp, looking across the Sanggan River.
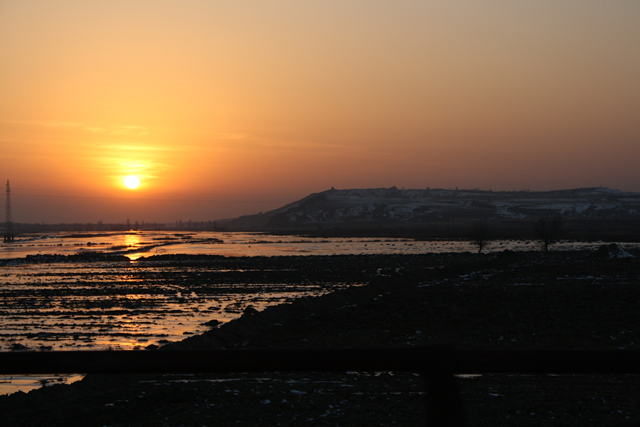
Figure 6: Sunset over the Sanggan River. The river is important because it supplies much of Beijing’s water. It also features in Ding Ling’s 1948 novel “The Sun Shines over the Sanggan River”, a reflection on the life of peasants at the time of land reform in northern China.
Few earthquakes have severely affected this part of China in recent history, but the faults we saw on this trip show clear evidence of Quaternary activity. Hopefully we will be able to learn a lot more about them on future trips—perhaps when it’s slightly less cold!
With thanks to Dr. Weitao Wang and the Institute of Geology at the Chinese Earthquake Administration.
The M=7.4 that struck just offshore western Guatemala yesterday is now believed to have killed at least 48 people, with more people thought to still be buried in the rubble. The location of the epicenter of the earthquake, as measured by the USGS, indicates that there is high ground within the area that might be expected to have suffered high peak ground accelerations (as the Google Earth perspective view below shows), indicating that landslides are likely:

Inevitably, the area affected by landslides is both remote and inaccessible in the aftermath of the earthquake, so a proper understanding of the landslides will take some time. In the meantime, there is some evidence that landslides have been a significant problem. The BBC has two images that show landslides. The first appears to be a simple rockslope failure:

Whilst the second is a slope failure in an aggregate quarry that is reported to have claimed seven lives:

The Washington Post has another picture of what I assume is the same site:

More images of the landslides will probably emerge in the next day or so.
Kazakhstan is a final frontier in understanding Central Asian neotectonics related to the India-Eurasia collision. This vast, enigmatic country comprises many major active faults and consequently is no stranger to earthquakes, having suffered a series of catastrophic events within the last 125 years. Despite this stark earthquake hazard, there is a need and opportunity to develop an understanding of this region through integration of fieldwork with modern space-based observations from satellite imagery, Global Positioning System (GPS) networks and Interferometric Synthetic Aperture Radar (InSAR).
Our observations of high resolution satellite imagery and in the field not only reveal many
previously unidentified major active faults (defined as those which offset late Quaternary features such as abandoned alluvial fan surfaces) but also a majority of other large faults that although are recognised structures, are not considered active. Essentially, nothing is known of the earthquake repeat times or slip rates on these faults, which due to their close proximity to towns and highly populated cities, pose a very serious and realistic seismic hazard.
.
If we hope to help increase Kazakhstan’s resilience to earthquakes and their hazardous secondary effects such as landslides, a first step must be to properly identify and characterise in detail the seismogenic faults of this country.
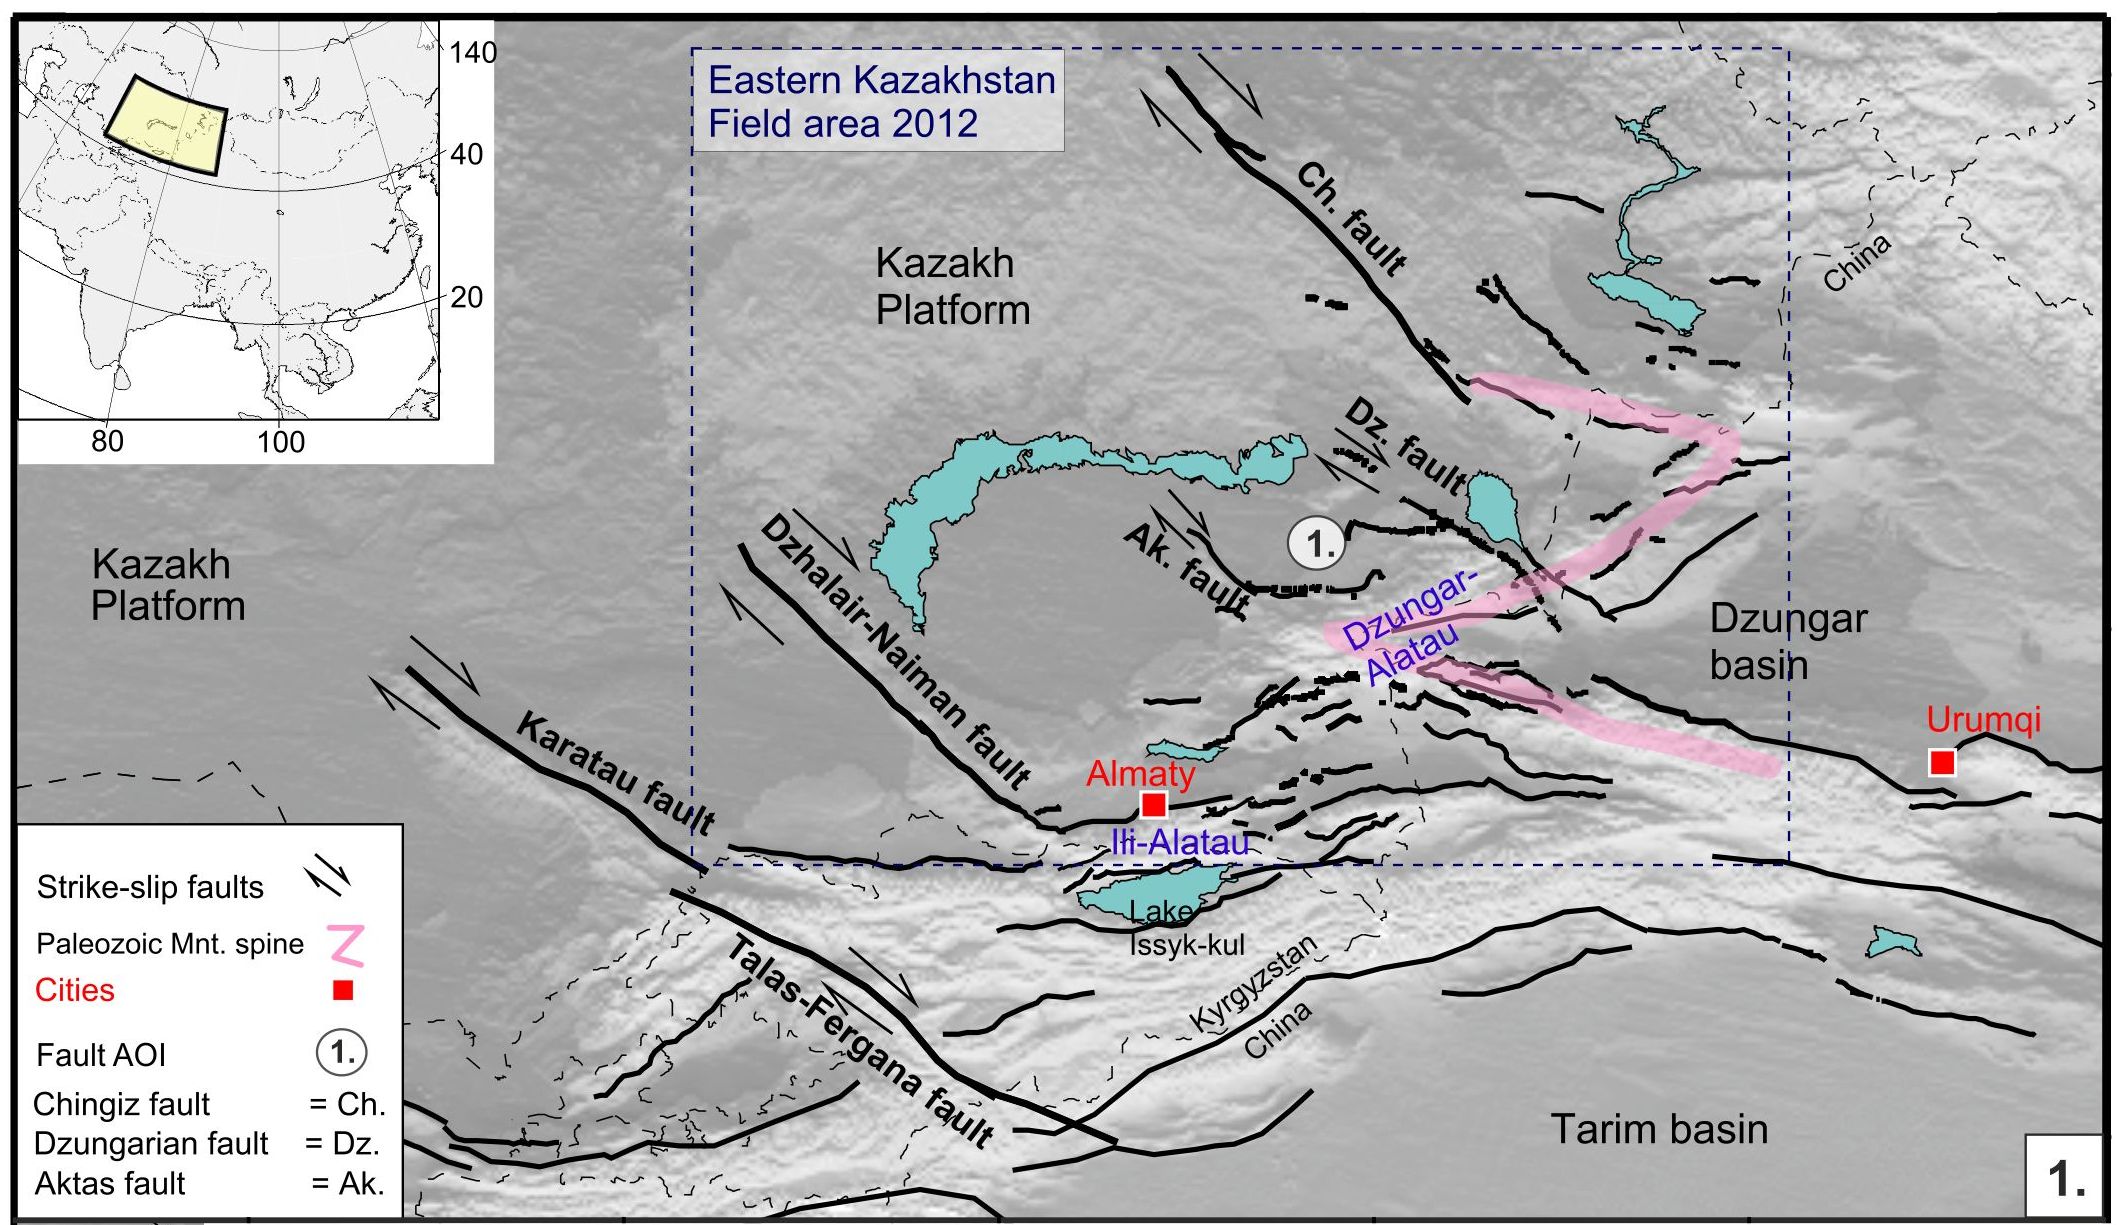
Topographic map of eastern Kazakhstan, showing the major active faults (black lines), and the z-shaped Paleozoic mountain spine (pink ‘Z’). Topography is greyscale (lighter = higher elv.)
The focus of our research lies in eastern Kazakhstan (Fig. 1), a region characterised by several different mountain range orientations, which together form a Z-shaped Paleozoic mountain spine spanning over 800 km from S to N. The different ranges are interspersed amongst rolling, golden steppe-land and late Cenozoic sedimentary basins. This unusual mountain-range configuration is controlled by the active tectonics of the region. Major strike-slip faults extend for hundreds of kilometres, cutting through the high mountains and often radiating from the high mountains into the flat desert plains of the Kazakh platform (Fig. 1). We find that right-lateral faults are predominantly oriented NW-SE, and left-lateral and reverse faults are predominantly orientated E-W. Movement on these faults, particularly since the beginning of the most recent period of mountain building
activity (~25 Ma), has resulted in the stunning 4,000 m snow-capped peaks of the Ili-Alatau and Dzungar-Alatau mountain ranges. These same fault movements have also resulted in devastating earthquakes such as the 1911 Chon-Kemin event (Mw ~8.2), which destroyed Kazakhstan’s former capital city, Almaty.
.
The scientific team this September consisted of five UK researchers (Dr. Richard Walker and two first year PhD students David Mackenzie and Tim Middleton from Univ. Oxford, and Prof James Jackson and myself, from Univ. Cambridge) and Professor Kanatbek Abdrakhmatov, Director of the Institute of Seismology in the Kyrgyz Republic National Academy of Sciences, Bishkek. Also on-board was expert off-road driver (Ivan) and camp manager/cook (Inagul). The Institute of Geophysical Research, National Nuclear Centre of the Kazakhstan Republic supported our trip and hosted us in Almaty. We also had a promising first meeting with academics from the Kazakh British Technological University (KBTU), Almaty, who this year, for the first time have opened a Department of Geology.

The ~7-10 m vertical scarp cuts through Paleozoic mountain ridges in the high Dzungar-Alatau in the faults eastern extent, there is also a ~3 m right-lateral component. This overall offset has blocked drainage forming inter-ridge ponds.
A major component of our work this summer involved making a detailed investigation a major fault, which extends over 100 km E-W from the high Dzungar-Alatau mountains into the flat Kazakh platform. Along the faults length, a consistent ~7 to 10 m scarp is impeccably preserved offsetting Paleozoic mountain ridges (Fig. 2) and along the range front in its eastern extent, and as a single ~7 m vertical step within otherwise flat-lying, vegetated desert loess in its western extent (Fig. 3). Along the length of the fault, ponds have formed where drainage is blocked by the vertical offset. In particular we were interested in a ‘ghost’ river channel which was abandoned by uplift on this fault (Fig.4).
Based on the continuity and consistency of the scarp height over the entire fault-length it is likely that this fault scarp was formed during one very large, catastrophic earthquake. To test this hypothesis, we collected sediment samples from the base of several dried-pond sites in the east and west of the fault and from the abandoned ‘ghost’ river channel. If this was indeed one event, then the ages of these samples should be the same. Using the date of this event and quantitative measurements of the amount and sense of displacement found using field-surveyed digital elevation models (DEMs) we can calculate a minimum late Quaternary slip-rate, which will provide the first ever constraint on the seismic hazard of this fault.


Digital elevation data highlights the ‘right angle’ fault termination in the Kazakh Platform. This fault geometry and offset has caused the abandonment of a river channel in which flow orginally ran from N to S. The offset caused by this paleo-earthquake blocked the original drainage, forming ponds against the upthrown (S) side.
Closer to Almaty, we made preliminary field observations of a major right-lateral strike-slip fault, Dzhalair-Naiman (Fig. 1), which extends over 400 km NW-SE into the Kazakh Platform, and finally we conducted several slip-rate studies along the E-W oriented Zailisky-Alatau range front (part of the Ili-Alatau mountain range) which forms the snow-capped backdrop south of Almaty. In particular, the fault scarps investigated at these final sites may be potential paleo-rupture candidates for the historic Mw ~7 to 8 earthquake which devastated Almaty (formerly Verny) in 1887.
In early September 2012 a series of small but shallow earthquakes affected Yunnan Province in China. The main events were two earthquakes on 7th September, an Mw=5.6 event at 03:19 UTC (11:19 local time) and a Mw=5.3 event at 04:16 UTC (12:16 local time). Although small these two earthquakes caused considerable damage in the epicentral area, with a reported 81 fatalities, 800 injuries and over 6500 houses destroyed. Direct economic costs are estimated to be over $500 million.
The worst affected area was Yiliang County. The chaotic scenes during the earthquake, and in the aftershock sequence, are well-captured by this amateur video that was recorded at the time:
Unfortunately, it is a common facet of earthquakes in mountain areas that they leave a legacy of unstable slopes, many of which then collapse as landslides in the first heavy rainfall event. In Yiliang this appears to have happened yesterday, resulting in a genuine tragedy. In the town of Zhenhe, within Longhaixiang Township in Yiliang County a slope collapsed without warning yesterday morning, burying a primary school. In total 18 young children, who were in the school to take additional classes on the National Day holiday in order to make up for the schooling that they lost as a result of last month’s earthquakes, were killed. A local person also died.

http://news.xinhuanet.com/english/china/2012-10/05/c_131888710.htm
Unfortunately, it is likely that further landslides will affect this area in the coming months or even years, meaning that careful hazard management will be essential.
New Zealand is a country with a high rate of tectonic activity, such that earthquakes are an ever-present hazard across much of the country. In South Island the most important geological structure is the Alpine Fault, which runs for about 500 km along the west side of the mountain chain before splitting into a series of faults (known as the Marlborough fault system) that cross the northern part of the land mass (image from the University of Otago):

http://www.otago.ac.nz/geology/research/structural_geology/alpinefault/index.html
Technically, the fault is a right-lateral strike-slip fault, which allows the Pacific Plate to the east to slip past the Indo-Australian plate to the west. However, the fault also accommodates substantial convergence, meaning that there is a thrusting component that is responsible for the uplift of the Southern Alps. The average rate of slip along the fault is about 30 mm per year, which is relatively quick for such a system.
The most recent earthquake on the Alpine Fault occurred in 1717 AD, and is thought to have generated an earthquake with a magnitude of 8.1. Previous large magnitude (M>8) events are known to have occurred on average every 350 years, with known events in about 1100 AD, 1450 AD and 1620 AD. There have been 24 known rupture events in the last 8000 years. This means that the likelihood of a large earthquake on the fault is quite high – the current best estimate is that there is a 30% probability of a large earthquake on the Alpine Fault in the next 50 years.
The fault is often difficult to observe directly as the rate of erosion and deposition in New Zealand means that it is often buried. However, at Hare Mare creek, not far from Franz Josef, the fault is exposed on the side of the valley:
 At this location, bedrock (consisting of a hydrothermally altered basal cataclasite overlain by a sequence of fractured mylonites) can be seen thrust over young river gravels.
A field guide to outcrops of the Alpine Fault is available here (NB large PDF file)

View to the west of the Zailisky Alatau range, from the 4000+ m peaks near the range crest on the left to the hazy lowlands on the right. The city of Almaty is out of view to the right.
It is hard to miss the mountains in Almaty, Kazakhstan. If you look south between the trees and the tall buildings rising all around the city, you can catch a glimpse of the snowy peaks of the Zailisky Alatau from nearly everywhere in the city. They rise to nearly 5000 m, and President Nursultan Nazarbayev climbed to the top of one of the highest in 1995. But although the mountains give Almaty a pleasing set of views, a nearby ski resort, and plenty of opportunities to escape the city for the cool alpine air, they are the direct evidence of one of the biggest threats facing the city: earthquakes.
The Zailisky Alatau reach such picturesque elevations because of the presence of one (or more) active thrust faults along the base of the range. These faults, which have not been mapped in detail but which must lie close to the city’s affluent southern suburbs, have gradually built up the range through repeated earthquakes. Almaty was destroyed or damaged by earthquakes three times in the last 125 years, most recently in 1911, and while the precise sizes and locations of these events are not known, it is inevitable that future damaging earthquakes will occur. This fact is not lost on the city’s population – conversations over the last few days have shown a sophisticated understanding that earthquakes are a major hazard. Indeed, the threat of natural disasters is one oft-cited reason for the 1997 decision to move the Kazakh capital to Astana, far to the north in a geologically-uneventful location on the steppe.

View of the Zailisky Alatau from Almaty city. The snow-capped mountain on the left is Talgar Peak, while that on the right is Nursultan Peak. In the foreground is Panfilov Park and the towers of The Zenkov Cathedral.
Worryingly, the city may be becoming less resilient to future earthquakes as it grows. Work commissioned by GeoHazards International in the 1990s showed that at least some Soviet-era apartment buildings were actually fairly resistant to damage in large earthquakes, and more importantly were designed to be relatively insensitive to variations in construction quality (a full report is available here). The centralised nature of Soviet planning also ensured that adequate space was left between residential blocks, a key factor in ensuring quick access by emergency services in the aftermath of a disaster. In contrast, the rapid post-independence development of Almaty as a regional business hub has meant that such rigorous controls have been relaxed. While planning and seismic safety codes remain on the books, some residents feel that older Soviet-era buildings are more likely to be earthquake-resistant — although they may also be seen as less desirable or prestigious places to live. The rise of a middle class in Almaty, and increasing demand for newly-built detached family homes, mark an important opportunity to ensure that earthquake resilience is on the agenda of both citizens and government agencies.
Kazakhstan is positioning itself as a regional leader in a number of areas, not least in disaster risk reduction. As one of the first two countries involved in the Central Asian Centre for Disaster Response and Risk Reduction, as a net donor to disaster response activities, and as the strongest economy in the region, it clearly has a critical role to play. One of our tasks within the EwF project will be to explore the ways in which that role can best be fulfilled.
By Dr John Elliott, project partner and Post-Doctoral Research Associate at COMET+, Department of Earth Sciences, University of Oxford
This article was first published in the Blue Marble,The magazine of the UK’s National Centre for Earth Observation, in Winter 2011.
 Almost two hundred people died in the recent earthquakes in New Zealand. Now, with careful analysis of radar measurements, NCEO scientists have discovered that the hazard for the city’s inhabitants may not have gone away. In September 2010, a large earthquake surprised the population of the South Island of New Zealand. It
ripped a 30km tear across farmland outside the city of Christchurch. In just a few seconds, roads, trees and fences were jolted sideways and permanently shifted by up to four metres. Fortunately, no one was killed. Then, less than six months later, another big
quake shot up right under the city. This time, the sheer proximity of the earthquake resulted in the deaths of 186 people and a partial exodus as others sought temporary refuge elsewhere.

Earthquakes are common in New Zealand and the country’s geological survey has mapped many faults in the Southern Alps of the South Island. The whole country is being squeezed and stretched as the geological plates of the Pacific and Australia collide.
New Zealanders are caught in the middle of a tectonic struggle that has been going on for millions of years.
Chicane
The earthquake danger for the region of Christchurch (with a population of 330,000) was thought to lie on mapped faults high up in the hills and snow-capped mountains, not in the low-lying regions of the fertile Canterbury Plains on which the city lies. However, both recent major earthquakes happened on previously unknown faults, hidden beneath the gravels of the Canterbury Plains. These faults are not the fastest moving in New Zealand and probably have not ruptured for many hundreds or thousands of years. Satellite radar
and optical images are allowing my colleagues and I at the Centre for Observing and Modelling Earth’s Tectonics (COMET+) to find the exact locations of the faults that broke in these earthquakes and, perhaps more importantly for assessing future seismic
hazard, the places that did not.

The ground can be permanently moved by metres in large, shallow earthquakes
as trillions of tonnes of the Earth’s outer crust are shifted in a matter of seconds.
In the first New Zealand earthquake, parts of the northern end of the Canterbury Plains were pushed closer to the city by up to four metres. At the fault line, this caused a big step in the criss-crossing pattern of roads that were previously constructed straight, resulting in a chicane as if on a racing track. We have used satellite images from WorldView-2 with a half metre resolution to measure 50 of these bent roads and hedges. These can then be compared to what our field geologist colleagues measured on the ground in the days after the earthquake.

On the ground, however, it is only possible to make measurements along the line of the fault where the offsets of roads and fences can be found. We get a much bigger and better picture of the smaller ground movements when we use satellite radar measurements. These observations are also more useful than those
from optical imagery ones, as they can be used at night and in cloud because the radar signal goes right through the haze.
Elastic band
The radar instrument on board a Japanese satellite called ALOS acquired images before and after both earthquakes. By looking at the difference in time it took the radar to bounce off the Earth and return to the satellite, it was possible to create a map of how far the ground moved in each earthquake. By using simple models of the Earth that treat it like a
big elastic band, we can find out where the faults lie because this is where the earth has snapped the most. Perhaps more importantly, our models indicate that there has been very little ground motion in-between these two earthquakes. This is referred to a seismic
gap and lies to the western edge of Christchurch. If a potential fault line lies here then it is under increased pressure and could break in the future – the gap being long enough that the earthquake generated could be just as big as before.
The population of Christchurch now faces an uncertain future and some difficult choices.
Earthquakes cannot be predicted and the uncertainties in the probabilities of more significant earthquakes in the coming decades are large. The conclusions we draw from the satellite observations will permit a much more informed decision to be made by the New Zealand government regarding the location and strength of future buildings in the region; something that would not have been possible at this level of precision prior to the advent of remote satellite observations.
The first partnership meeting of the Earthquakes without Frontiers project will take place in Cambridge, UK, on 19-21 October 2012. The meeting will involve the project team, members of the project advisory board, and partners from 11 different countries across the Alpine-Himalayan mountain chain, as well as representatives of national and international NGOs. We will be blogging about the meeting and its main outcomes both during and after the meeting. We’re looking forward to an exciting, challenging, and productive discussion.
Welcome to the blog for the Earthquakes without Frontiers project. This project is an international partnership to increase resilience to earthquakes in the continents, with a particular focus on the Alpine-Himalayan mountain ranges in Europe and Asia. The project is funded by the UK Natural Environment Research Council and the Economic and Social Research Council.


