Nepal earthquake: likely areas of landsliding
UPDATED 26 April 2015 to reflect new USGS ShakeMap results; this has resulted to some changes in the landslide susceptibility pattern in Tom Robinson’s model
The Mw 7.9 Nepal earthquake on 25 April 2015 appears to have occurred on a shallowly north-dipping thrust fault beneath the Himalayas of central Nepal. The steep topography and high relief in the area of the epicentre, and the high intensity of shaking that was felt, mean that thousands of landslides are likely to have been triggered by the earthquake. Based on past experience of earthquakes in steep mountainous terrain, like the 2005 Kashmir and 2008 Wenchuan earthquakes, some of these landslides will be large enough to create temporary dams across rivers in the area. The lakes created by these dams are particularly hazardous because they can drain without warning, usually within a few days of filling up, due to collapse of the unstable dam material.
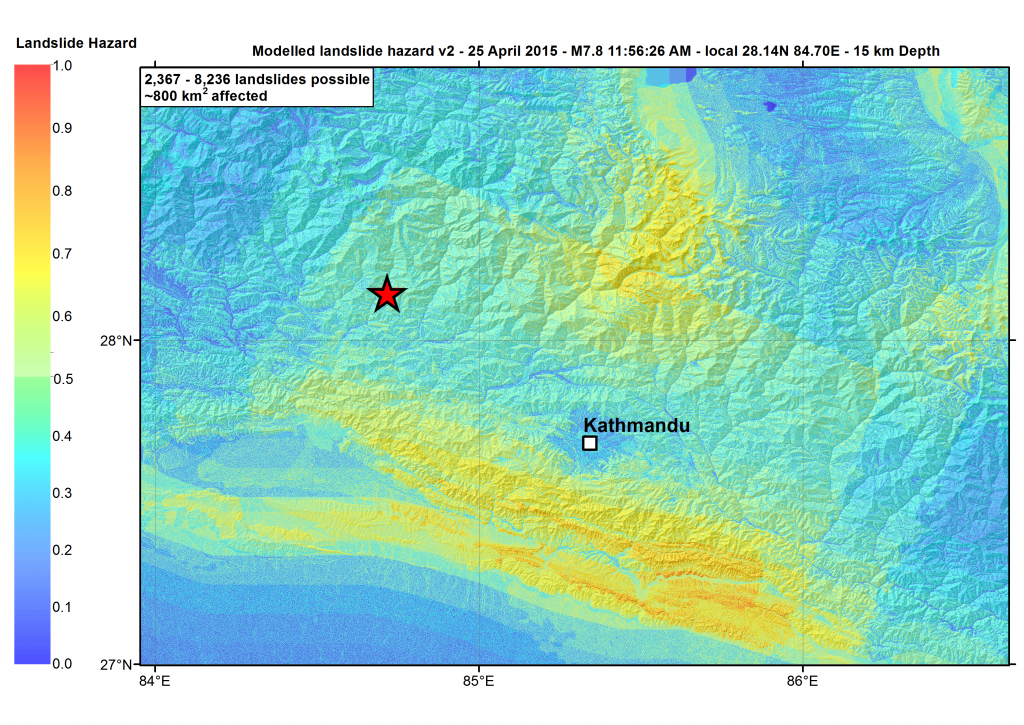
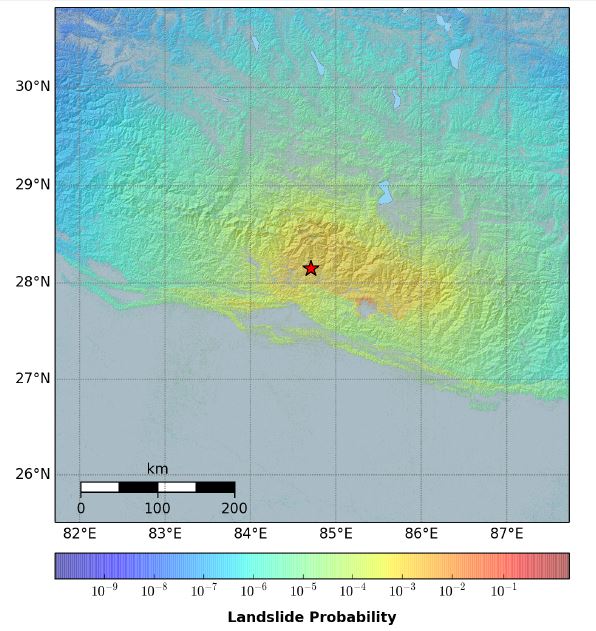
Mapping the landslides will require satellite imagery taken after the earthquake. In the meantime, it’s useful to see what areas are likely to have been most affected by landsliding. The images below show the outputs of two different models of landslide susceptibility – that is, the probably that a landslide will have occurred in any particular place. Susceptibility in these models is determined by the intensity of the shaking (derived from the USGS ShakeMap estimates, http://earthquake.usgs.gov/earthquakes/eventpage/us20002926#impact_shakemap), the steepness of the topography, the position of a given location on a hillside (because shaking tends to be greater at the tops of ridges than in neighbouring valleys), and the aspect (the direction in which the hillside faces).
The first map was produced by Dr Tom Robinson of the University of Canterbury, New Zealand (http://www.geol.canterbury.ac.nz/People/students/Tom_Robinson.shtml), using a model that he developed with Dr Theo Kritikos and Prof Tim Davies. More details about the model are available at http://onlinelibrary.wiley.com/doi/10.1002/2014JF003224/abstract.
The map shows that high landslide susceptibility values – and thus the greatest chance of landsliding – occur in the high Himalayas to the north of the epicentre and Kathmandu. This includes the major river valleys of central Nepal, including the Kali Gandaki, Marsyandi, and Trisuli Rivers, as well as parts of the Sun Kosi River catchment. These areas also have high relief between valley floors and ridge crests, meaning that landslides there are potentially large enough to block the valleys. There are also high values in the foothills south of Kathmandu. While relief in the foothills is somewhat smaller (up to about 1000 m), this area also includes the major roads from India and southern Nepal into the Kathmandu Valley. We have heard from colleagues at NSET that travel between Bharatpur (south of the epicentre) and Kathmandu is still very difficult, which would be consistent with these susceptibility patterns.
The second map was produced by Dr Rob Parker of Cardiff University (http://www.cardiff.ac.uk/earth/research-staff/dr-robert-parker/). It shows estimated landslide probability, where values closer to 1 indicate a greater likelihood that a landslide occurred at that location.
Again, the maps shows that landslides are most likely to have occurred north of the epicentral area and extends from about 84.5°E to 86.5°E. Landslides are also expected in the foothills, particularly north of the Chitwan Dun (the trapezoidal-shaped area of low elevation, to the south of the epicentre). Rob’s model estimates that the total area of landslides in that region is about 30 km2 (for individual failures larger than 1 ha or 10,000 m2). While that seems large, it is much smaller than area of landslides in the Mw 7.9 Wenchuan earthquake in China, which was about 396 km2 as mapped by Gen Li and colleagues (http://onlinelibrary.wiley.com/doi/10.1002/2013GC005067/full). This may be due to the fairly moderate intensity values of VII or less over most of the region between the epicentre and the Kathmandu Valley. Kathmandu itself seems to have experienced much greater intensities of VIII or IX – probably because seismic waves were amplified by the soft sediment fill within the valley. Despite this intense shaking, the risk from landslides within Kathmandu is small except on the edges of the valley itself.
It must be stressed that these are preliminary estimates, and that they are based on very generalised models. In particular, they depend heavily on the intensity estimates from ShakeMap, which are very uncertain, and will be refined over the next few days and weeks. As of this writing, there have been almost no reports of shaking or damage from the epicentral area, so the peak intensities are definitely underestimated by ShakeMap at the moment. As those increase, so too will the probability of landslides. The susceptibility maps also don’t tell us anything about the likely sizes of the landslides that have occurred, and whether or not they have blocked roads or river valleys. Nevertheless, they provide some ideas about where the hardest-hit areas of Nepal might be, and give us a way of focusing our attention and efforts in understanding the effects of the earthquake.


Fantastic work you’re doing here, EwB.
I can empathise with your pbolrem. In the medical world, we have a similar pbolrem, take for example the word fall’. There are various articles written on people having falls, but almost each article has a different interpretation of the word fall. You have mechanical falls, physiological falls, near falls some studies include near miss falls. other studies say that a fall can only be when somebody accidentally ends up on the floor, others have a different twist.While this is not the same as a landslide, your frustration just happened to bring the fall’ing thing to mind.While it would be very interesting and amusing to read an article on sloppy pink smurf’, I’m not sure how the rest of the scientific community would like it. It’d be a little confusing to read, but if you did it just right it would be a great laugh. Howbeit, knowing research literature, it would be extremely difficult to create any sort of conversion tool, as it would need to include near as many different classification schemes as there are people with different brains.My opinion is that creating a conversion tool will/could/might make your thesis more complicated and difficult but on the other hand, if you managed to group the different classification standards based on similarity, you might get somewhere.This is starting to make me think of meta-analyses but you probably know more on research stuff than me me being well me, not very highly educated as yet.