New satellite maps out Napa Valley earthquake
A new Earth-observation satellite called Sentinel-1A has been used for the first time to map the ground movements caused by the magnitude 6 earthquake that shook up California’s wine-producing Napa Valley on 24 August 2014 (European Space Agency). The interferogram of the rupture clearly confirms that part of the West Napa Fault system was responsible for the earthquake (BBC News Article on the satellite interferogram and earthquake). This fault had not been identified as being particularly hazardous prior to the event. The images are being used by scientists (such as such as field teams from the University of California Davis) on the ground to help them map the surface rupture.
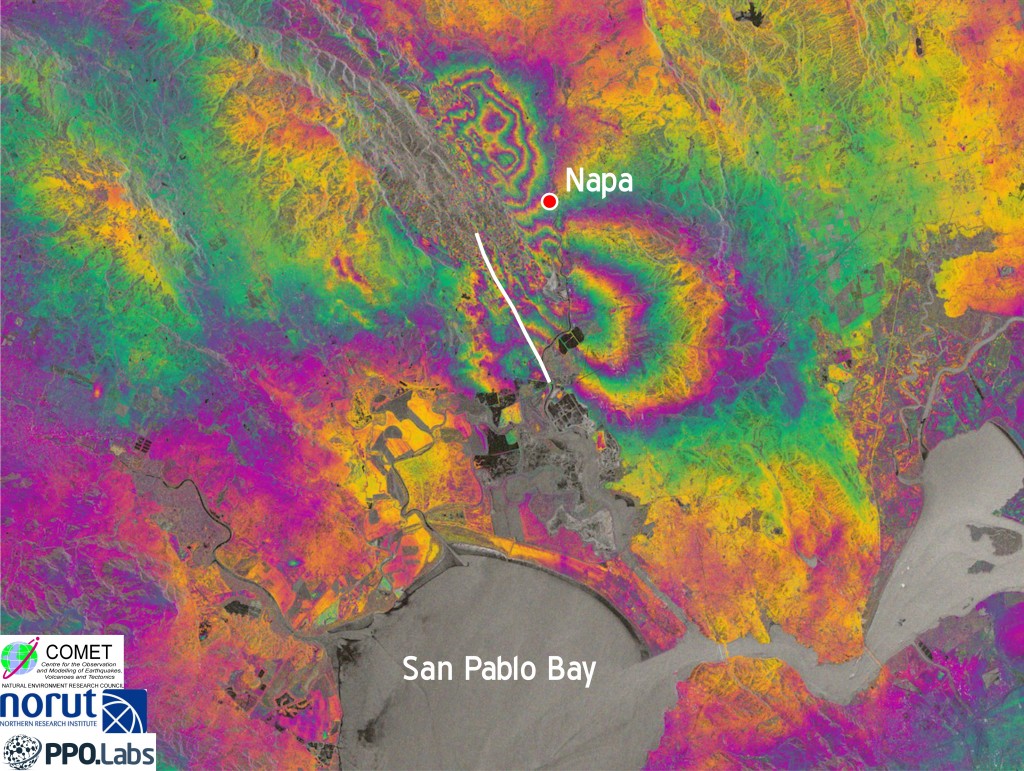
Sentinel-1A interferogram of the ground deformation due to the August 24th earthquake, Napa, California. The surface fault rupture (mapped in the field by UC Davis scientists) is shown by the white line. Image created by Dr Yngvar Larsen, from the research institute Norut in Norway, and Dr Petar Marinkovic, from PPO.labs in the Netherlands. Copyright: Copernicus data (2014)/ESA/PPO.labs-Norut–COMET-SEOM Insarap study.
The interferogram was created by COMET collaborators Dr Yngvar Larsen, from the research institute Norut in Norway, and Dr Petar Marinkovic, from PPO.labs in the Netherlands. Sentinel-1A was launched on 3 April 2014, but it only reached its final operational orbit on 7 August. The pre-earthquake image was acquired on that day. By comparing it with an image acquired on 31 August, it is possible to create a map of the surface deformation caused by the magnitude 6.0 earthquake by looking at the difference in time it takes the signal to reach the satellite.
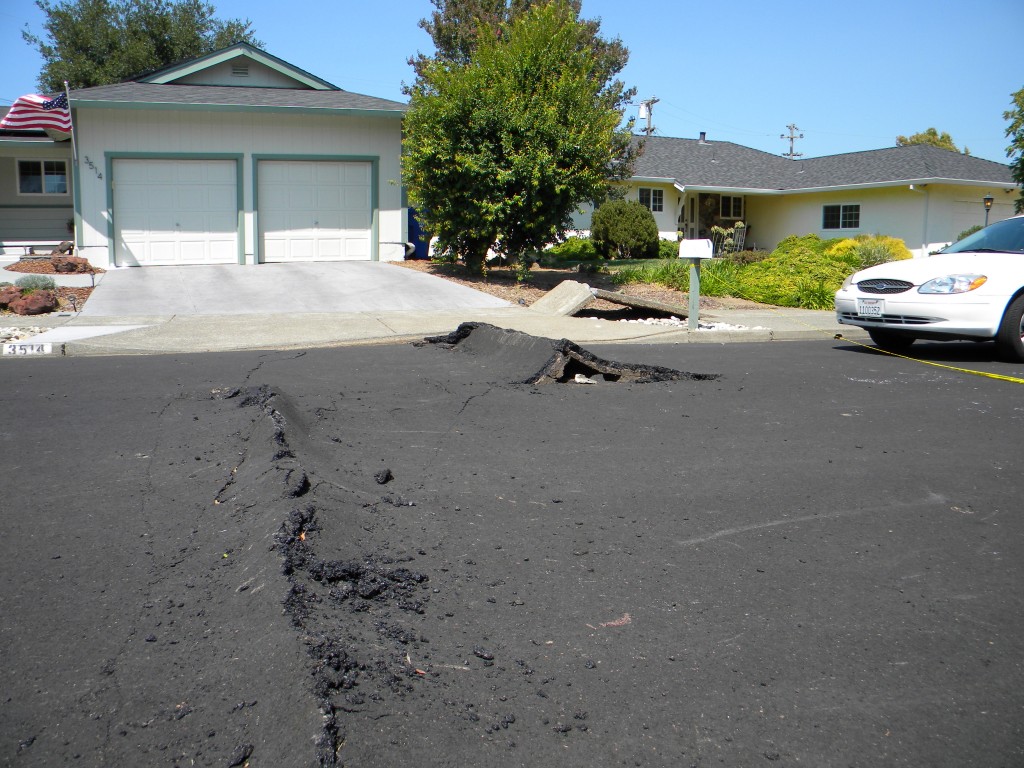
Fault damage in the suburbs west of Napa, California from the August 24th magnitude 6 earthquake. The fault rupture ran through homes and across roads, buckling the tarmac surface and pavements, resulting in damage expected to cost hundreds of millions of dollars. Photo credit: Austin Elliott, UC Davis.
The earthquake occurred north of the Bay Area, California, in a part of the fault system which runs down the length of California and includes the San Andreas Fault. However, this particular earthquake occurred on one of the parallel fault systems 40 km east of the San Andreas. This earthquake is the biggest to hit the San Francisco Bay Area since the Mw 6.9 Loma Prieta earthquake in1989, although this most recent earthquake was many times smaller.
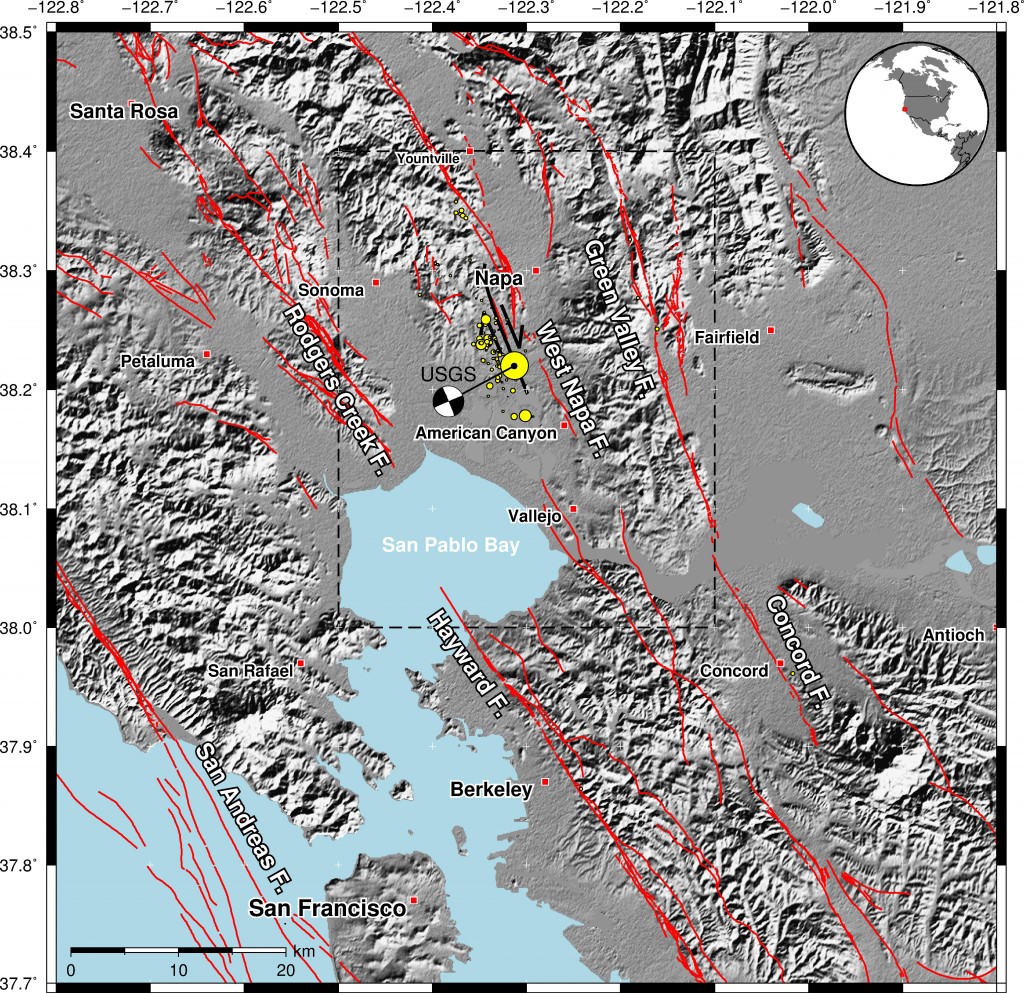
Fault map (red lines) of the region around the Napa Valley earthquake, California. The fault rupture (mapped by UC Davis scientists) resulting from the August 24 earthquake is shown by the black line, south-west of Napa. The mainshock and smaller aftershocks are denoted by the yellow circles. Earthquake locations and existing fault locations sourced from USGS. The dashed line denotes the regions shown in the other figures.
The extent of the ground deformation in interferogram shows that the fault slip which occurred in this earthquake continues further north than the extent of the mapped rupture at the surface. The interferogram shows that the southeast-side of the rupture has moved towards the satellite by about 10cm, whilst the northern portion has moved away by 10cm. Whilst most of the motion in a strike-slip earthquake is horizontal in the direction of the fault, the ground motion at the end of these fault ruptures is a combination of fault perpendicular and vertical. This interferorgam shows up-down and to a lesser extent east-west motions. On the east side of the fault, these motions are in the same direction, either both towards or both away from the satellite, resulting in a large signal. However on the western side of the fault, the east-west and vertical motions are in the opposite sense, cancelling each other out and explaining the asymmetry seen in the deformation pattern across the fault.
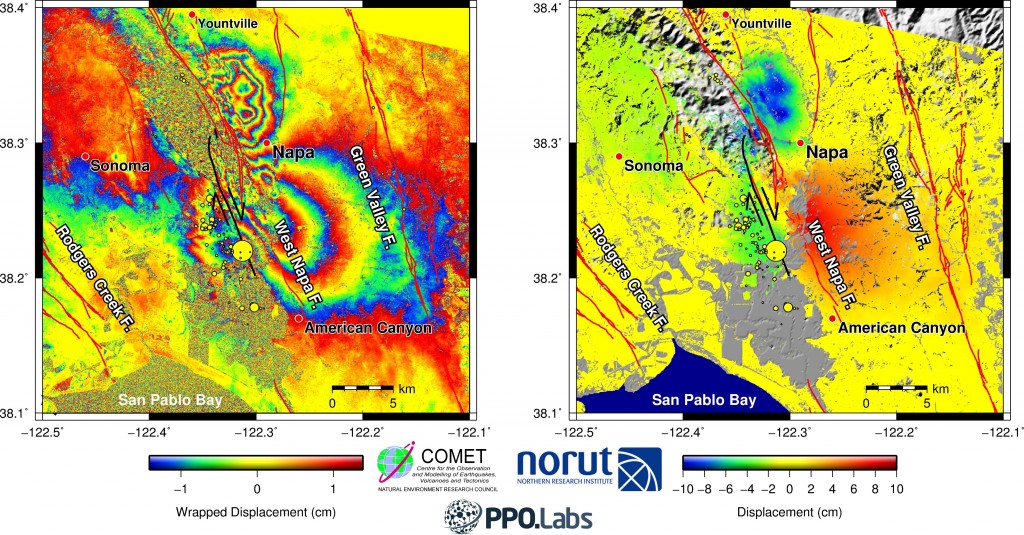
(left) Sentinel-1A (European Space Agency) interferogram of the ground deformation from the Napa earthquake. The contours show the ground motion towards and away from the satellite. The black line denotes the surface rupture mapped in the field by scientists from UC Davis. (right) The same interferogram processed to show the total motion towards and away from the satellite. South of the town of Napa, the ground has moved towards the satellite by up to 10 cm (red colours), whereas to the north it has moved away by 10 cm (blue colors). Despite being a strike-slip earthquake in which most motion is horizontal, the satellite measures mainly vertical and east-west motion and sees the ends of the rupture bulge up (and eastwards) at one end (towards the satellite in the south) and down (and west) at the other. The mainshock and smaller aftershocks are denoted by the yellow circles. Earthquake locations and existing fault locations (red lines) are sourced from the USGS. Copyright: Copernicus data (2014)/ESA/PPO.labs-Norut–COMET-SEOM Insarap study.
The small surface displacements measured in the interferogram agree with the small offsets measured in the field by geologists surveying the fault rupture, who find displacements in roads and kerb stones of about 10-20 cm.
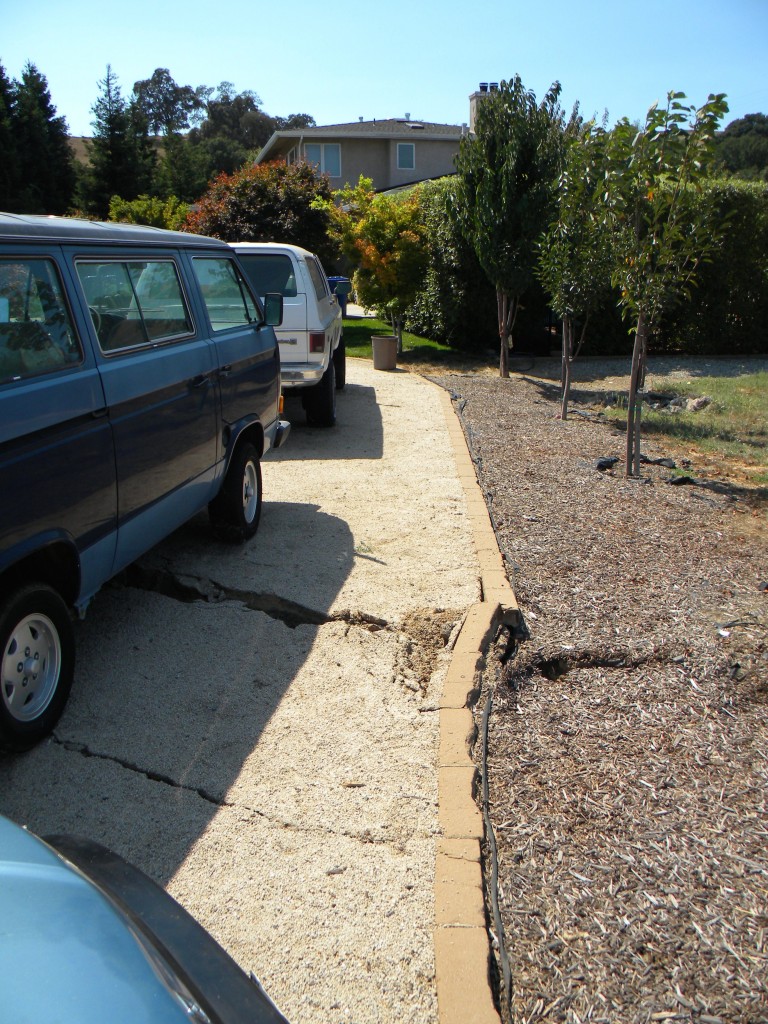
The surface rupture offset kerb stones to the right by about 10-20 cm. This relative motion is consistent with the right-lateral strike-slip faulting in this earthquake. This photo is taken at the northern end of the fault rupture, on the West side of Napa. Photo credit: Austin Elliott, UC Davis.
The interferogram also reveals other portions of the fault system that have moved slightly in this event. Sharp lines in the interferogram known as discontinuities, show minor movements on other faults, such as the part of the West Napa Fault system that crosses Napa airport.
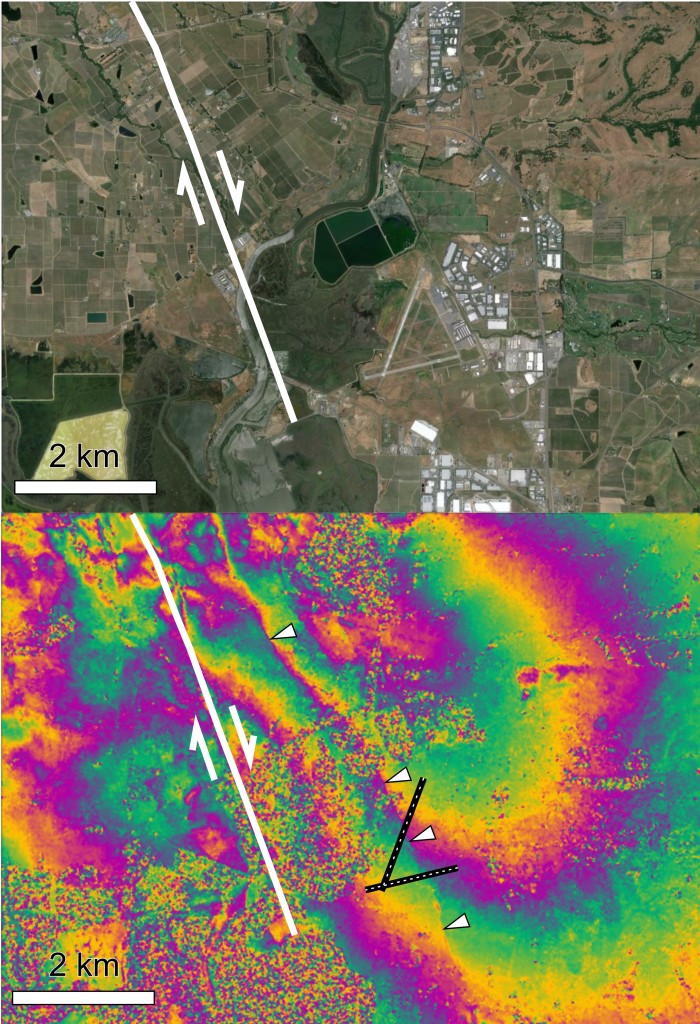
(top) Satellite image of Napa County Airport, five miles south of Napa (GoogleEarth) and the southern extent of the mapped surface rupture (shown in white, UC Davis). (bottom) Sentinel-1A interferogram showing the deformation field around the fault. A small discontinuity running north-south is also visible in the interferogram (marked by white triangles) and is due to minor rupture of a parallel fault strand across the airport runways. Copyright: Copernicus data (2014)/ESA/PPO.labs-Norut–COMET-SEOM Insarap study.
When the Sentinel-1 constellation is fully operational (with the launch next year of the identical Sentinel-1B satellite), the average time delay between an earthquake and a radar acquisition will only be a few days. This will enable COMET & EwF researchers to analyse the surface deformation more quickly following earthquakes.
