
LINES IN THE FANS
Tim Middleton describes some of the fieldwork for his PhD, sampling and mapping fault scarps from the 1739 Yinchuan earthquake in northern China.
The terrain is hard-going. An undulating surface of large boulders stretches for kilometres in every direction; the vans are back by the main road. There is no vegetation and though it is still only March the sun beats down on this barren landscape. In the distance, large, triangular mountains loom out of the haze—the Helanshan are the final frontier before the emptiness of the Alxa desert beyond. Snaking its way across this landscape is a small escarpment. It varies in height but continues for a total distance of about sixteen kilometres, tracking the edge of the Yinchuan basin. It’s this escarpment we’re here to study.
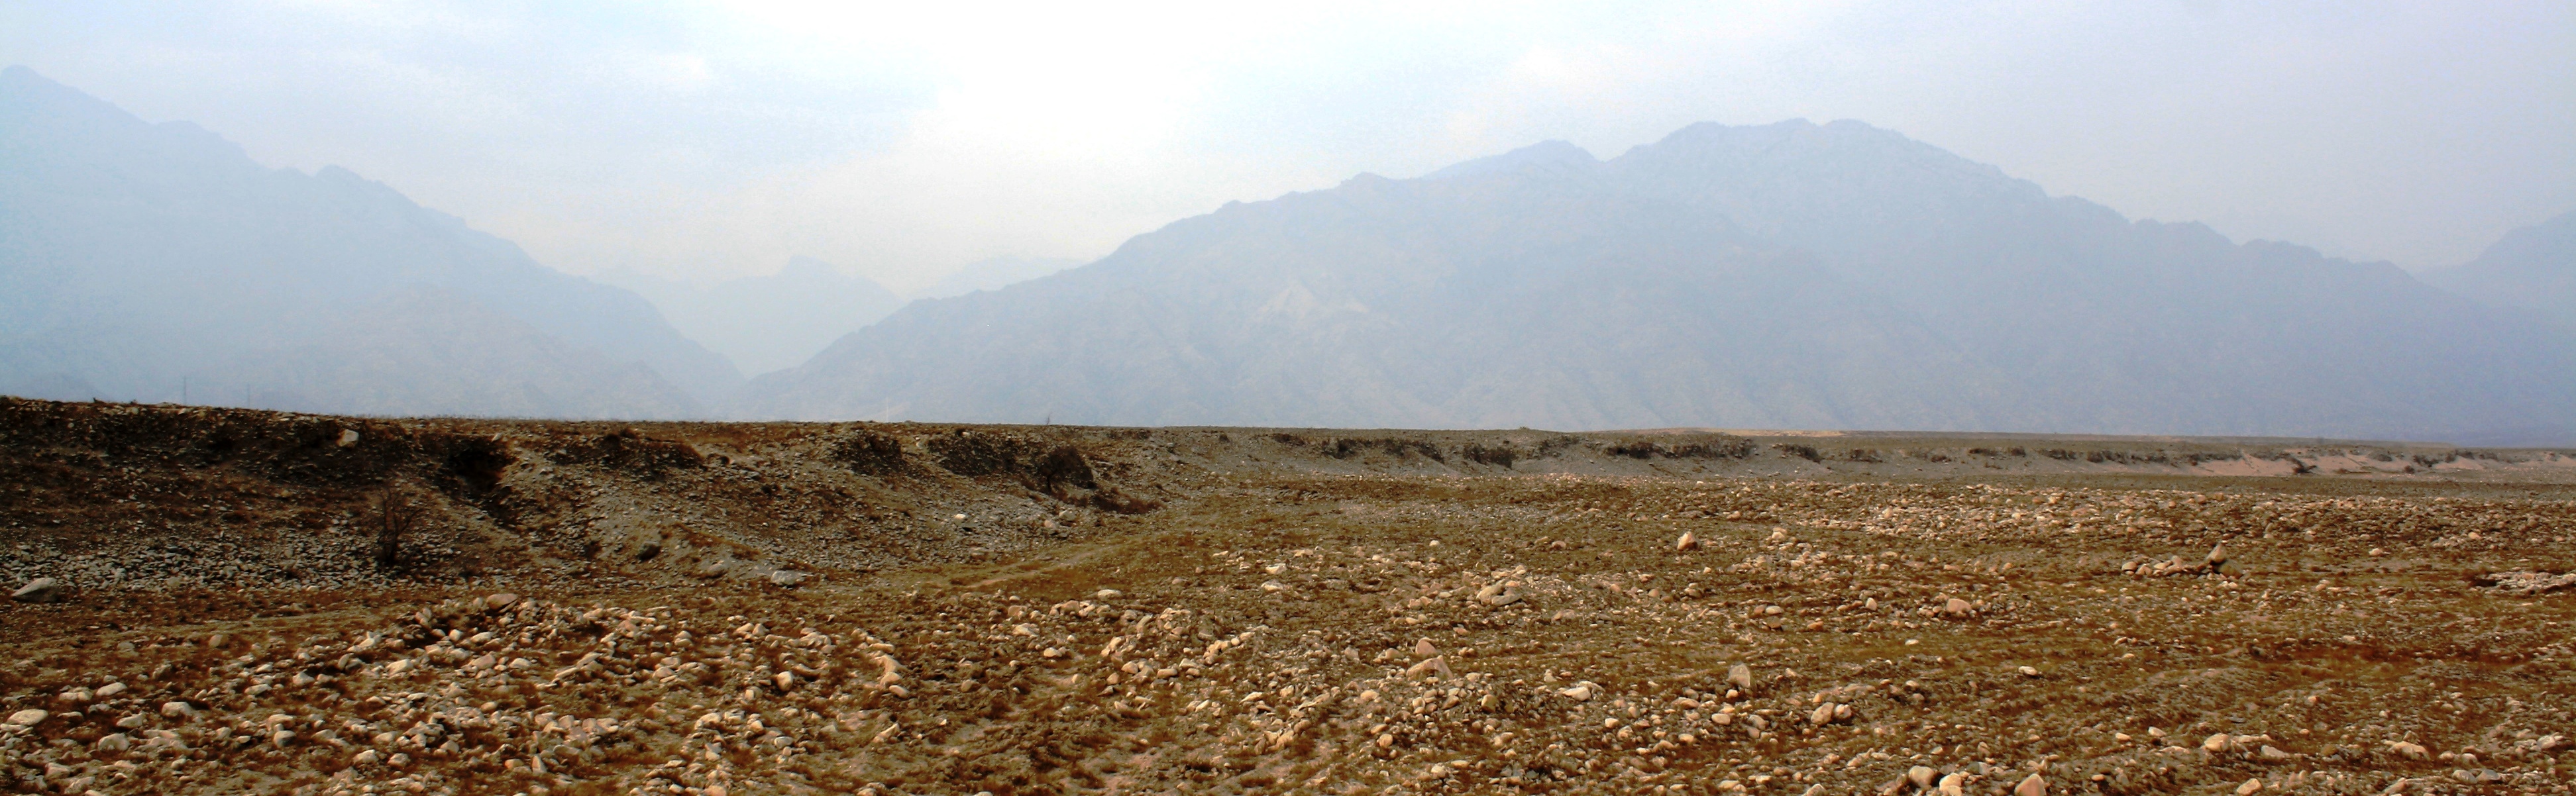
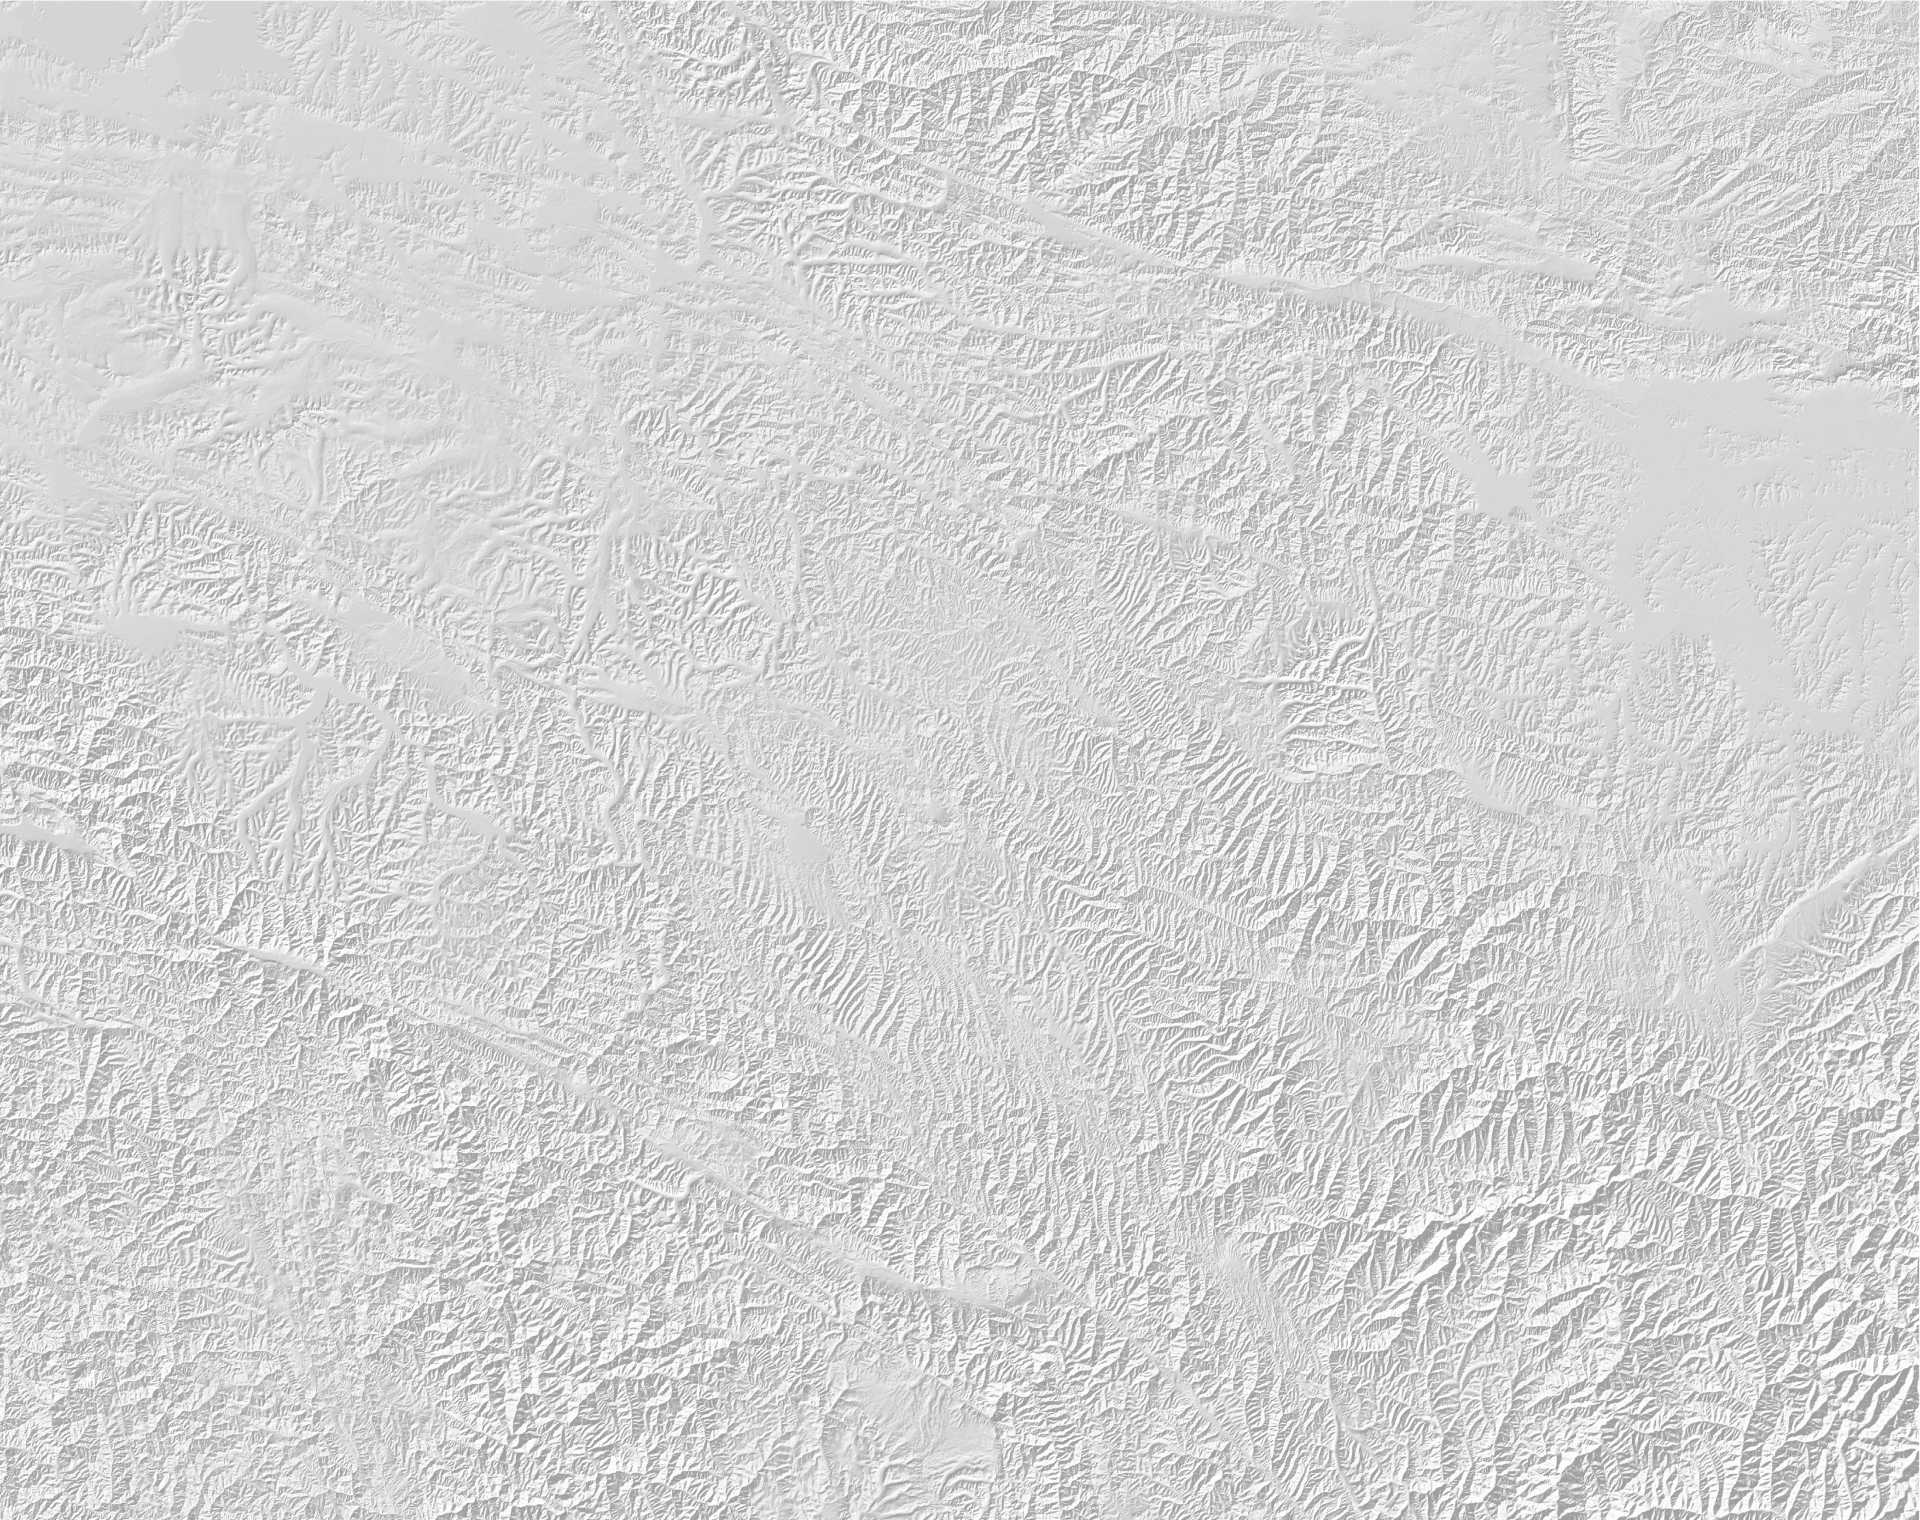
Figure 1: Field photograph of the Suyukou fault scarp. The scarp is around 8 metres high and can be seen cutting across the centre of the picture. In the distance, a few kilometres away to the west, are the Helan Mountains.
On 3rd January 1739, disaster struck; an earthquake with an estimated magnitude of 8.0 shook the entire Yinchuan basin. Temples, pagodas, offices, houses and city walls all collapsed and the major cities of Yinchuan and Pingluo were severely damaged. Eyewitness reports describe cracks in the ground up to 100 metres long. In total, an estimated 50,000 people lost their lives. Subsequent urban development in the towns and cities of the Yinchuan basin has obscured much of the evidence for the 1739 earthquake, but out at the base of the mountains in this arid, desert-like climate evidence of this and older earthquakes remain preserved in the landscape.
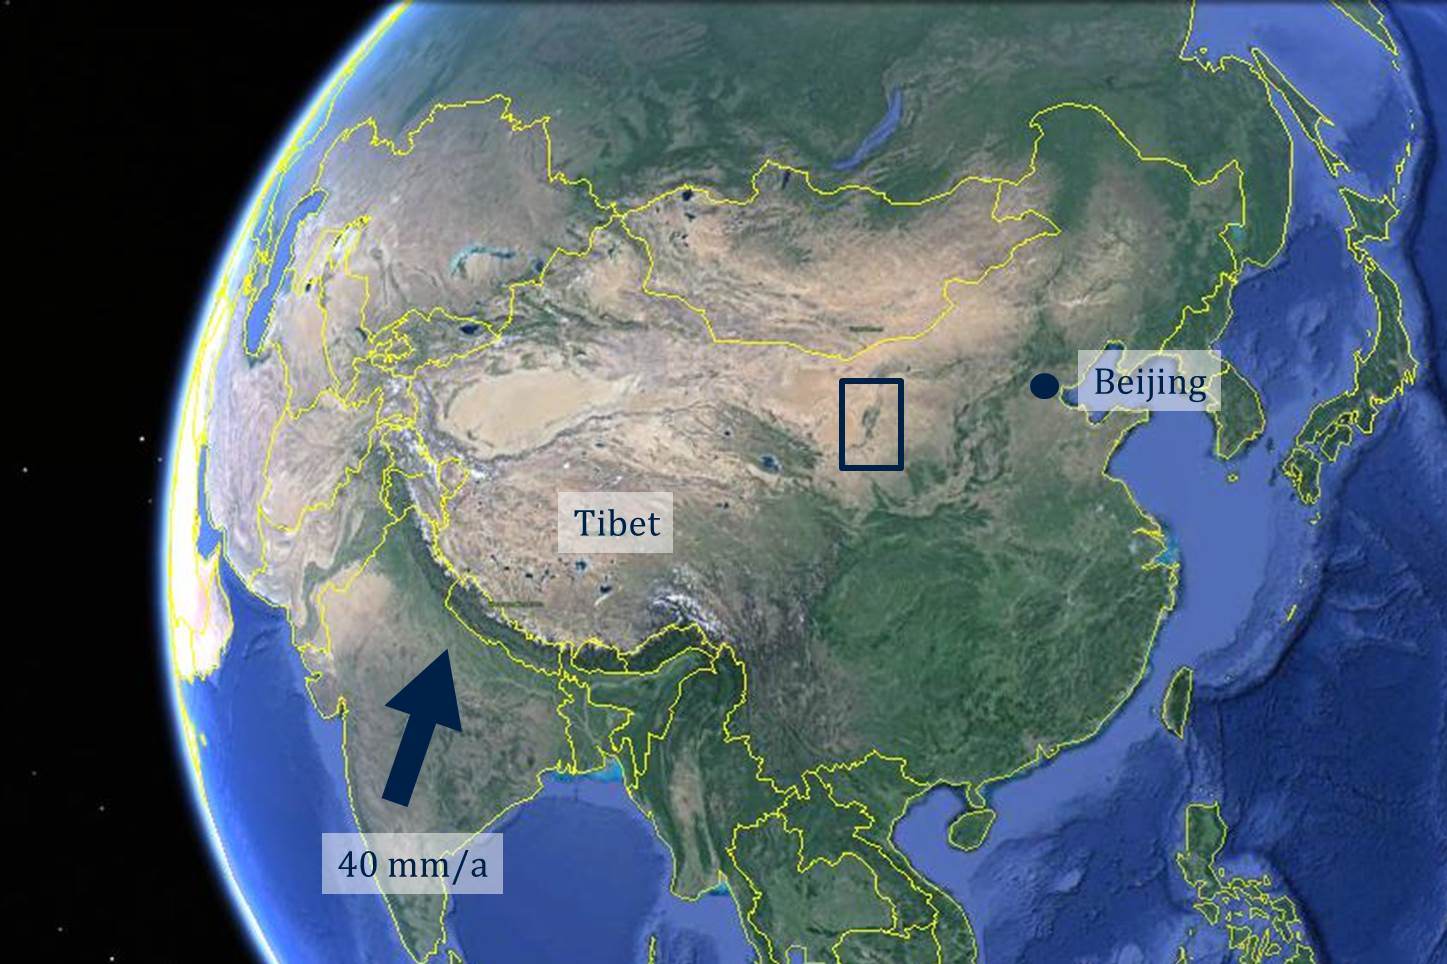
Figure 2: Google Earth image of China. The Yinchuan basin is on the western side of the Ordos Plateau in northern central China. Its location is indicated on the image by a dark blue box.

Figure 3: (Left) Map of the Yinchuan basin. Topographic data is from ASTER GDEM; GPS data is shown by red arrows; and focal mechanisms are from the CMT catalogue. Black lines indicate active faults and are drawn with the aid of topographic data and satellite imagery. The location of the 1739 rupture, along the eastern edge of the Helanshan, is indicated by a bold red line. (Right) Imagery from the Pleiades satellite showing the southern portion of the 1739 rupture. The fault scarp can be seen as a faint white line running from southwest to northeast just above the road.
We want to use the clues in the landscape to try to understand more about what happened in 1739. But time is of the essence if the earthquakes preserved in this landscape are to be recorded. The provincial authorities in the Yinchuan basin are embarking on a major new project. The market for western-style wine in China is ballooning and, as a result, these dry, alluvial fans are to be turned into vineyards. Progress is in its early stages. So far a curious, red-brick road, which meanders across the fault scarp, is the only sign of change. But major earthworks that would destroy these historic and prehistoric fault scarps are clearly in the pipeline.
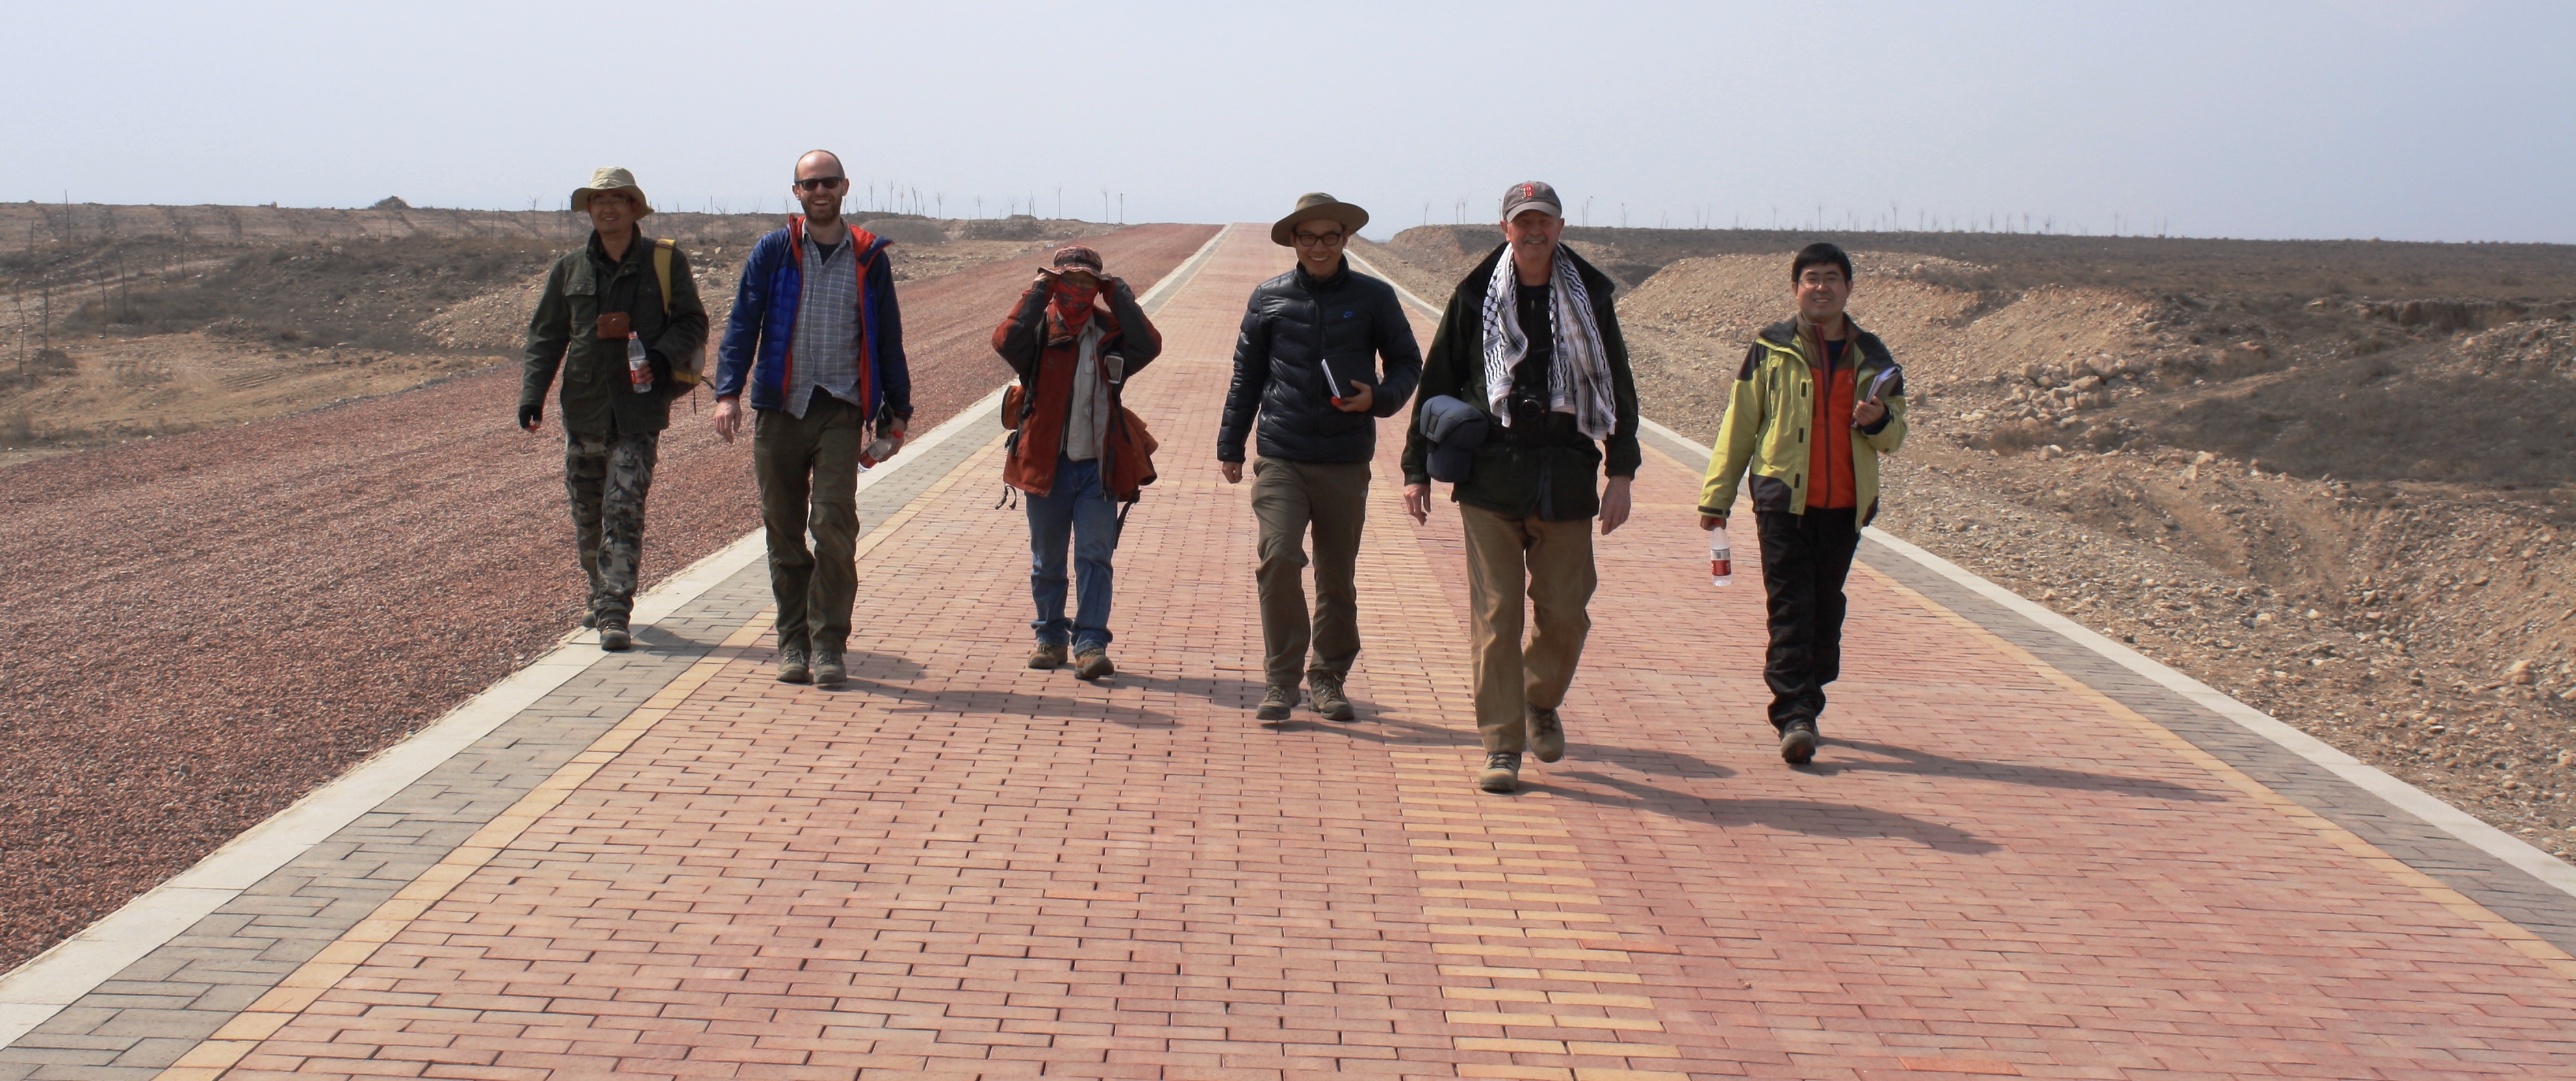
Figure 4: The new red brick road that cuts across the Suyukou escarpment, revealing exposures of the fault that slipped in 1739.
Our approach is twofold. We have acquired high resolution images of the region from the Pleiades satellite, which can be used to map the ruptures. Also, by combining two images taken from different angles we are able to build a three-dimensional model of the topography enabling us to measure offsets at different points along the escarpment. The maximum recorded slip in the 1739 earthquake was 5.3 metres, but much of the escarpment is taller than this; these taller scarps therefore represent previous earthquakes. From our maps of these scarps we are able to distinguish at least three separate events.
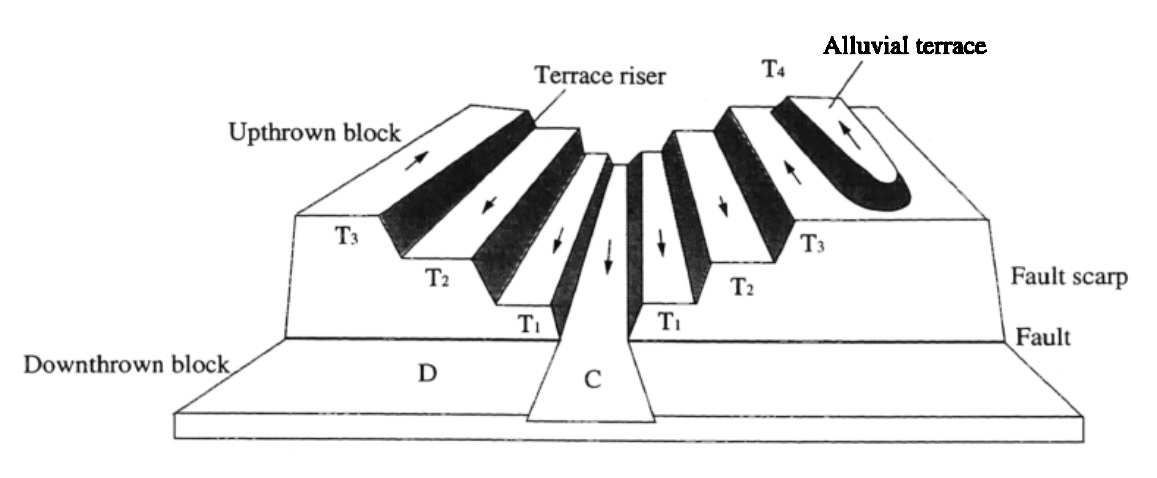
Figure 5: Diagram from Deng & Liao (1996) showing an escarpment of varying heights. According to their model: T1 represents the most recent earthquake (i.e. the 1739 event), T2 represents the cumulative offset in the last two earthquakes, and T3 represents the total offset in the last three earthquakes. This pattern is similar to what we observe along the escarpment at the edge of the Yinchuan basin.
The second step is to investigate the scarps in the field. We visited the Yinchuan basin in March 2014 and collected various samples for dating. These dates will enable us to say when these three earthquakes took place. Radiocarbon samples from soils that have accumulated against the escarpment should post-date the most recent earthquake, whilst sediment samples from within the escarpment itself should be older than the earthquake in question. By building up a chronology for the previous earthquakes on this fault we can suggest roughly how often earthquakes occur and when we might expect the next one to be.
At another field site, 60 kilometres to the north, it appears as though part of the Great Wall of China was destroyed in the 1739 event. This particular section of the wall was built in 1531, during the Ming Dynasty, and is made of adobe bricks. No other major earthquakes have occurred in the Yinchuan basin since 1531 and so it is highly likely that the 1739 event was responsible for the damage.
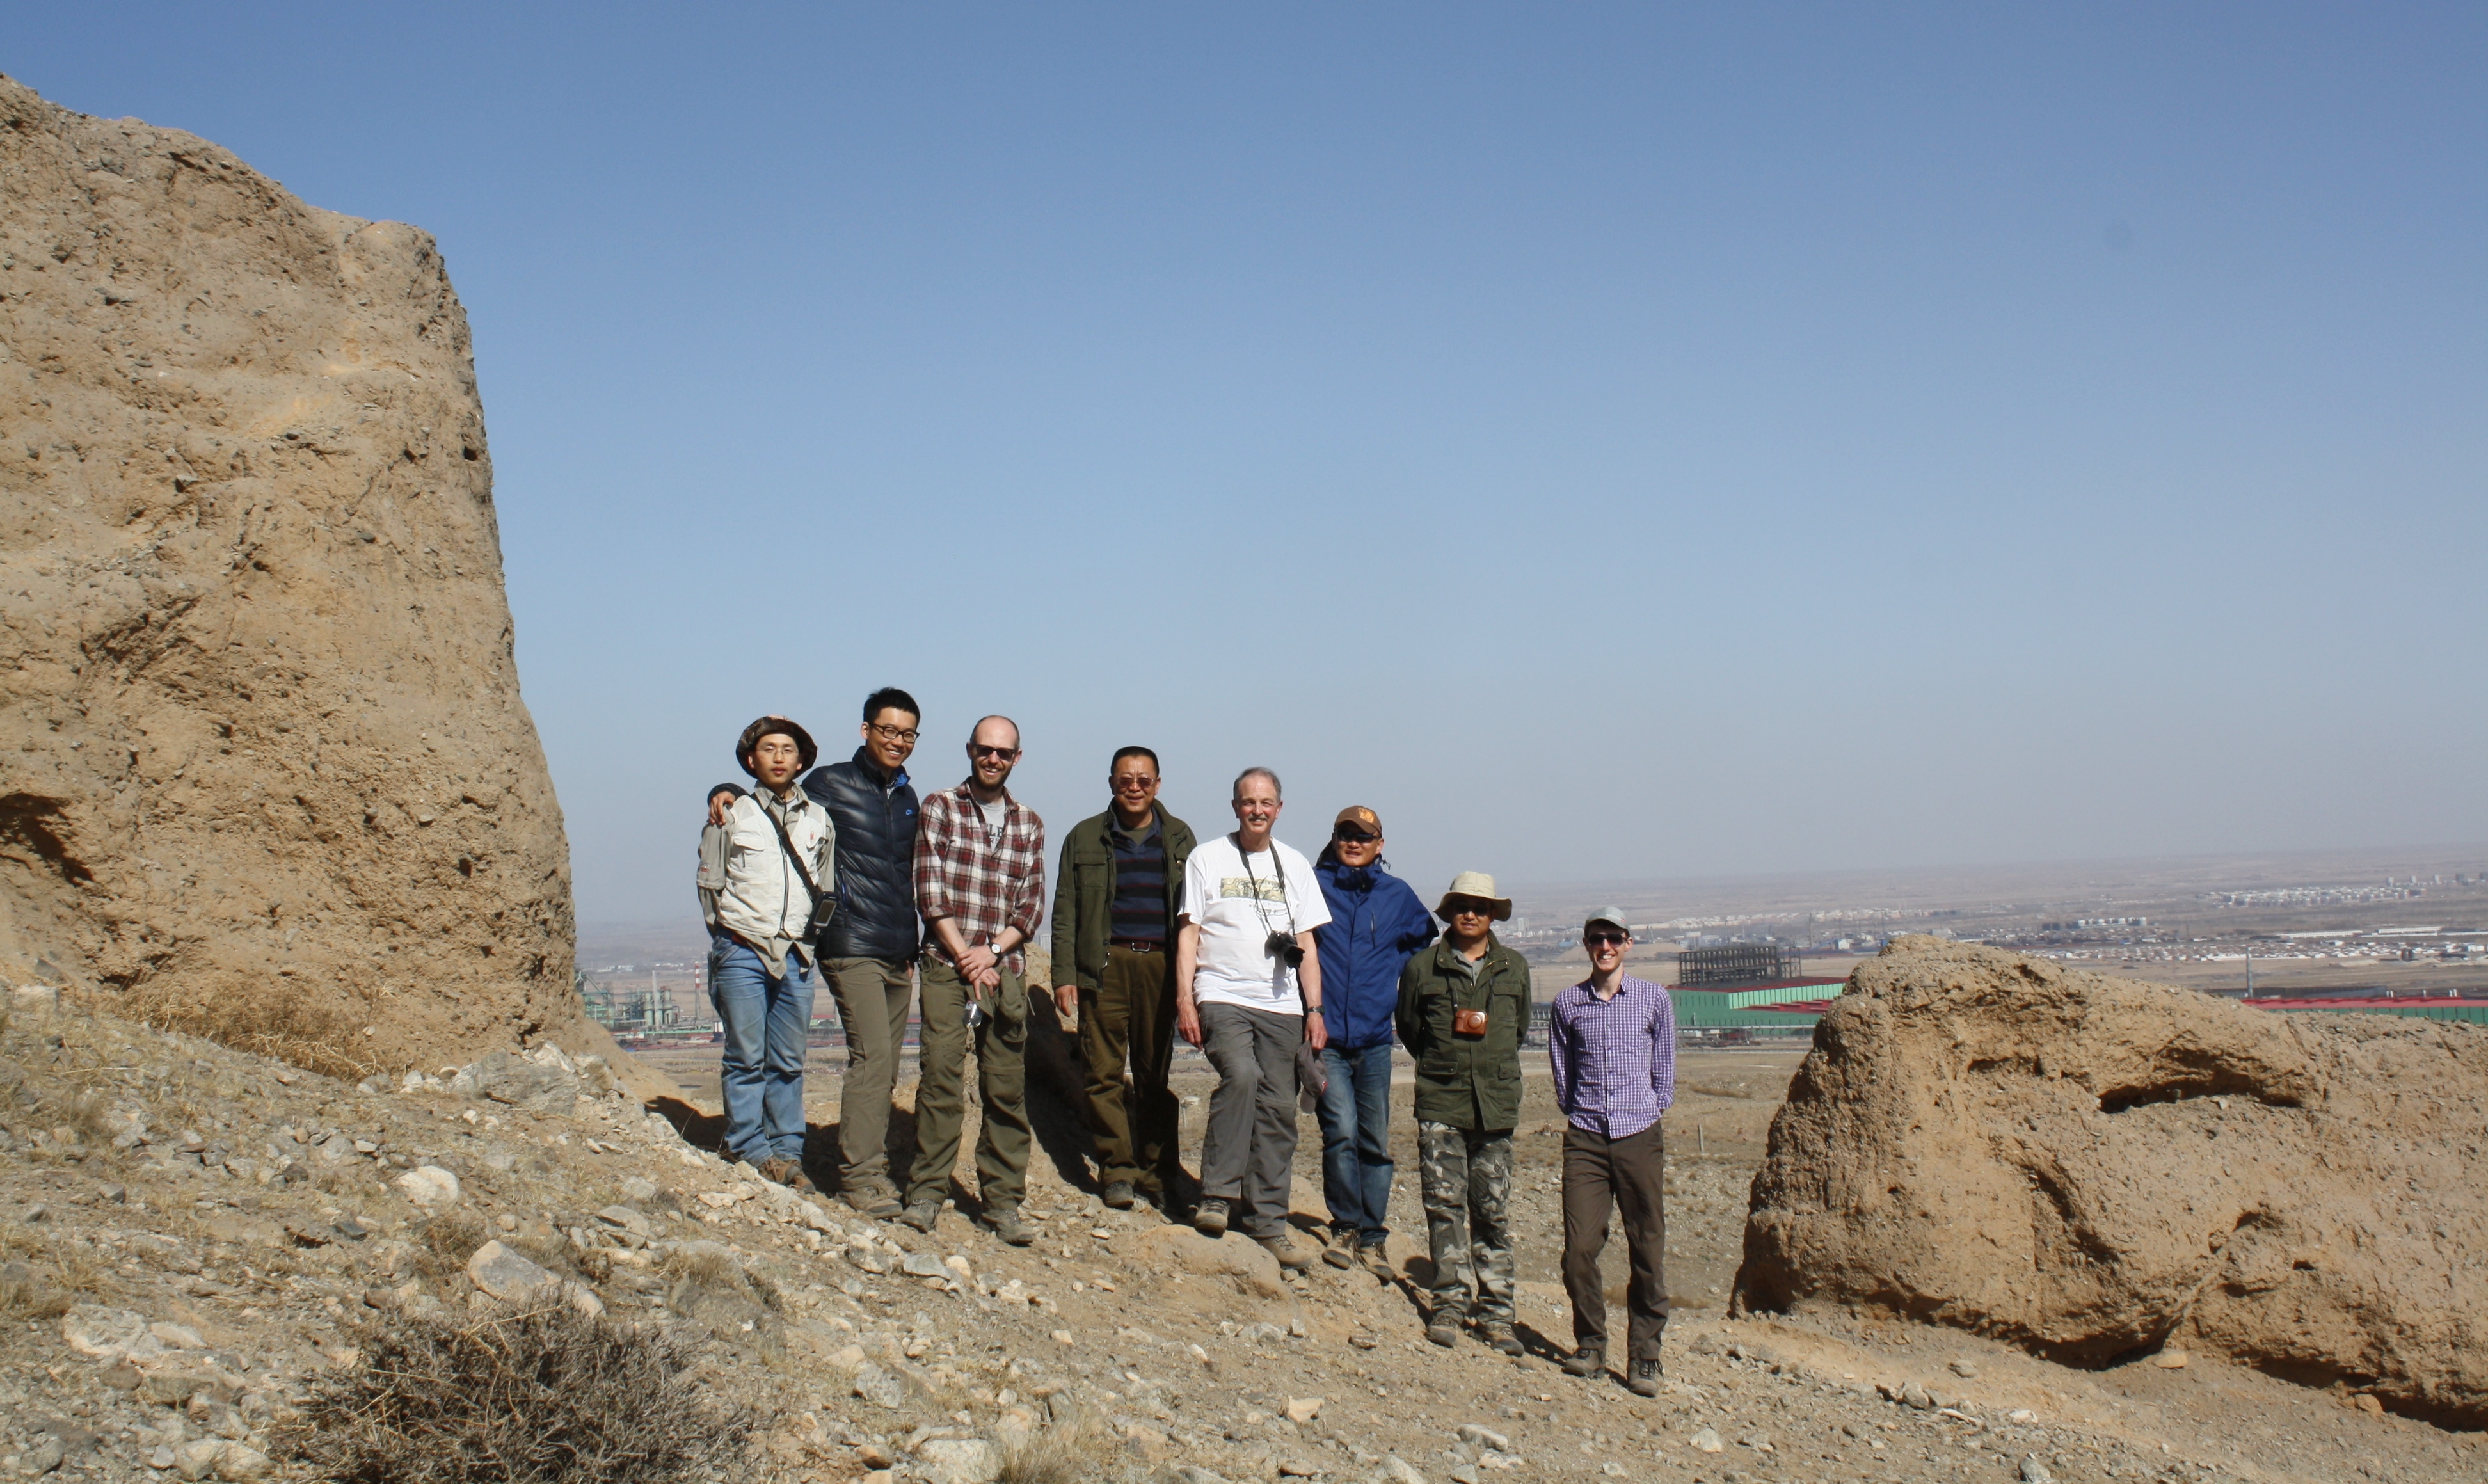
Figure 6: The field team at the site of the break in the Great Wall of China.
Since 1739 the population of the Yinchuan basin has increased dramatically and the area is now home to around three million people. Major infrastructure projects, including the new vineyards, are taking shape at a rapid rate. Understanding the earthquake risk in the region is clearly of vital importance.
With thanks to Qiyun Lei, Zhikun Ren, Xiaogang Song, Wuxiong Cheng, Zhigang Ma and the Institute of Geology at the China Earthquake Administration in Beijing for all of their assistance in the field.